
I. INTRODUCTION
NO x is potentially harmful to humans as a kind of primary pollutant. And NO x are the main cause of many environment problems, such as acid rain, surface ozone pollution, and particulate matter 2.5. Reference Tang, Hao, Xu and Li1 The emission of NO x was 2337.8 tons in China in 2011 and 2275.4 tons in 2012. 2 Emission standard of air pollutants for thermal power plants which came into effect on January 1, 2012 requires the emission concentration of NO x under 100 mg/m3.
Selective catalytic reduction (SCR) of NO x with NH3 is the most promising method to remove NO x . Catalysts with high activity play a decisive part in low-temperature SCR technology. Many researches about metal oxide as SCR catalyst support have been reported recently, such as TiO2, Reference Qi and Yang3 Al2O3, Reference Sullivan and Doherty4 activated carbon Reference Zhu, Liu, Niu, Liu, Hu, L and Xie5,Reference Yoshikawa, Yasutake and Mochida6 and molecular sieve. Reference Delahay, Valade, Guzmfin-Vargas and Cop7 Zirconium oxide has attracted considerable attention recently as a catalyst support because of its special characteristics. Cao et al. Reference Fan, Xiang, Su, Wang, Sun, Hu and Lei8 found that incorporating the Zr4+ ions into the CeO2 crystal could form solid solution, and increase the BET surface area and poresit, comparing with Mn–Ce catalyst. Yan et al. Reference Yan, Hu and Xu9 reported that the existence of ZrO2 in catalysts can enhance the dispersion of CeO2 on catalysts which results in high activity of the catalysts. Takahashi et al. Reference Takahashi, Suda and Hachisuka10 investigated the influence of various compositions of TiO2 and ZrO2 on NO x removal over a sulfur-treated NOx storage and reduction (NSR) catalyst and found that TiO2–ZrO2-supported metal oxide catalysts have the best catalytic activity. Reddy et al. Reference Reddy, Khan, Yamada, Kobayashi, Loridant and Volta11 investigated structural characteristics of nano-sized ceria–silica, ceria–titania, and ceria–zirconia mixed oxide catalysts and found that these mixed oxides exhibit better redox properties than pure CeO2. Song et al. Reference Song, Ping, Zhang, Li, Zhang, Wang, Liu and Huang12 found that CeO2–ZrO2–WO3 catalyst exhibits high performance and superior hydrothermal stability at high temperature, it can achieve over 90% of NO x conversion at 250–525 °C. The experimental and kinetic model by Shen et al. Reference Shen, Wang, Wang and Liu13 indicated that MnO x (0.6)/Ce0.5Zr0.5O2 catalyst has good resistance to H2O and SO2 and has high N2 selectivity.
It is well known that ZrO2 exists mainly in three polymorphs with monoclinic (m-ZrO2), tetragonal (t-ZrO2), and cubic (c-ZrO2) structures. Reference Zhen and Chen14 ZrO2 polymorphs have different amphoteric characters connected to surface hydroxyl groups. The crystalline phase of ZrO2 has a great effect on the structure, activity, and selectivity of catalysts. Therefore, it is valuable to investigate the effects of nanocrystalline zirconia polymorphs on catalytic properties of MnO x –CeO2/ZrO2 catalysts which few researchers have concerned about. In this study, we investigated the catalytic activity and resistance to SO2 poisoning of SCR catalysts with manganese oxide and cerium oxide supported on pure t-ZrO2.
II. EXPERIMENTAL METHODS
A. Catalyst preparation
Pure nanocrystalline tetragonal zirconia (t-ZrO2) was prepared by coprecipitation based on our previous researches. Reference Guan, Gong, Liu and Yang15 A series of manganese oxide and cerium oxide supported t-ZrO2 catalysts with varying active component content (MnO x –CeO2) from 5 to 30 wt% were prepared by wet impregnation method. The molar ratio of Mn/Ce was 2. Reference Liu and Yang16 MnO x –CeO2/t-ZrO2 catalyst samples were finally prepared through calcining at 500 °C for 4 h after being heated at 120 °C for 12 h.
B. Catalytic activity tests
SCR activity measurements were carried out in a fixed-bed reactor at 30–240 °C containing 3 mL catalyst with a gas velocity (GHSV) of 32,000 h−1. Particle size of catalysts was 40–60 mesh. The typical reactant gas consisted of 0.05 vol% NO, 0.05 vol% NH3, 7–8 vol% O2, 0.025 vol% SO2 (when needed) and the balance was N2. SO2 was introduced into the flue gas to investigate the resistance to SO2 poisoning when 100% of NO conversion was reached at 130 °C. The reactants were all sent out from gas cylinder and preheated in a gas mixer, and then the mixed gas was sent to the reactor. The concentrations of NO and N2O in the inlet and outlet streams of the reactor were monitored using an on-line MGA5 flue gas analyzer.
The conversion of NO was calculated by
 $${\left[ {{\rm{Conv}}.} \right]_{{\rm{NO}}}} = {{{{\left[ {{\rm{NO}}} \right]}_{{\rm{in}}}} - {{\left[ {{\rm{NO}}} \right]}_{{\rm{out}}}}} \over {{{\left[ {{\rm{NO}}} \right]}_{{\rm{in}}}}}} \times 100\% \quad ,$$
where [Conv.]NO is NO conversion efficiency and [NO]in and [NO]out refer to the NO concentration at the reactor inlet and outlet, respectively.
C. Catalyst characterization
X-ray diffraction (XRD) studies were carried out on a DX2500 diffractometer (Rigaku Corporation, Tokyo, Japan). BET tests were carried out on a NOVA 1000e surface area measurement (Quantachrome Instruments, Shanghai, China). X-ray photoelectron spectroscopy (XPS) tests were carried out on an escalab 250Xi x-ray photoelectron spectrometer (Thermo Fisher Scientific, Waltham, Massachusetts). Transmission electron microscopy (TEM) tests were carried on a H7650 transmission electron microscope (Hitachi Corp., Tokyo, Japan). Temperature-programmed reduction of H2 and also temperature-programmed desorption of NH3 were carried out on TP-5000 III Multi-purpose adsorption instrument (XianQuan Company, Tianjin, China). Fourier transform infrared spectroscopy (FT-IR) tests were carried on an iS5 Fourier transform infrared spectrometer (Thermo Nicolet Corporation, Madison, Wisconsin).
III. RESULTS AND DISCUSSION
A. Catalytic activity
1. Effect of active component on catalytic activity
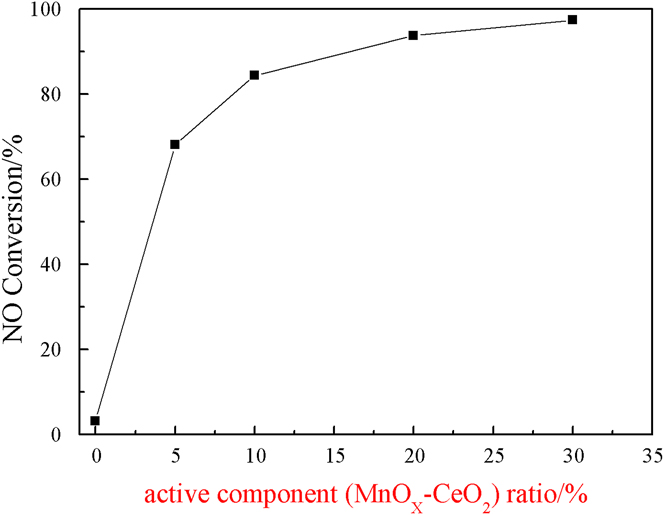
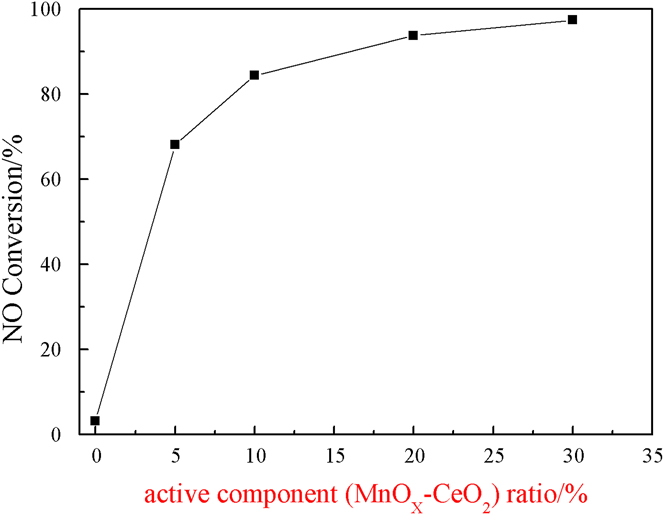
The activity of the prepared catalyst with the variation of active component is presented in Fig. 1. It can be seen from Fig. 1 that pure tetragonal zirconia has almost no catalytic activity for the low-temperature SCR of NO with NH3 and the activity increased with the increasing active component. The NO conversion of 5 wt% MnO x –CeO2/t-ZrO2 was 68.1% at 100 °C while that of 30 wt% MnO x –CeO2/t-ZrO2 was 97.4%.
Variations of NO conversion efficiency with active component for prepared MnO x –CeO2/t-ZrO2 catalysts at 100 °C.
2. Effect of temperature on catalytic activity
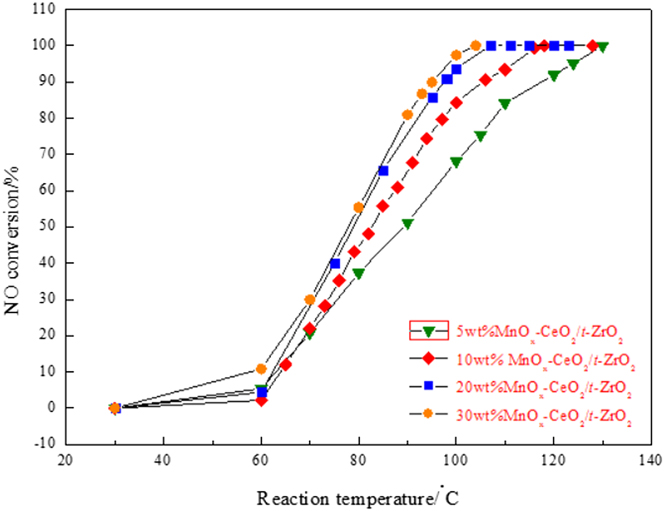
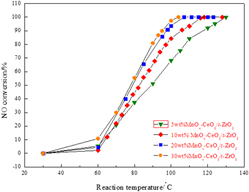
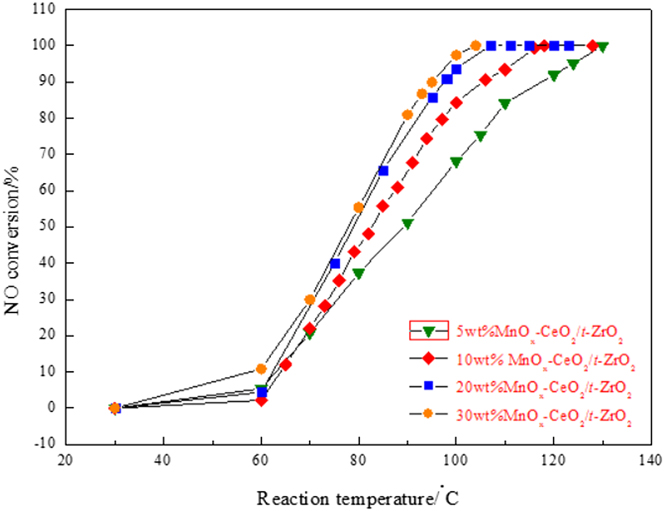
The activity of the prepared catalyst with the variation of temperature from RT to 130 °C is presented in Fig. 2. It can be seen that the NO conversion of all samples increased with the increasing temperature. The MnO x –CeO2/t-ZrO2 catalyst showed high catalytic activity for the low-temperature SCR of NO with NH3. The NO conversion of 5 wt% MnO x –CeO2/t-ZrO2 was 51.3% at 90 °C while that of 10 wt% MnO x –CeO2/t-ZrO2, 20 wt% MnO x –CeO2/t-ZrO2 and 30 wt% MnO x –CeO2/t-ZrO2 were 67.5%, 75.4, and 81%, respectively. 100% NO conversion of 5 wt% MnO x –CeO2/t-ZrO2, 10 wt% MnO x –CeO2/t-ZrO2, 20 wt% MnO x –CeO2/t-ZrO2, and 30 wt% MnO x –CeO2/t-ZrO2 were obtained at 130, 118, 107, and 104 °C, respectively.
Variations of NO conversion efficiency with temperature for prepared MnO x –CeO2/t-ZrO2 catalysts with different MnO x –CeO2 dopant contents. Conditions: 0.05 vol% NO, 0.05 vol% NH3, 7–8 vol% O2, and balance N2; GHSV = 32,000 h−1.
B. Characterization
1. X-ray diffraction
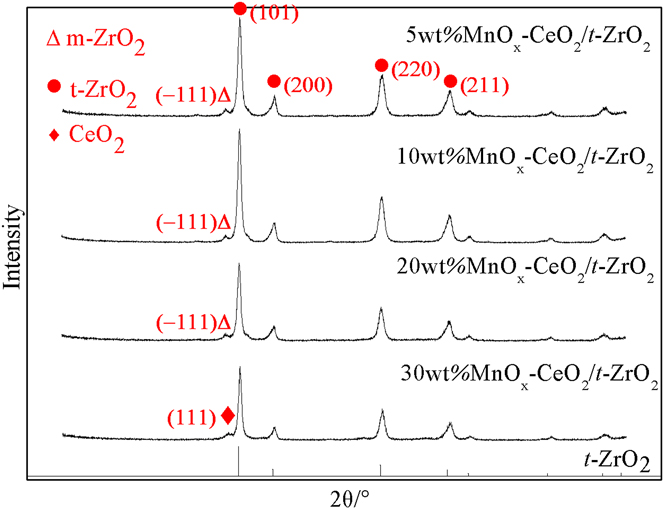
The XRD patterns of various MnO x –CeO2/t-ZrO2 catalysts are shown in Fig. 3. It can be seen that minor diffraction peaks corresponding to monoclinic zirconia were observed for samples with 5, 10, and 20 wt% MnO x –CeO2/t-ZrO2 catalysts. According to quantitative analysis, the ratios of m-ZrO2 are 2.48, 3.41, and 8.74% for 5, 10 and 20 wt% MnO x –CeO2/t-ZrO2 catalysts, respectively. At MnO x –CeO2 noticing of 30 wt%, peaks corresponding to CeO2 were detected and monoclinic zirconia was not observed. This could be because cerium oxide precursors stabilized the tetragonal zirconia polymorph.
XRD patterns of various MnO x –CeO2/t-ZrO2 catalysts with different MnO x –CeO2 dopant contents.
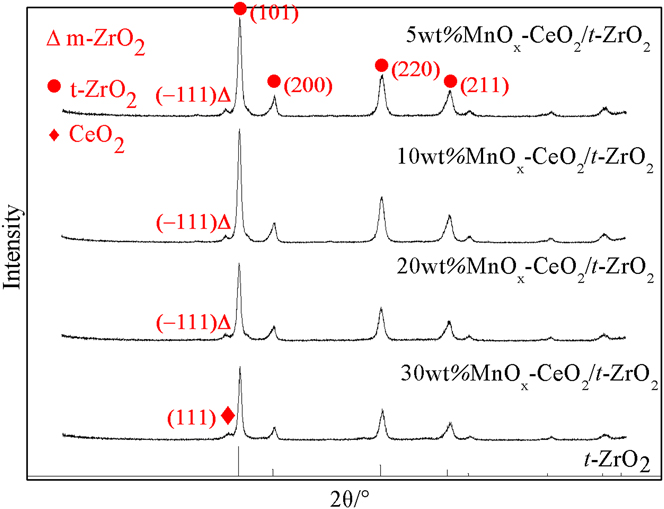
For MnO x –CeO2 ≤20 wt%, the amount of new generated m-ZrO2 increased with increasing active component. This can be explained by the diffusion of precursors into nanocrystalline ZrO2 resulting in the transformation of ZrO2 polymorphs. For all samples, no peaks corresponding to manganese oxide were identified. This indicated that manganese and cerium oxides were well dispersed on the tetragonal zirconia carrier, which was good for SCR reactions. Reference Sager, Kondarides and Verykios17
2. BET surface area and pore size distribution
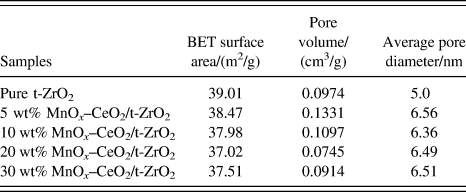
The specific surface areas, pore volumes, and average pore diameters of the MnO x –CeO2/t-ZrO2 catalysts prepared with different amounts of active component are summarized in Table I. Small decreases in surface areas and increases in average pore sizes were observed after MnO x –CeO2 deposited on the pure tetragonal zirconia and calcined. This could be caused by the agglomeration of metallic oxide at the surface of MnO x –CeO2/t-ZrO2 catalysts in calcine process. The pore volume of all samples was in the mesopore size range (d 2–50 nm) which is good for NH3 adsorption.
Physical properties of the catalysts prepared with different amounts of active component.

For further research on catalytic properties of MnO x –CeO2/t-ZrO2 catalysts, 10 wt% MnO x –CeO2/t-ZrO2 catalyst was investigated because 10 wt% MnO x –CeO2/t-ZrO2 catalyst showed a relatively higher SCR activity.
3. X-ray photoelectron spectroscopy
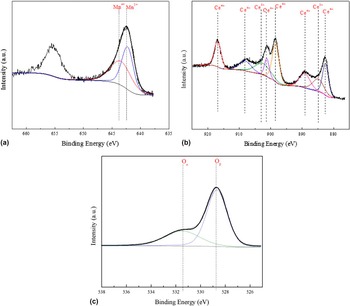
The 10 wt% MnO x –CeO2/t-ZrO2 catalyst samples were analyzed using XPS to identify the surface atomic concentrations of Ce, Mn, and O as detected with the photoelectron spectra of Mn 2p, Ce 3d, and O 1s (in Fig. 4).
XPS spectra of 10 wt% MnO x –CeO2/t-ZrO2 catalyst, (a) Mn 2p; (b) Ce 3d; and (c) O 1s.

The Mn 2p spectra are presented in Fig. 4(a). The Mn 2p region consisted of a spin–orbit doublet with Mn 2p 1/2 with a BE of about 653.3 eV and Mn 2p 3/2 with a BE of 641.7 eV, Reference Zhang, Ji, Zhang and Yang18,Reference Peña, Uphade and Smirniotis19 which are characteristic of a mixed-valence manganese system (Mn4+ and Mn3+). The Mn 2p 3/2 spectra can be split into two peaks. Mn4+ oxidation state is predominant. The Ce 3d spectra are presented in Fig. 4(b), which contain two multiple peaks. The peaks are attributed to Ce4+ or Ce3+ by split, and Ce4+ oxidation state is predominant.
It can be seen in Fig. 4(c), all the O 1s peaks could be fitted into two peaks referred to the lattice oxygen and the chemisorbed oxygen. Reference Xie, Fang, He, Chen, Fu and Chen20 Lattice oxygen is predominant. Surface hydroxide radical has been reported to play an important role in the oxidation of NO to NO2. Reference Wu, Liu and Wang21
4. Temperature-programmed reduction of H2
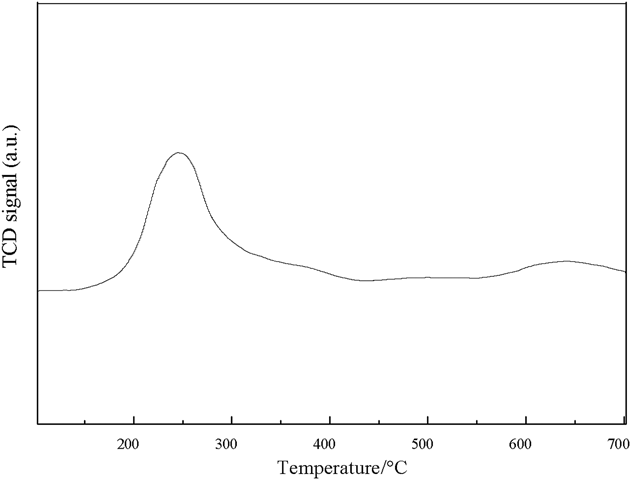
TPR profile of 10 wt% MnO x –CeO2/t-ZrO2 catalyst is shown in Fig. 5. It can be seen that the prominent peak is in the temperature region of 200–400 °C. The peaks correspond to the reduction of MnO2 to Mn2O3 → Mn3O4 → MnO. Reference Thompson and Pembeaon22 This indicates that the reducibility of catalysts is good for the reduction of NO to NO2.
H2-TPR patterns of 10 wt% MnO x –CeO2/t-ZrO2 catalyst.

5. Temperature-programmed desorption of NH3
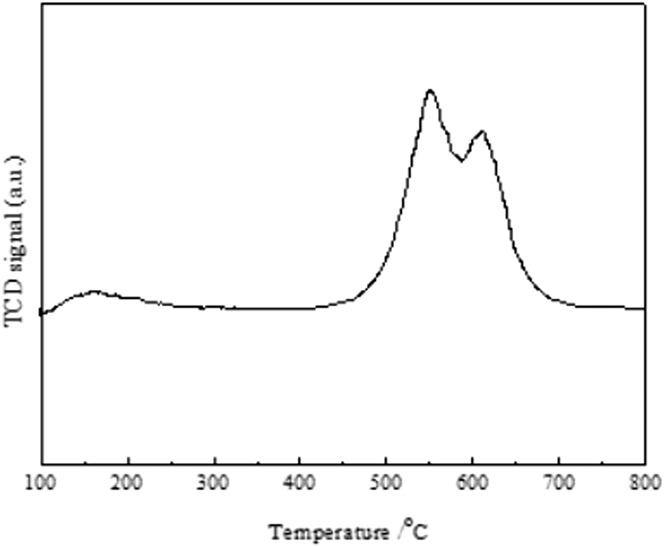
In the present investigation, the acidity measurements have been carried out by NH3-TPD method. The results are shown in Fig. 6. As can be seen from the curve, a weak and moderate peak at 150 °C corresponding to desorption of NH3 adsorbed at weak acid sites was observed. The sharp peaks at temperature region from 450 to 650 °C correspond to desorption of NH3 adsorbed at Lewis acid sites. Lewis acid sites are predominant on the surface of 10 wt% MnO x –CeO2/t-ZrO2.
NH3-TPD pattern of 10 wt% MnO x –CeO2/t-ZrO2 catalyst.

C. Resistance to SO2 poisoning
1. Effect of SO2 on catalytic activity
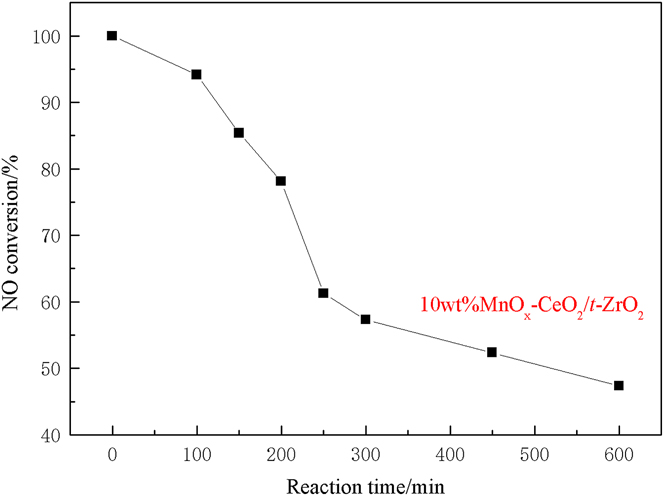
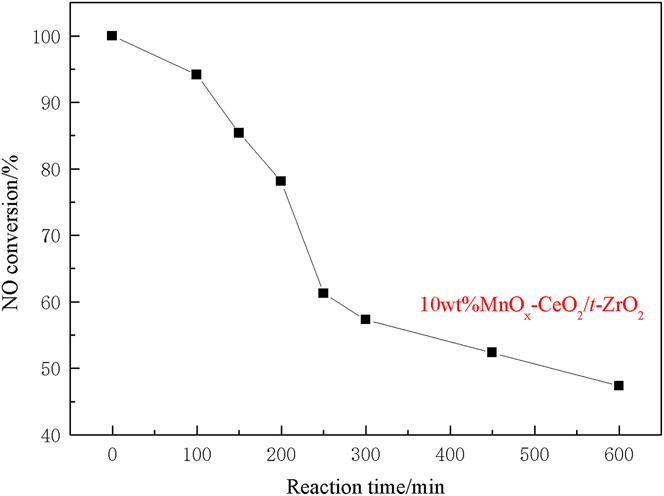
Figure 7 shows the resistance of 10 wt% MnO x –CeO2/t-ZrO2 catalyst to SO2 poisoning during SCR of NO with NH3. As can be seen from the curve, once SO2 was introduced into the treated flue gas, the NO conversion enabled by the catalysts exhibited a rapid decrease, demonstrating that the presence of SO2 in the gas certainly reduced the catalyst activity. Its realized NO conversion could still reach 85% in the tested 2.5 h. But in the next tested 5 h, the conversion dramatically decreased to 47%.
Effect of SO2 on catalytic activity of 10 wt% MnO x –CeO2/t-ZrO2 catalyst at 130 °C.
2. TEM analysis
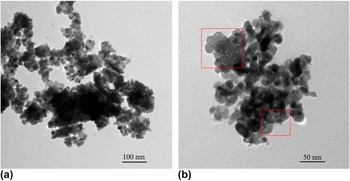
Figure 8 presents the TEM images for fresh and spent 10 wt% MnO x –CeO2/t-ZrO2 catalyst. The TEM image in Fig. 8(a) indicates that active component (MnO x –CeO2) evenly coats the surface of t-ZrO2, catalyst particles are almost same size and the average size is in the range of 20–40 nm, some catalyst particles aggregate together. Figure 8(b) shows that there is considerable amount of many white protuberant depositions on the surface after being poisoned by SO2.
TEM images for 10 wt% MnO x –CeO2/t-ZrO2 catalyst, (a) fresh sample, (b) spent sample.

3. FT-IR analysis
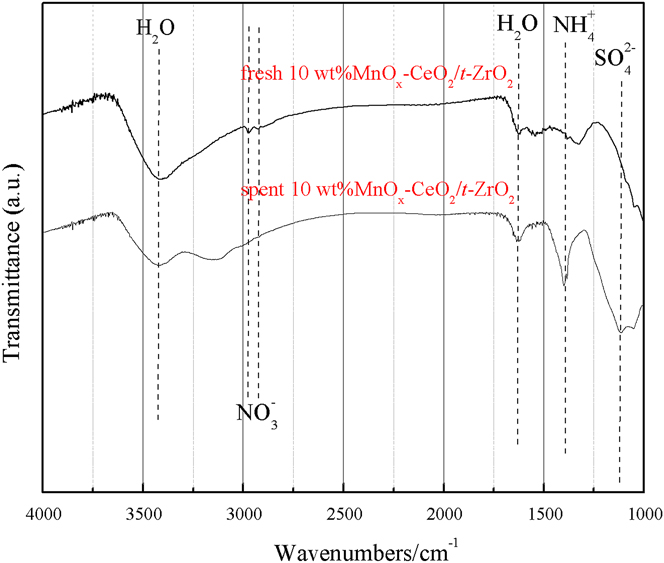
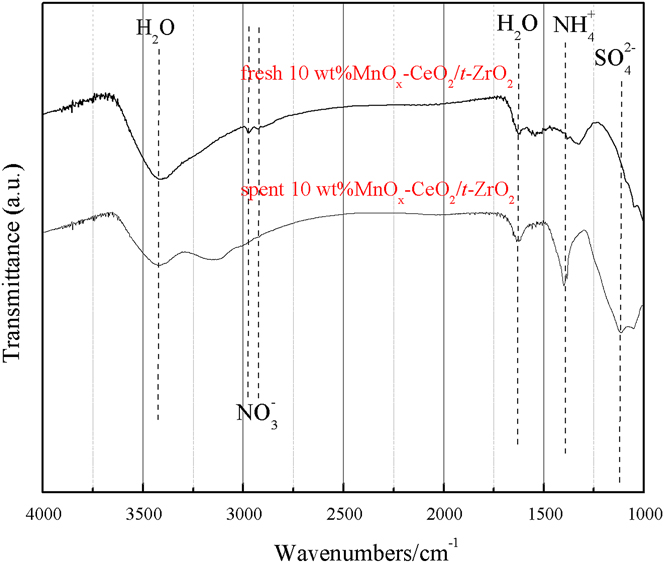
Figure 9 shows the FT-IR spectra of tested fresh and spent 10 wt% MnO x –CeO2/t-ZrO2 catalyst. The spent catalyst was from tests in flue gas for 4 h containing SO2. Both fresh and spent 10 wt% MnO x –CeO2/t-ZrO2 catalyst samples exhibited vibration absorptions centering at wave numbers of 3420 cm−1 and 1630 cm−1. These absorptions featured H2O. In comparison with the fresh 10 wt% MnO x –CeO2/t-ZrO2 catalyst, there were absorptions at 1115 cm−1 for the spent catalyst, showing the existence of SO4 2+. Meanwhile, the spent 10% MnO x –CeO2/t-ZrO2 catalyst had new absorptions at 1400 cm−1 to indicate the presence of NH4 + species, such as (NH4)2SO4, that were chemisorbed on the Brönsted acid sites. Reference Takagi, Kawai and Soma23 These results of FT-IR analysis are consistent with Yu et al. Reference Yu, Guo, Wang, Zhu, Liu, Su, Gao and Xu24 and demonstrated that the inhibitory effect of SO2 was surely due to the formation of ammonium sulfate which deposited on the active sites and blocked the active channels of catalyst. Compared to the fresh 10 wt% MnO x –CeO2/t-ZrO2 catalyst, the absorptions at 2925 cm−1 and 2850 cm−1 disappeared for the spent catalyst, which featured NO3 −.
FT-IR spectra of fresh and spent 10 wt% MnO x –CeO2/t-ZrO2 catalyst.
4. XPS characterization and SO2 poisoning mechanism
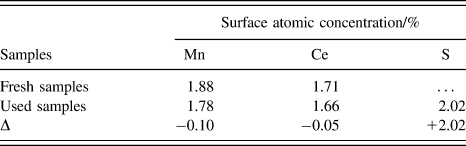
The surface atomic concentrations of Ce, Mn, S are summarized in Table II. It can be seen from Table II that sulfur was observed on the surface of spent 10 wt% MnO x –CeO2/t-ZrO2 catalyst samples, which is in good agreement with the results of FT-IR analysis (Fig. 9). In comparison with the fresh samples, the surface Mn and Ce concentrations of spent samples was lower.
Surface atomic concentrations of Ce, Mn, S of fresh and used 10 wt% MnO x –CeO2/t-ZrO2 catalyst.

The XPS spectra of fresh and spent 10 wt% MnO x –CeO2/t-ZrO2 catalyst shown in Fig. 10 can be analyzed to identify further the species causing SO2 poisoning. Compared to the spectra of fresh catalyst samples, the spectra intensity of Mn 2p and Ce 3d became lower after reactions in SO2 containing gas to indicate a decrease of the Mn and Ce surface atomic concentration. The binding energy of Mn 2p and Ce 3d became larger, indicating that MnSO4 existed on the surface. For spent catalyst samples, S 2p peaks were detected and they could be split into three peaks at 168.5, 169.3, and 169.9 eV, respectively. The peak at a bending energy of 168.5 eV corresponds to SO3 2− and the peaks at bending energy of 169.3 and 169.9 eV correspond to SO4 2−.
XPS spectra of fresh and spent 10% MnO x –CeO2/t-ZrO2 catalyst, (a) Mn 2p, (b) Ce 3d, (c) S 2p.

These results are consistent with the reported literature. Reference Wei, Li, Zhang, Yan, Lv, Chen and Gong25–Reference Li, Chen, Ke, Luo and Hao29 The inhibitory effect of SO2 was surely due to the formation of metal sulfate causing decrease of catalyst activity because the active component deteriorated. Furthermore, the deposition of NH4HSO4 or (NH4)2SO4 on the active sites decreased the catalytic activity by blocking the active channels of catalysts.
IV. CONCLUSIONS
-
(1) The NO conversion increases with the increased amounts of MnO x –CeO2. The NO conversion of 5 wt% MnO x –CeO2/t-ZrO2 catalyst was 68.1% at 100 °C while that of 30 wt% MnO x –CeO2/t-ZrO2 catalyst was 97.4%.
-
(2) The MnO x –CeO2/t-ZrO2 catalyst shows high catalytic activity for low-temperature SCR of NO with NH3. 100% of NO conversion was obtained at 130, 118, 107, and 104 °C for 5, 10, 20, and 30 wt% MnO x –CeO2/t-ZrO2, respectively.
-
(3) The BET surface areas of MnO x –CeO2/t-ZrO2 catalysts decreased marginally and average pore sizes increased after MnO x –CeO2 deposited on the pure tetragonal zirconia. The pore volume of all samples was in the mesopore size range (d 2–50 nm).
-
(4) Mn4+ and Ce4+ oxidation states are predominant on the surface of 10 wt% MnO x –CeO2/t-ZrO2 catalysts. The catalysts have excellent redox ability on the surface and Lewis acid sites are predominant.
-
(5) The catalytic activity decreased rapidly once SO2 is introduced into the flue gas. The deterioration of active component and deposition of NH4HSO4 or (NH4)2SO4 contribute to SO2 poisoning.
ACKNOWLEDGMENTS
This research was supported by the Jiangsu Provincial Environmental Protection Office Project (2013032) and a sponsored by the Priority Academic Program Development of Jiangsu Higher Education Institutions.