1. Introduction
Low-gradient sediment transport and routing systems are key concepts in understanding the distribution of depositional environments in low-accommodation basins such as epicontinental seas (e.g. Holbrook & Schumm, Reference Holbrook and Schumm1999; Fagherazzi et al. Reference Fagherazzi, Howard, Niedoroda and Wiberg2008; Midtkandal & Nystuen, Reference Midtkandal and Nystuen2009). In such widespread, shallow basins where long-lived, well-defined major sediment sinks or depocentres are absent, temporary intrashelf sub-basins are filled to depositional equilibrium before bypass and rerouting takes place. Low depositional gradients and the absence of a well-defined shelf break imply that subtle variations in relative sea level lead to significant facies belt shifts, especially in marginal marine environments (Lebold & Kammer, Reference Lebold and Kammer2006). A combination of global sea-level changes coupled with any tectonic uplift, drawdown or tilt, creates significant changes in relative sea level and hence depositional routing, accommodation and sediment accumulation (Shephard et al. Reference Shephard, Flament, Williams, Seton, Gurnis and Müller2014; Sømme et al. Reference Sømme, Doré, Lundin and Tørudbakken2018). Intraplate tectonic stress can create local troughs and platforms, altering basin bathymetry and modifying depositional loci (Gac et al. Reference Gac, Klitzke, Minakov, Faleide and Scheck-Wenderoth2016).
With sufficient accommodation, sediment accumulation can result in the development of an intrashelf platform, a clinoform-bearing subaqueous, low-relief, low-gradient area basinward from the shoreline that progrades onto the continental shelf landward of the continental shelf break. Intrashelf clinothems can consist of any combination of deposits from shoreline deltas, subaqueous deltas and shelf deposits that stem from river discharge events, pelagic and hemipelagic mud, and gravity-triggered flow deposits along the front and toe of the clinothems (Jones et al. Reference Jones, Hodgson and Flint2015; Cosgrove et al. Reference Cosgrove, Hodgson, Poyatos-Moré, Mountney and McCaffrey2018; Hodgson et al. Reference Hodgson, Browning, Miller, Hesselbo, Poyatos-Moré, Mountain and Proust2018). Relative scale relationships between connected sets of shoreline deltas and intrashelf platforms are proposed in Helland-Hansen & Hampson (Reference Helland-Hansen and Hampson2009) and Patruno et al. (Reference Patruno, Hampson and Jackson2015) (the term ‘shelf prism’ is used by these authors), with typical scales of shoreline delta clinoforms up to a few tens of metres high. Delta clinoforms that reach thicknesses in excess of 100 m are documented in the Miocene Billund delta in Denmark (Rasmussen et al. Reference Rasmussen, Dybkjær and Piasecki2010) and in the Eocene Sobrarbe delta in Spain (Dreyer et al. Reference Dreyer, Corregidor, Arbues and Puigdefabregas1999), whereas intrashelf clinothems can develop in units thinner than 100 m (Patruno et al. Reference Patruno, Hampson and Jackson2015). Intrashelf clinothems therefore overlap with delta clinothems in scale. Consequently, intrashelf clinothems can present a challenge when determining the origins of clinothem sets with vertical dimensions within the overlap range. A hierarchy of clinoform scales that range from shoreline clinoforms (< 40 m high) to shelf-slope-basin clinoforms (hundreds of metres to kilometre-scale) has been proposed and refined in several published works, such as Helland-Hansen & Hampson (Reference Helland-Hansen and Hampson2009) and Patruno et al. (Reference Patruno, Hampson and Jackson2015). Mountain & Proust (Reference Mountain and Proust2010) and Hodgson et al. (Reference Hodgson, Browning, Miller, Hesselbo, Poyatos-Moré, Mountain and Proust2018) highlighted the necessity of applying the term ‘intrashelf’ clinoforms and corresponding clinothems for progradational sedimentary volumes that are clearly located on the continental shelf landwards of the shelf edge.
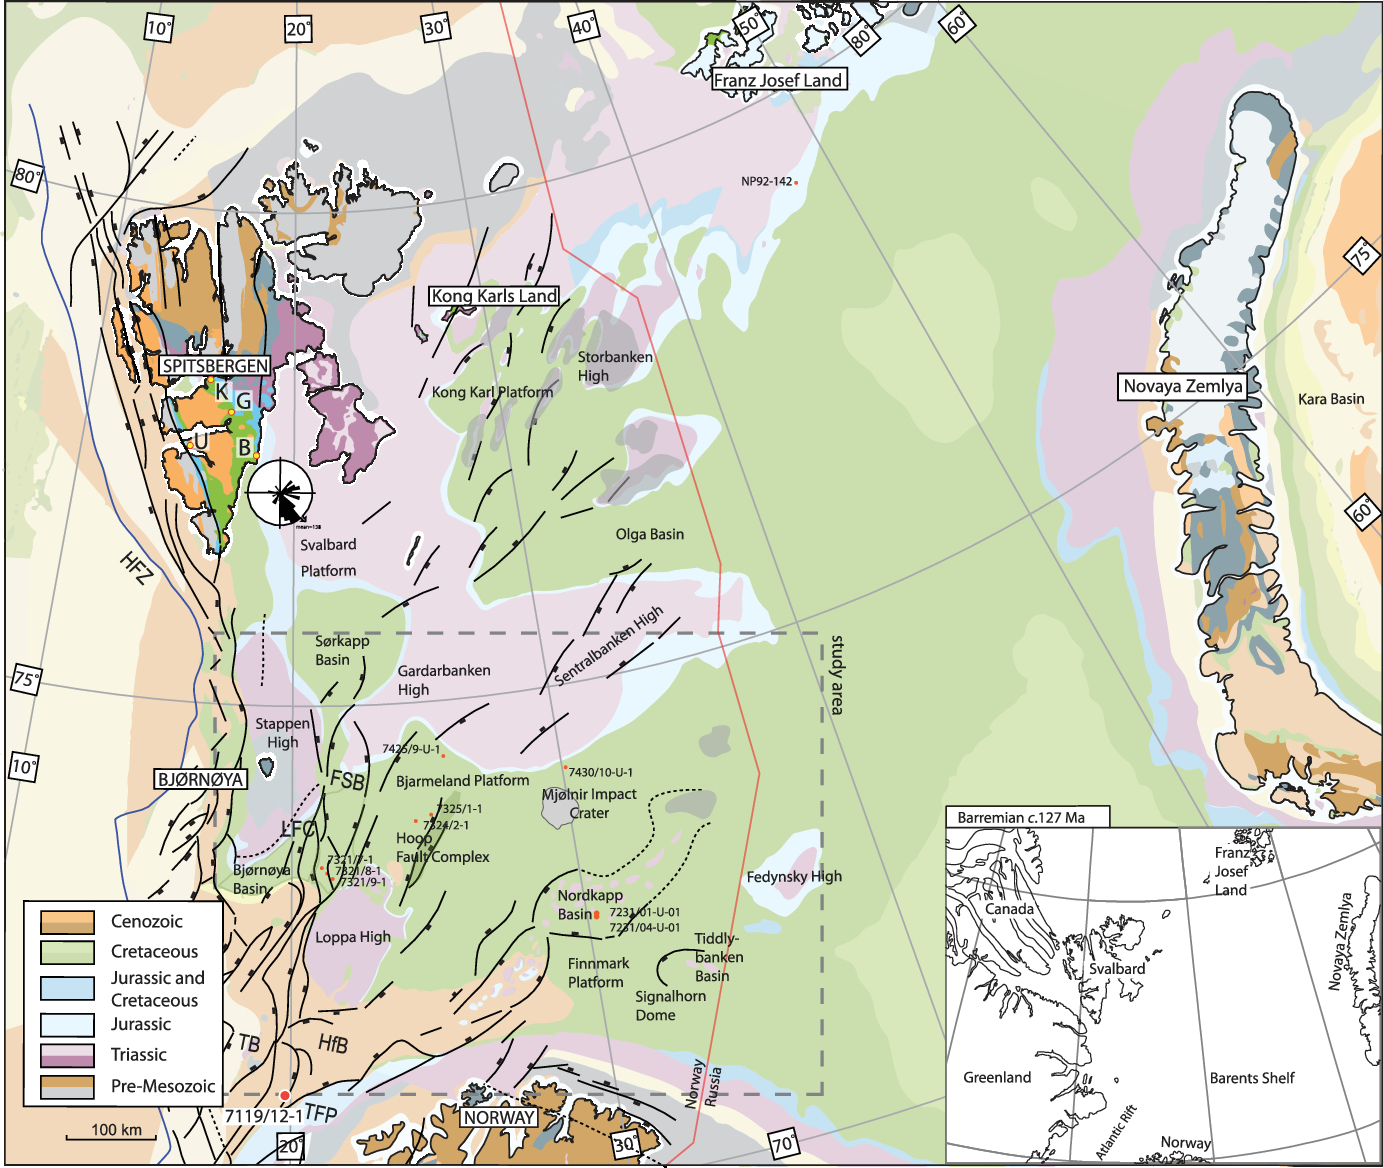
The Barents Sea (Fig. 1) has existed as an epicontinental basin, inundating the NW portion of the Eurasian lithospheric plate, since the initial development of the Boreal Basin during the early Pangaea break-up (Shipilov, Reference Shipilov2008; Torsvik & Cocks, Reference Torsvik, Cocks, Cocks and Torsvik2016; Sømme et al. Reference Sømme, Doré, Lundin and Tørudbakken2018). This epicontinental sea was a part of the larger Boreal Sea during Cretaceous time, which included the Canadian Sverdrup Basin, parts of Alaska’s North Slope and NE Greenland (Harland et al. Reference Harland, Gaskell, Heaffard, Lind, Perkins, Heafford, Lind, Perkins and Spencer1984). Being one of the world’s largest epicontinental seas during geological times, with intrabasinal distances of several hundreds of kilometres from source to sink at several stages during its history (Smelror et al. Reference Smelror, Petrov, Larssen and Werner2009), makes the basin special as regards character of sediment routing of terrigenous debris and the relative importance of various factors controlling sediment influx, dispersal and deposition. The widespread epicontinental Boreal Basin hosted troughs and highs of moderate relief, and gave rise to stratigraphic units that can be mapped across widespread areas (e.g. Mørk et al. Reference Mørk, Dallmann, Dypvik, Johannesen, Larssen, Nagy, Nøttvedt, Olaussen, Pchelina, Worsley and Dallmann1999).
Barents Sea map, with Svalbard, Franz Josef Land, Novaya Zemlya and Norway. The geological subcrop map is adapted from Harrison et al. (Reference Harrison, St-Onge, Petrov, Strelnikov, Lopatin, Wilson, Tella, Paul, Lynds, Shokalsky, Hults, Bergman, Jepsen and Solli2011); the structural lineaments are from Faleide et al. (Reference Faleide, Bjørlykke, Gabrielsen and Bjørlykke2015); the palaeotectonic (Barremian) insert map is adapted from Shephard et al. (Reference Shephard, Müller and Seton2013); the palaeocurrent rose diagram superimposed on Spitsbergen is from Gjelberg & Steel (Reference Gjelberg and Steel1995), Midtkandal et al. (Reference Midtkandal, Nystuen and Nagy2007), and Midtkandal & Nystuen (Reference Midtkandal and Nystuen2009). K – Konusen; U – Ullaberget; G – Glitrefjellet; B – Båtsmannen; HfB – Hammerfest Basin; TB – Tromsø Basin; FSB – Fingerdjupet Sub-basin; LFC – Leirdjupet Fault Complex; HFZ – Hornsund Fault Zone; TFP – Troms-Finnmark Platform.
This study investigates depositional patterns and architecture in a very large low-gradient, low-accommodation epicontinental basin where sediment routing and deposition has been affected by regional long-wavelength tectonic influence. The object is to decipher the Early Cretaceous regional infill history of the Svalbard and Barents Sea region, including control factors for sediment origin, relative and absolute timing, sediment influx, routing systems, long-distance correlation, transport and deposition.
2. Cretaceous geology of Svalbard and the Barents Sea
Atlantic opening fragmented the Boreal Basin after the Cretaceous Period (e.g. Faleide et al. Reference Faleide, Vågnes and Gudlaugsson1993, Reference Faleide, Tsikalas, Breivik, Mjelde, Ritzmann, Engen, Wilson and Eldholm2008). The largest extant portion is the present-day Barents Sea, of which the Svalbard archipelago is an uplifted outcrop window in the NW corner. Cretaceous strata on Svalbard crop out as cliffs in southern Spitsbergen and are mapped as subcrops in the Barents Sea 300 km SE of Svalbard (Fig. 1) (Sigmond, Reference Sigmond2002; Harrison et al. Reference Harrison, St-Onge, Petrov, Strelnikov, Lopatin, Wilson, Tella, Paul, Lynds, Shokalsky, Hults, Bergman, Jepsen and Solli2011). Late Cenozoic uplift and erosion has removed the intervening Lower Cretaceous strata (Vorren et al. Reference Vorren, Hald and Lebesbye1988; Faleide et al. Reference Faleide, Solheim, Fiedler, Hjelstuen, Andersen and Vanneste1996; Dimakis et al. Reference Dimakis, Braathen, Faleide, Elverhøi and Gudlaugsson1998; Henriksen et al. Reference Henriksen, Bjørnseth, Hals, Heide, Kiryukhina, Kløvjan, Larssen, Ryseth, Rønning, Sollid, Stoupakova, Spencer, Embry, Gautier, Stoupakova and Sørensen2011a).
2.a. Lower Cretaceous stratigraphy on Spitsbergen, Svalbard
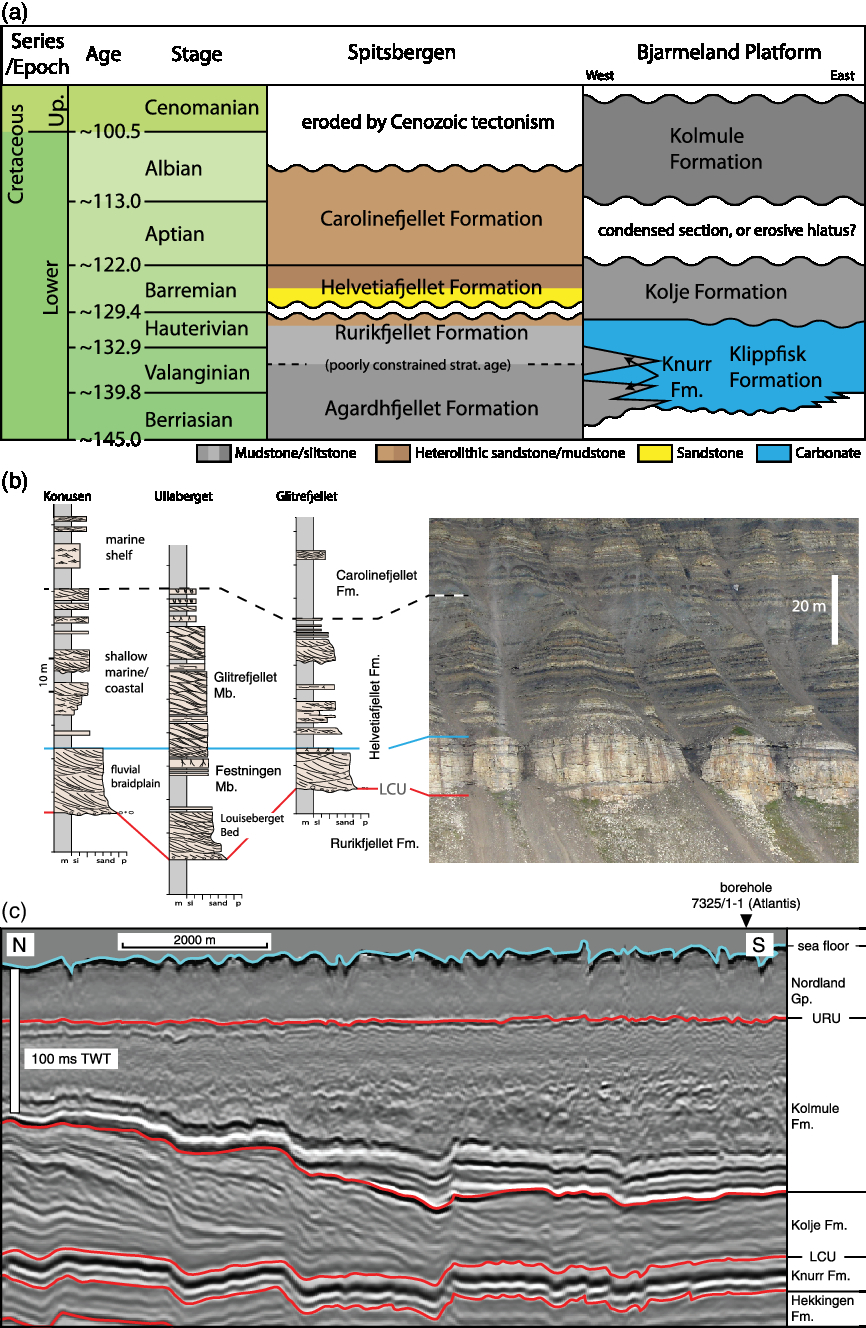
Svalbard’s Lower Cretaceous strata are mapped, from oldest to youngest, as the upper Agardhfjellet Formation, the Rurikfjellet Formation, the Helvetiafjellet Formation and the Carolinefjellet Formation (Mørk et al. Reference Mørk, Dallmann, Dypvik, Johannesen, Larssen, Nagy, Nøttvedt, Olaussen, Pchelina, Worsley and Dallmann1999) (Fig. 2a, b).
(a) Bjarmeland Platform stratigraphy, compiled from Nøttvedt et al. (Reference Nøttvedt, Cecchi, Gjelberg, Kristensen, Lønøy, Vorren, Bergsager, Dahl-Stamnes, Holter, Johansen, Lie and Lund1993), Smelror et al. (Reference Smelror, Mørk, Monteil, Rutledge and Leereveld1998), Bugge et al. (Reference Bugge, Elvebakk, Fanavoll, Mangerud, Smelror, Weiss, Gjelberg, Kristensen and Nilsen2002), Worsley (Reference Worsley2008) and Henriksen et al. (Reference Henriksen, Ryseth, Larssen, Heide, Ronning, Sollid, Stoupakova, Spencer, Embry, Gautier, Stoupakova and Sørensen2011b). Chronostratigraphic ages are from Cohen et al. (Reference Cohen, Finney, Gibbard and Fan2013; updated) and the Barremian–Aptian boundary from Midtkandal et al. (Reference Midtkandal, Svensen, Planke, Corfu, Polteau, Torsvik, Faleide, Grundvåg, Selnes, Kürschner and Olaussen2016). (b) Spitsbergen measured sections and outcrop examples, with lithostratigraphic subdivision. The sections are from western and central Spitsbergen, adapted from Midtkandal & Nystuen (Reference Midtkandal and Nystuen2009). The photograph is from Båtsmannen, on Spitsbergen’s east coast. See Fig. 1 for location. (c) P-Cable high-resolution seismic example with lithostratigraphic subdivision from the Bjarmeland Platform, adapted from Corseri et al. (Reference Corseri, Faleide, Faleide, Midtkandal, Serck, Trulsvik and Planke2018) and Faleide et al. (Reference Faleide, Midtkandal, Planke, Corseri, Faleide, Serck and Nystuen2019). Seismic data courtesy of TGS and VBPR.
The Valanginian–Hauterivian (Dypvik et al. Reference Dypvik, Håkansson and Heinberg2002; Vickers et al. Reference Vickers, Price, Jerrett and Watkinson2016) Rurikfjellet Formation formed as a regressive open-marine, storm-influenced shelf (Dypvik et al. Reference Dypvik, Eikeland, Backer-Owe, Andresen, Johansen, Elverhøi, Nagy, Haremo and Bjærke1991a,b; Mørk et al. Reference Mørk, Dallmann, Dypvik, Johannesen, Larssen, Nagy, Nøttvedt, Olaussen, Pchelina, Worsley and Dallmann1999; Grundvåg et al. Reference Grundvåg, Marin, Kairanov, Śliwińska, Nøhr-Hansen, Jelby, Escalona and Olaussen2017).
The Barremian Helvetiafjellet Formation overlies the Lower Cretaceous Rurikfjellet Formation unconformably with a regionally significant subaerial erosive unconformity as the lower boundary. The unconformity separates open-marine shelf strata below from fluvial sandstone beds above (Parker, Reference Parker1967; Nemec, Reference Nemec1992; Midtkandal & Nystuen, Reference Midtkandal and Nystuen2009). Corfu et al. (Reference Corfu, Polteau, Planke, Faleide, Svensen, Zayoncheck and Stolbov2013), Midtkandal et al. (Reference Midtkandal, Svensen, Planke, Corfu, Polteau, Torsvik, Faleide, Grundvåg, Selnes, Kürschner and Olaussen2016) and Vickers et al. (Reference Vickers, Price, Jerrett and Watkinson2016) suggested a Barremian age for the basal unconformity, using biostratigraphic and geochronologic data. A study from Nathorst Land in southwestern Spitsbergen shows a 70-m-deep valley incision at the unconformity (Midtkandal & Nystuen, Reference Midtkandal and Nystuen2009). Elsewhere on Spitsbergen, 5–15 m of topographic relief can be inferred for the unconformity from stratigraphic thickness variations (Midtkandal et al. Reference Midtkandal, Nystuen and Nagy2007; Grundvåg & Olaussen, Reference Grundvåg and Olaussen2017). The absolute magnitude of erosion is undetermined, making the exact age gap between the Rurikfjellet Formation and the Helvetiafjellet Formation unknown. A recent study by Grundvåg et al. (Reference Grundvåg, Jelby, Śliwińska, Nøhr-Hansen, Aadland, Sandvik, Tennvassås, Engen and Olaussen2019) indicates a > 2 Ma age gap based on integration of biostratigraphic and chemostratigraphic data. The unconformity separating the Helvetiafjellet Formation from the underlying Rurikfjellet Formation is interpreted as formed by forced regression, and therefore unrelated to the progradational depositional system of the Rurikfjellet Formation (Midtkandal & Nystuen, Reference Midtkandal and Nystuen2009).
The sandstone-rich Helvetiafjellet Formation is subdivided into two members (Fig. 2b): the lower Festningen Member and the upper Glitrefjellet Member (Parker, Reference Parker1967; Midtkandal et al. Reference Midtkandal, Nystuen, Nagy and Mørk2008). The Festningen Member is an up to 21-m-thick trough cross-stratified, gravelly and coarse-grained sandstone unit, representing a fluvial low-sinuosity, high-mobility river deposit, mappable across southern Spitsbergen (e.g. Nemec, Reference Nemec1992; Gjelberg & Steel, Reference Gjelberg and Steel1995; Midtkandal et al. Reference Midtkandal, Nystuen and Nagy2007). Palaeocurrent indicators suggest a source area NW of present-day Spitsbergen, and a basin deepening towards the SE (Fig. 1; see also palaeocurrent data in Gjelberg & Steel, Reference Gjelberg and Steel1995). The Festningen Member is correlated to the Barremian distal equivalent in the Barents Sea as one and the same low-gradient fluvial to marine sediment transport and depositional system (Midtkandal & Nystuen, Reference Midtkandal and Nystuen2009; Grundvåg et al. Reference Grundvåg, Marin, Kairanov, Śliwińska, Nøhr-Hansen, Jelby, Escalona and Olaussen2017).
The upper part of the Helvetiafjellet Formation, the heterolithic Glitrefjellet Member (Parker, Reference Parker1967), developed in a tidal coastal environment (Midtkandal et al. Reference Midtkandal, Nystuen and Nagy2007). A widespread, 5–15-m thick mudstone, marking a flooding event and return to open shelf conditions, caps the Helvetiafjellet Formation (Mørk et al. Reference Mørk, Dallmann, Dypvik, Johannesen, Larssen, Nagy, Nøttvedt, Olaussen, Pchelina, Worsley and Dallmann1999).
The Carolinefjellet Formation is the uppermost Cretaceous unit preserved on Svalbard. Up to 1000 m thick, it developed as an open-marine, storm-dominated depositional shelf unit, where sub-members are assigned according to local variations in lithology (Nøttvedt & Kreisa, Reference Nøttvedt and Kreisa1987; Hurum et al. Reference Hurum, Roberts, Dyke, Grundvåg, Nakrem, Midtkandal, Sliwinska and Olaussen2016). Outer shelf environments dominated during deposition of the mudstone-rich units, punctuated by intervals of near non-deposition. Sandstone-rich intervals suggest inner-shelf conditions with a high frequency of storms capable of redistributing sand across wide areas (Nagy, Reference Nagy1970; Nøttvedt & Kreisa, Reference Nøttvedt and Kreisa1987; Mutrux et al. Reference Mutrux, Maher, Shuster and Hays2008; Hurum et al. Reference Hurum, Roberts, Dyke, Grundvåg, Nakrem, Midtkandal, Sliwinska and Olaussen2016).
2.b. Lower Cretaceous stratigraphy in Kong Karls Land and Franz Josef Land
Kong Karls Land and Franz Josef Land represent outcrop outliers as regards Lower Cretaceous stratigraphy in the Barents Sea, but are included here in order to discuss basin-wide development and stratal correlations.
2.b.1. Kong Karls Land (Svalbard)
The Lower Cretaceous stratigraphy on Kong Karls Land, NE of Spitsbergen (Fig. 1) is subdivided into two members. (1) The Klippfisk Formation Upper Berriasian–Hauterivian Tordenskjoldberget Member (Smith et al. Reference Smith, Harland, Hughes and Pickton1976; Smelror et al. Reference Smelror, Mørk, Monteil, Rutledge and Leereveld1998, 2019; Mørk et al. Reference Mørk, Dallmann, Dypvik, Johannesen, Larssen, Nagy, Nøttvedt, Olaussen, Pchelina, Worsley and Dallmann1999; Olaussen et al. Reference Olaussen, Larssen, Helland-Hansen, Johannessen, Nøttvedt, Riis, Rismyhr, Smelror and Worsley2019) is an open-marine platform limestone. (2) The carbonate-dominated unit is overlain by the Barremian Helvetiafjellet Formation. This is composed of fluvial sandstone beds interbedded with basaltic lava flows known as the Kong Karls Land Flows (Grogan et al. Reference Grogan, Nyberg, Fotland, Myklebust, Dahlgren and Riis2000; Mørk et al. Reference Mørk, Dallmann, Dypvik, Johannesen, Larssen, Nagy, Nøttvedt, Olaussen, Pchelina, Worsley and Dallmann1999) in the Hårfagrehaugen Member (Festningen Member equivalent), similar to the Franz Josef Land Tikhaya Bay Formation. Younger Cretaceous rocks that would correspond to the Carolinefjellet Formation on Spitsbergen are eroded in Kong Karls Land.
2.b.2. Franz Josef Land (Russian Barents Sea)
Sandstone beds with plant fossils, coal and mudstone of Hauterivian–Albian age are reported to be interbedded with c. 500-m-thick basalt flows in Franz Josef Land (Dibner et al. Reference Dibner, Bro, Preobrazhenskaya, Pchelina, Shkola, Solheim, Musatov and Heinz1992) (Fig. 1). These continental units, the Tikhaya Bay and Salisbury formations, correspond respectively to the Helvetiafjellet and Carolinefjellet formations on Svalbard (Dibner et al. Reference Dibner, Bro, Preobrazhenskaya, Pchelina, Shkola, Solheim, Musatov and Heinz1992; Embry, Reference Embry1992; Smelror et al. Reference Smelror, Larssen, Olaussen, Rømuld and Williams2019). Both basaltic lava flows and interbedded sandstones are referred to collectively as the Tikhaya Bay Formation in Dibner (Reference Dibner1998). They overlie unnamed marine siliciclastic strata with belemnite and plant fragment fossil content. Solheim et al. (Reference Solheim, Gustavsen, Musatov, Dypvik, Solheim, Musatov and Heinz1998) reported chiefly Aptian–Albian ages and open-marine deposition from analyses of core NP92-142 south of Franz Josef Land (Fig. 1). The core did not penetrate Barremian strata, and nearby cores in the same study were unable to resolve any Barremian age stratigraphy with confidence. However, shallow seismic data reported by Solheim et al. (Reference Solheim, Gustavsen, Musatov, Dypvik, Solheim, Musatov and Heinz1998) show well-defined layering above an inferred unconformity that was correlated to the base of the Helvetiafjellet Formation on Svalbard.
2.c. Cretaceous depositional model on Svalbard
The depositional system of the Lower Cretaceous strata on Svalbard has been the subject of debate. The main point of discussion concerns how the Helvetiafjellet Formation developed and its relation to over- and underlying units. Gjelberg & Steel (Reference Gjelberg and Steel1995, Reference Gjelberg and Steel2012) suggested this unit represents a transgression expressed as progressively waning pulses of sedimentation in a nearshore/lower coastal plain environment, with sandstone beds belonging to the Festningen Member pinching out into marine mudstone within the Spitsbergen outcrops. Their depositional model indicates that the line of maximum regression was located just SE of the present-day Spitsbergen coast, with open ocean basin conditions further SE. Midtkandal & Nystuen (Reference Midtkandal and Nystuen2009) noted that the Festningen Member is persistent in its fluvial style from the proximal to distal outcrop areas on Svalbard, with one shared subaerial unconformity at its base within the entire outcrop area. There is no evidence of the Festningen Member transitioning into a deltaic succession on Spitsbergen. This model suggested that Spitsbergen and other islands on Svalbard represent an outcrop window into a large regional fluvial/deltaic system that reached into the Boreal Basin, where forced regression displaced the palaeo-shoreline hundreds of kilometres to the SE before the onset of transgression. Grundvåg & Olaussen (Reference Grundvåg and Olaussen2017) supported the Midtkandal & Nystuen (Reference Midtkandal and Nystuen2009) model with field data from Kikutodden, SE Spitsbergen. The seismic data from the Barents Sea that image strata contemporaneous to the Helvetiafjellet Formation provide further insights into the distal equivalent of the onshore Svalbard strata, here used to discuss the depositional models.
2.d. Lower Cretaceous Barents Sea
The Lower Cretaceous strata in the Barents Sea are broadly characterized as two separate prograding systems of sediment lobes from NW to SE and from NE to SW (M. Dimitriou, unpub. MSc thesis, University of Oslo, 2014; Midtkandal et al. Reference Midtkandal, Faleide, Dahlberg, Dimitriou and Nystuen2014; Grundvåg et al. 2017; Marín et al. Reference Marín, Escalona, Sliwihska, Nøhr-Hansen and Mordasova2017).
2.d.1. Lithostratigraphy
The Barents Sea Lower Cretaceous stratigraphy is calibrated by (1) shallow boreholes drilled by the Norwegian Continental Shelf Institute (IKU; now SINTEF Energy Research) in the late 1980s (Fig. 3); (2) vibracore material reported in Antonsen et al. (Reference Antonsen, Elverhøi, Dypvik and Solheim1991); (3) gravity cores collected by VBPR in 2014 (Polteau et al. Reference Polteau, Mazzini and Planke2015b); and (4) seismic data from multiple surveys over several years. A few deeper boreholes penetrate the Lower Cretaceous strata in the area, notably 7321/7-1 in the Fingerdjupet Sub-basin and the boreholes 7324/2-1 (Apollo) and 7325/1-1 (Atlantis) (Fig. 2c) (boreholes 3 and 4 in Table 1) on the Bjarmeland Platform (Fig. 3). The borehole data are used to strengthen the link between stratigraphy and seismic imaging on the Bjarmeland Platform.
Map of the study area, with representative seismic profiles (A–K), wells and lobe front terminations. The geologic subcrop map is adapted from Harrison et al. (Reference Harrison, St-Onge, Petrov, Strelnikov, Lopatin, Wilson, Tella, Paul, Lynds, Shokalsky, Hults, Bergman, Jepsen and Solli2011). The purple line segments illustrate where the examples in Figure 4 are located. Note that the example for lobe NW2 is taken from a profile west of line H. See text for details.

Summarized age of sedimentary lobes mapped in this study, with ages and boreholes from which data have been applied to constrain their timing. Borehole numbers refer to boreholes in Figure 3.

The Berriasian–Hauterivian Klippfisk Formation (Fig. 2c) is a carbonate-dominated unit that represents the oldest Cretaceous unit in the area (Smelror et al. Reference Smelror, Mørk, Monteil, Rutledge and Leereveld1998). Its lateral equivalent is the Knurr Formation (Worsley et al. Reference Worsley, Johansen and Kristensen1988), a mud- and siltstone-dominated unit to the west of the Bjarmeland Platform. Antonsen et al. (Reference Antonsen, Elverhøi, Dypvik and Solheim1991) suggested that the Knurr Formation is the lateral equivalent to the Rurikfjellet Formation on Spitsbergen. Smelror et al. (Reference Smelror, Mørk, Monteil, Rutledge and Leereveld1998) were not specific with regards to the conditions under which the carbonate strata in the Klippfisk Formation developed, but stated: ‘The formation probably represents transgressive, shallow marine deposits, which covered platform areas and local structural highs of the Barents Shelf’ (Smelror et al. Reference Smelror, Mørk, Monteil, Rutledge and Leereveld1998, p. 183). Århus (Reference Århus1991) and Smelror et al. (Reference Smelror, Mørk, Monteil, Rutledge and Leereveld1998) listed Inoceramus shells as the most abundant fossil constituent, along with bryozoans, echinoderms and foraminifera. Thalassinoides trace fossils were also reported. The Klippfisk Formation (Fig. 2c) fossil assemblage, coupled with the reported trace fossils, may have formed in shallow, oxidixed shelf conditions, as indicated by Henderson (Reference Henderson2004), Komatsu et al. (Reference Komatsu, Ono, Naruse and Kumagae2008) and MacEachern & Bann (Reference MacEachern, Bann and Hampson2008), an interpretation consistent with the general setting of the Barents Shelf during the Early Cretaceous Period. Bugge et al. (Reference Bugge, Elvebakk, Fanavoll, Mangerud, Smelror, Weiss, Gjelberg, Kristensen and Nilsen2002) suggested the most favourable conditions for carbonate production were on structural highs with limited siliciclastic input.
The Barremian–Aptian (Bugge et al. Reference Bugge, Elvebakk, Fanavoll, Mangerud, Smelror, Weiss, Gjelberg, Kristensen and Nilsen2002) Kolje Formation (Worsley et al. Reference Worsley, Johansen and Kristensen1988) overlies the Klippfisk Formation with a sharp and, in places, erosive boundary (Smelror et al. Reference Smelror, Mørk, Monteil, Rutledge and Leereveld1998; Bugge et al. Reference Bugge, Elvebakk, Fanavoll, Mangerud, Smelror, Weiss, Gjelberg, Kristensen and Nilsen2002) (Fig. 2c). The unit is dominantly open shelf hemipelagic mudstone with thin carbonate beds in its lower and upper parts (Smelror et al. Reference Smelror, Mørk, Mørk, Weiss and Løseth2001). A study from the Kolje Formation on Bjarmeland Platform area describes a seismic anomaly at the front of a SW-directed prograding sedimentary lobe, interpreted as an Aptian submarine channel fill (Corseri et al. Reference Corseri, Faleide, Faleide, Midtkandal, Serck, Trulsvik and Planke2018).
The Albian–Cenomanian Kolmule Formation (Fig. 2c) (Worsley et al. Reference Worsley, Johansen and Kristensen1988) is sandier than the underlying Kolje Formation, and represents inner shelf and lagoonal conditions in the Nordkapp Basin (Bugge et al. Reference Bugge, Elvebakk, Fanavoll, Mangerud, Smelror, Weiss, Gjelberg, Kristensen and Nilsen2002). In the Olga Basin (Fig. 1), Antonsen et al. (Reference Antonsen, Elverhøi, Dypvik and Solheim1991) suggested that the lower part of the unit correlates with the Carolinefjellet Formation in Spitsbergen, while the upper part lacks a Spitsbergen equivalent. Details of the Kolmule Formation from the Bjarmeland Platform are scarce. Cores 7231/04-U-01 and 7430/10-U-1 (Fig. 3) from the eastern study area (Smelror et al. Reference Smelror, Mørk, Monteil, Rutledge and Leereveld1998) revealed that there the formation is dominantly composed of mudstone and siltstone.
High-resolution age data in the Barents Sea strata is scarce (Fig. 2a), which complicates correlation between Spitsbergen and its offshore equivalents. The formal lithostratigraphic names of the Knurr, Kolje and Kolmule formations are defined from borehole 7119/12-1 (Fig. 1), which is up to 540 km from the study area, making unit labelling difficult.
3. Data, methods and seismically mappable basin elements
3.a. Barents Sea seismic data analysis
The mapping in this study is based on the most up-to-date and consistent grid of 2D seismic data (NBR 2006–2014, TGS and Spectrum; BSSE14, NPD). These surveys form a grid with four sets of parallel seismic lines with 2–5 km spacing that collectively allow a pseudo-3D analysis of the entire Norwegian Barents Sea open for exploration (Fig. 3). These datasets were not used in the recent published work on the Lower Cretaceous clinoforms by Marín et al. (Reference Marín, Escalona, Sliwihska, Nøhr-Hansen and Mordasova2017) and Grundvåg et al. (Reference Grundvåg, Marin, Kairanov, Śliwińska, Nøhr-Hansen, Jelby, Escalona and Olaussen2017), and the differences between their studies and this study are summarized in Figure 4. The seismic data were tied to selected exploration wells that contain relevant information about the Lower Cretaceous succession. Furthermore, previously published information from shallow coreholes penetrating subcropping Cretaceous strata was used (Bugge et al. Reference Bugge, Elvebakk, Fanavoll, Mangerud, Smelror, Weiss, Gjelberg, Kristensen and Nilsen2002).
Detailed map of key differences in lobe mapping between this study and studies by Marín et al. (Reference Marín, Escalona, Sliwihska, Nøhr-Hansen and Mordasova2017) and Grundvåg et al. (Reference Grundvåg, Marin, Kairanov, Śliwińska, Nøhr-Hansen, Jelby, Escalona and Olaussen2017). The geological subcrop map is adapted from Harrison et al. (Reference Harrison, St-Onge, Petrov, Strelnikov, Lopatin, Wilson, Tella, Paul, Lynds, Shokalsky, Hults, Bergman, Jepsen and Solli2011).

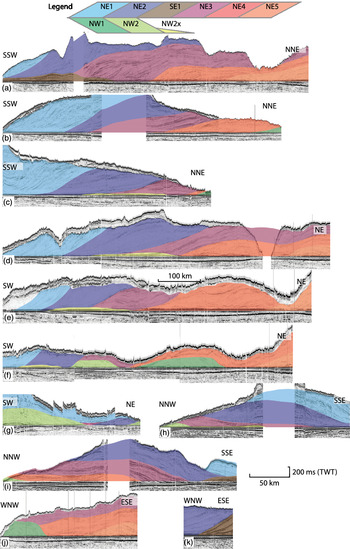
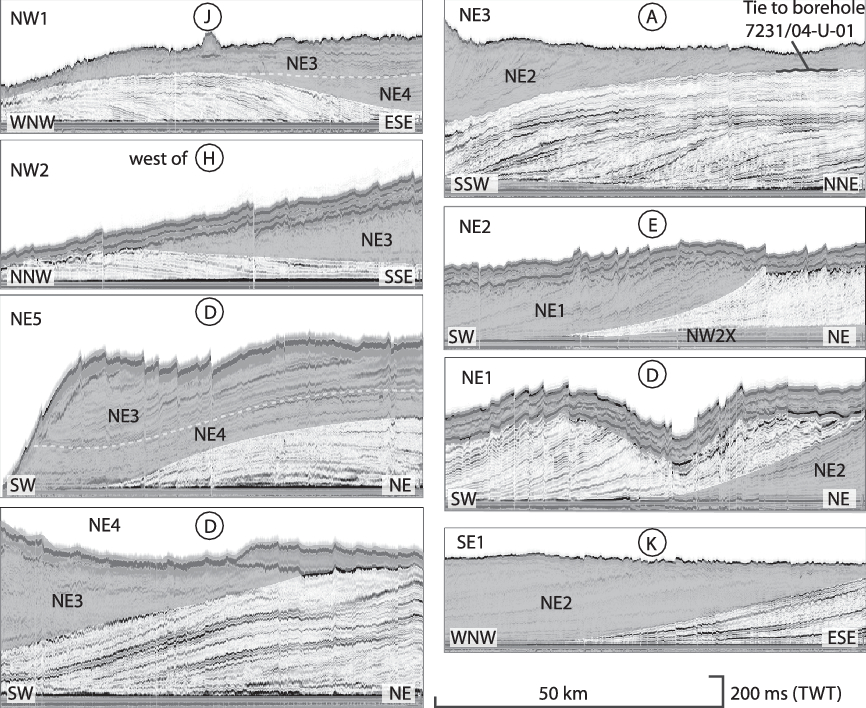
The dense grid of 2D seismic profiles in the study area facilitates systematic tracing and cross-matching of sediment volumes and their respective downlap termination points. Relative ages can also be determined between the differently oriented seismic profiles when flattened along, or near, the Lower Cretaceous Unconformity (LCU) to eliminate post-depositional faulting and folding. A number of uniquely identifiable sediment volumes, characterized by seismic facies and internal reflection geometries, were mapped across its area of distribution (Fig. 5). This method enabled a three-dimensional reconstruction of the sedimentary volumes in question, and allows inferences on its depositional dynamics. The downlap termination point was identified for each lobe along several seismic profiles in order to map the most distal reach of each lobe (toeset pinch-out).
Representative examples of seismic facies within the sedimentary lobes. Circled letters correspond to seismic lines in Figure 3. The shaded areas indicate where neighbouring lobe strata appear on the same profile section. The strata are flattened on their downlap horizon, the LCU, to eliminate post-depositional faulting and improve the visibility of the internal clinoforms. The well-tie indicated on lobe NE3 is discussed in the text with reference to Bugge et al. (Reference Bugge, Elvebakk, Fanavoll, Mangerud, Smelror, Weiss, Gjelberg, Kristensen and Nilsen2002). Seismic data courtesy of TGS, Spectrum and NPD.
Several generations of post-depositional faulting has fragmented the strata (Serck et al. Reference Serck, Faleide, Braathen, Kjølhamar and Escalona2017; Faleide et al. Reference Faleide, Midtkandal, Planke, Corseri, Faleide, Serck and Nystuen2019). Flattening along clinoform downlap surfaces allows restoration and validates stratigraphic mapping. The basin floor is assumed to be a very low-angle, smooth surface (Midtkandal & Nystuen, Reference Midtkandal and Nystuen2009; Smelror et al. Reference Smelror, Petrov, Larssen and Werner2009), and thereby closely approximates a palaeo-horizontal datum. Flattening along a presumed horizontal surface above the clinoform lobes is ideal (Klausen & Helland-Hansen, Reference Klausen and Helland-Hansen2018), but there are no such mappable horizons in the study area due to Cenozoic uplift and erosion. Clinoform terminology is applied in accordance with terms in Patruno et al. (Reference Patruno, Hampson and Jackson2015) and Hodgson et al. (Reference Hodgson, Browning, Miller, Hesselbo, Poyatos-Moré, Mountain and Proust2018).
Thickness estimations of the mapped sediment lobes are dependent on the level of accuracy in velocity models for the strata in question. Furthermore, the Upper Regional Unconformity (URU), formed by Pleistocene glacial erosion on the Norwegian Continental Shelf (e.g. Svendsen et al. Reference Svendsen, Gataullin, Mangerud, Polyak, Ehlers, Gibbard and Hughes2004), truncates several of the topset strata of the lobes, and a minimum thickness value holds little useful information. In the absence of borehole data on lithology and thickness of the lobe deposits themselves, the recently drilled Atlantis (7325/1-1) and Apollo (7324/2-1) wells from the Bjarmeland Platform (Fig. 1) present the best proxy available on seismic velocity values of the lobe units (Faleide et al. Reference Faleide, Midtkandal, Planke, Corseri, Faleide, Serck and Nystuen2019).
3.b. Seismic mapping of Cretaceous depositional lobes in the Barents Sea
A series of depositional lobes have been mapped on the Bjarmeland Platform by M. Dimitriou (unpub. MSc thesis, University of Oslo, 2014) and Marín et al. (Reference Marín, Escalona, Sliwihska, Nøhr-Hansen and Mordasova2017). Marín et al. (Reference Marín, Escalona, Sliwihska, Nøhr-Hansen and Mordasova2017) mapped seven discrete third-order depositional sequences with their distribution and internal characteristics using seismic analysis. The numbering scheme applied by Marín et al. (Reference Marín, Escalona, Sliwihska, Nøhr-Hansen and Mordasova2017) refers to the relative age of the sequences and assigns the same number to sedimentary rocks sourced from different directions when they are considered the same or similar age. Their analysed strata overlap at least partly with the sediments studied here, and among their main findings is evidence of two sediment source areas to the NW and NE, discussed further in this study (Fig. 4). We find it difficult to apply the sequences established by Marín et al. (Reference Marín, Escalona, Sliwihska, Nøhr-Hansen and Mordasova2017), as single sequences in their study originate from more than one sediment source area and have different ages, thus representing different sedimentary systems. Improved data coverage calibrated with higher-resolution (P-Cable, Fig. 2c) data included here allow a greater mapping detail. The organization of observations in this study is different from that of Marín et al. (Reference Marín, Escalona, Sliwihska, Nøhr-Hansen and Mordasova2017) for this reason.
3.c. Seismic mapping of Cretaceous highs and lows in the Barents Sea
A number of highs and troughs have been inferred to exist in the Cretaceous Boreal Basin from seismic data analysis, with the exception of the areas without Lower Cretaceous strata.
The seismic stratigraphy in the Fedynsky High area (Fig. 1) shows Lower Cretaceous onlap onto Jurassic strata, indicating a structural high in this area during the Early Cretaceous Period (Suslova, Reference Suslova2013). The Fedynsky High also acted as a local sediment source area during Early Cretaceous time, as small sediment lobes interfinger with the large-scale lobes around the fringes of the high itself (Kayukova & Suslova, Reference Kayukova and Suslova2015). Seismic profiles near the Fedynsky High show a depositional system advancing from the NE that envelops the high.
The Sentralbanken High (Fig. 1) was, at least partially, an uplifted high during the Early Cretaceous Period (NPD, 2017; Kairanov et al. Reference Kairanov, Escalona, Mordasova, Śliwińska and Suslova2018), and may have presented a sediment routing obstacle for the NW-sourced sediment transport system. A thin (c. 50 ms two-way time or TWT) unit prograded into the Olga Basin from the high (NPD, 2017; Kairanov et al. Reference Kairanov, Escalona, Mordasova, Śliwińska and Suslova2018). This unit represents a locally sourced depositional system, based on its small size in comparison to the larger lobes described above.
Pars of the Stappen High was an emerged island during Early Cretaceous time, while the fault zones to the east, west and south caused deepening of the rift basins that recorded wedge-shaped sediment volumes during the Hauterivian and Aptian ages (Blaich et al. Reference Blaich, Tsikalas and Faleide2017; Serck et al. Reference Serck, Faleide, Braathen, Kjølhamar and Escalona2017). Fault activity in the Leirdjupet Fault Complex and south of the Stappen High (Fig. 1) during Early Cretaceous time gave rise to mass wasting into the Fingerdjupet Sub-basin, while simultaneously spurring erosion at the high (Blaich et al. Reference Blaich, Tsikalas and Faleide2017).
The Loppa High (Fig. 1) was also tectonically active and emergent during Early Cretaceous time, and both highs acted as sediment-routing barriers as well as local sediment source areas during Barremian time (Indrevær et al. Reference Indrevær, Gabrielsen and Faleide2017). The exact timing of faulting and the associated influence of the highs on basin physiography has been suggested to be Late Jurassic – Early Cretaceous by Wood et al. (Reference Wood, Edrich, Hutchison, Tankard and Balkwill1989) and Gabrielsen et al. (Reference Gabrielsen, Grunnaleite and Ottesen1993), among others.
The Fingerdjupet Sub-basin represented a greater bathymetric depression during Barremian time due to the incipient Atlantic rifting, and received significant amounts of sediment during Early Cretaceous time (Serck et al. Reference Serck, Faleide, Braathen, Kjølhamar and Escalona2017). A clinoform set is recognizable on restored seismic sections, and is correlatable to the Bjarmeland Platform clinoforms (NW2, Section 5) when flattened on their downlap surface (Fig. 6g). Serck et al. (Reference Serck, Faleide, Braathen, Kjølhamar and Escalona2017) identified this unit to be late Hauterivian or early Barremian in age. This implies that the Fingerdjupet had been filled and levelled by the time the sediment lobe arrived, and that the pre-Barremian rifting was modest in magnitude. Renewed rifting postdates the NW-sourced lobe development and shows that the Fingerdjupet Sub-basin acted as a rift basin after the Barremian Age.
Summarized mapping of selected seismic profiles, as shown in Figure 3. Seismic data courtesy of TGS, Spectrum and NPD.

4. Palaeotectonic Boreal Basin configuration, High Arctic Large Igneous Province (HALIP) and the Lower Cretaceous Unconformity
The North Atlantic opening had not yet reached the present-day Arctic Region by the Barremian Age (c. 127 Ma) (Fig. 1, insert map), and Svalbard and the Barents Sea were joined with northern Canada and Greenland (Alvey et al. Reference Alvey, Gaina, Kusznir and Torsvik2008; Jackson & Dahl-Jensen, Reference Jackson and Dahl-Jensen2010; Torsvik et al. Reference Torsvik, Van der Voo, Preeden, Mac Niocaill, Steinberger, Doubrovine, van Hinsbergen, Domeier, Gaina, Tohver, Meert, McCausland and Cocks2012; Torsvik & Cocks, Reference Torsvik, Cocks, Cocks and Torsvik2016; Sømme et al. Reference Sømme, Doré, Lundin and Tørudbakken2018). Svalbard was positioned north of present-day Greenland (Fig. 1 insert), while its position relative to other landmasses east of the Atlantic rift in the Barents Sea has remained largely unchanged since the Cretaceous Period (Shephard et al. Reference Shephard, Müller and Seton2013). Combined, the area comprised the Boreal Sea, with the Barents Sea and the Sverdrup Basin as sub-basins within this widespread basin (Harland et al. Reference Harland, Gaskell, Heaffard, Lind, Perkins, Heafford, Lind, Perkins and Spencer1984).
The presence or absence of a significant landmass and sediment source area to the north of Ellesmere Island is of importance to the understanding of the palaeogeography and resultant stratigraphic record for the whole Arctic Region. Embry (Reference Embry1993) proposed the existence of Crockerland, an uplifted source terrane that fed large volumes of siliciclastic material to the Sverdrup Basin in the west, and also to Svalbard and the adjoining Barents Sea to the east. If Crockerland ever existed as a sediment source area, it is fragmented and intruded by igneous rocks to the extent that today it is masked from identification in seismic data (Anfinson et al. Reference Anfinson, Leier, Gaschnig, Embry and Dewing2012; Estrada et al. Reference Estrada, Mende, Gerdes, Gärtner, Hofmann, Spiegel, Damaske and Koglin2018). A source area such as Crockerland north of the present-day Sverdrup Basin, Arctic Canada, may account for the sediment volumes that were delivered to the Boreal Basin during Early Cretaceous time.
The High Arctic Large Igneous Province (HALIP) was active during the Early Cretaceous Period (Valanginian–Barremian) (Drachev & Saunders, Reference Drachev, Saunders, Scott and Thurston2006; Døssing et al. Reference Døssing, Jackson, Matzka, Einarsson, Rasmussen, Olesen and Brozena2013; Pease et al. Reference Pease, Drachev, Stephenson and Zhang2014), and is expressed as a series of intrusive and extrusive rocks on Svalbard, Greenland, Franz Josef Land, Canadian Arctic and in the Barents Sea (Maher, Reference Maher2001; Døssing et al. Reference Døssing, Jackson, Matzka, Einarsson, Rasmussen, Olesen and Brozena2013; Polteau et al. Reference Polteau, Hendriks, Planke, Ganerød, Corfu, Faleide, Midtkandal, Svensen and Myklebust2015a; Minakov et al. Reference Minakov, Mjelde, Faleide, Flueh, Dannowski and Keers2012, Reference Minakov, Yarushina, Faleide, Krupnova, Sakoulina, Dergunov, Glebovsky, Pease and Coakley2018; Buchan & Ernst, Reference Buchan and Ernst2018; Dockman et al. Reference Dockman, Pearson, Heaman, Gibson and Sarkar2018). Collectively termed the Diabasodden Suite on Svalbard (Senger et al. Reference Senger, Tveranger, Ogata, Braathen and Planke2014; Polteau et al. Reference Polteau, Hendriks, Planke, Ganerød, Corfu, Faleide, Midtkandal, Svensen and Myklebust2015a), the mafic dolerites mainly form sills and dykes within the mudstone-dominated strata older than the Helvetiafjellet Formation. The HALIP appears to have been the main agent for regional uplift in the northwestern corner of the present-day Barents Sea, tilting the lithosphere to form a basin that gradually deepened towards the SE. The HALIP caused an uplift of a source area north of present-day Svalbard, which set up a regional incision and a widespread fluvial system (Midtkandal & Nystuen, Reference Midtkandal and Nystuen2009). Fluvial deposits were formed, with small deltas (i.e. the Louiseberget Bed and equivalents; see Midtkandal et al. Reference Midtkandal, Nystuen, Nagy and Mørk2008; Grundvåg & Olaussen, Reference Grundvåg and Olaussen2017; Grundvåg et al. Reference Grundvåg, Jelby, Śliwińska, Nøhr-Hansen, Aadland, Sandvik, Tennvassås, Engen and Olaussen2019) filling the deepest topographic troughs in the underlying subaerial unconformity during the earliest stages of sedimentation. The causal link between the HALIP uplift and the existence of Crockerland remains undetermined, but such a structural connection represents a possible model for sourcing the volumes of Lower Cretaceous strata in the Sverdrup and Barents Sea basins.
The sharp and erosive surface separating the Berriasian–Hauterivian-aged carbonaceous Klippfisk Formation from the overlying Barremian–Aptian-aged siliciclastic Kolje Formation, is a seismically mappable regional unconformity correlative conformity in the Barents Sea (Faleide et al. Reference Faleide, Midtkandal, Planke, Corseri, Faleide, Serck and Nystuen2019) (Figs 5, 6). This surface is located near the base of the Cretaceous succession in the Barents Sea, but does not mark its base. The condensed successions represented by the Klippfisk and Knurr formations are older than this regional unconformity and, as such, the unconformity surface is identified as the LCU. The true Base Cretaceous (BC) lies beneath the Klippfisk and Knurr formations, or within the Hekkingen Formation. The BC is indistinguishable on conventional seismic data due to the low acoustic impedance between Jurassic mudstone and overlying Cretaceous mudstone. This is also discussed in Solheim et al. (Reference Solheim, Gustavsen, Musatov, Dypvik, Solheim, Musatov and Heinz1998), where they rule out marking the base of a succession of well-stratified reflectors as the base Cretaceous since that horizon matches an intra-Cretaceous reflector from Russian surveys. This reflector is suggested to be of Barremian age and to mark the same unconformity as that found at the base of the Helvetiafjellet Formation by Solheim et al. (Reference Solheim, Gustavsen, Musatov, Dypvik, Solheim, Musatov and Heinz1998).
The LCU is inferred to have developed due to subaerial exposure and/or shallow-marine wave-base erosion, or simply abandonment and condensation above the Klippfisk Formation. The Lower Cretaceous lobes (M. Dimitriou, unpub. MSc thesis, University of Oslo, 2014; Midtkandal et al. Reference Midtkandal, Faleide, Dahlberg, Dimitriou and Nystuen2014; Grundvåg et al. Reference Grundvåg, Marin, Kairanov, Śliwińska, Nøhr-Hansen, Jelby, Escalona and Olaussen2017; Marín et al. Reference Marín, Escalona, Sliwihska, Nøhr-Hansen and Mordasova2017) lap down onto the LCU; the surface is therefore a combined subaerial unconformity, followed by a marine flooding and transgressive surface(TS) merged into one composite surface. The surface correlates with the LCU beneath the Helvetiafjellet Formation on Spitsbergen. The downlap surface is therefore incorrectly identified as the BCU in Marín et al. (Reference Marín, Escalona, Sliwihska, Nøhr-Hansen and Mordasova2017), conflicting with the age and stratigraphic position of the Klippfisk and Knurr formations as the lowermost Cretaceous units in the area.
5. Results
5.a. Prograding lobes in the SW Barents Sea
The sediment lobes originated from two different source terranes and are treated separately. The lobes are labelled according to their direction of origin, and numbered in ascending order from youngest to oldest. This system allows future studies of older sediment lobes sourced from the NE in the Russian Barents Sea to build on the present numbering scheme. The youngest sediment lobe that was deposited in the Barents Sea with a source area to the NE is therefore termed NE1, the next, older lobe is termed NE2, and so on. The NW-sourced lobes are numbered according to descending relative age, with NW1 being oldest since no younger lobes are mappable due to erosion. This scheme corresponds with labels for the same units in Corseri et al. (Reference Corseri, Faleide, Faleide, Midtkandal, Serck, Trulsvik and Planke2018), but differs from the scheme applied in Marín et al. (Reference Marín, Escalona, Sliwihska, Nøhr-Hansen and Mordasova2017) and Grundvåg et al. (Reference Grundvåg, Marin, Kairanov, Śliwińska, Nøhr-Hansen, Jelby, Escalona and Olaussen2017), which combined lobes from the different terranes into single lobes and assigned labels according to interpretations of depositional sequences (S1–S6). Depositional volumes that were transported into the study area from different source areas have been assigned shared sequence names in Marín et al. (Reference Marín, Escalona, Sliwihska, Nøhr-Hansen and Mordasova2017), such as their sequence S5 that is mapped in three different areas in the SW Barents Sea, and appear to be the product of erosion from the Loppa High, the Finnmark Platform and an erosional terrane to the NE (their fig. 4, p. 1509). A summary of the differences between the mapped lobes of this study and those in Marín et al. (Reference Marín, Escalona, Sliwihska, Nøhr-Hansen and Mordasova2017) and Grundvåg et al. (Reference Grundvåg, Marin, Kairanov, Śliwińska, Nøhr-Hansen, Jelby, Escalona and Olaussen2017) is given in Figure 4.
The two depositional influx patterns both show internal clinoform architecture and external lobate geometry. Their labelling and distribution is summarized in Figure 3, and representative seismic profiles corresponding to labelled lines in Figure 3 are compiled in Figure 6.
5.b. NW lobes
Lobe NW1 is recognized as the easternmost NW-sourced lobe. It consists of well-defined sigmoidal clinothems that form a nearly 200-km SSW–ENE-oriented front NE of the Mjølnir Impact Crater (Fig. 3) (Dypvik et al. Reference Dypvik, Gudlaugsson, Tsikalas, Attrep, Ferrell, Krinsley, Mørk, Faleide and Nagy1996). Internal clinoform geometries indicate progradation from NW to SE. A profile aligned across the direction of depositional direction (Figs 4, 6f) suggests the progradation direction was close to ESE, judging by the lower angle of terminations on its western flank compared with its eastern flank.
Lobe NW2 laps onto the flank of lobe NW1 when flattened along its downlap surface and correlated across the high-resolution seismic profile that connects the two lobes (Fig. 5). High-resolution seismic data show that NW2 onlaps NW1, thus revealing their relative age relationship (Faleide et al. Reference Faleide, Midtkandal, Planke, Corseri, Faleide, Serck and Nystuen2019). It appears that NW2 initially prograded into the Fingerdjupet Sub-basin to the west, and subsequently fanned laterally eastwards towards the older lobe NW1. Lobe NW2 includes an extended toeset component that pinches out several kilometres basinward of the relatively steeply dipping foreset component, here labelled NW2x (discussed in Section 7.b).
A third lobe, NWBB, is recorded in the Bjørnøya Basin west of the Fingerdjupet Sub-basin (Fig. 3). Its internal architecture, depositional direction and general appearance are similar to the other NW-sourced lobes. It is heavily fragmented by post-depositional faulting, and does not lend itself to detailed characterization. Its age cannot be deduced in relation to other lobes, and no relative age number is assigned here. It may simply be lobe NW2 in a more proximal position.
Near its distal terminus, the clinothems in lobe NW2 show an abrupt thickness reduction, making the line of maximum lobe progradation identifiable. The top surface of the most distally developed clinothem represents a maximum regressive surface (MRS), in the sense of Helland-Hansen & Martinsen (Reference Helland-Hansen and Martinsen1996), and is applied as a reference when establishing palaeo-environmental reconstructions of the Barents Sea at the time of deposition.
5.c. NE lobes
The NE lobes developed in successive order from NE5 to NE1 and prograded over the NW lobes (Figs, 5, 6). Their clinoforms dip towards SW, and their terminal pinch-outs move incrementally further SW from lobe NE5 onwards (Figs 3, 4, 6). These lobes correspond broadly to sequences S3–S6 in Marín et al. (Reference Marín, Escalona, Sliwihska, Nøhr-Hansen and Mordasova2017), in the sense that they are widely distributed strata sourced from the NE with internal clinoforms, but their age and spatial distribution is mapped differently in this study (Fig. 4). The lobes exhibit overall lower foreset gradients, and longer distances between the clinoform rollover-points and toeset terminations compared with lobe NW1. Their topsets are generally poorly preserved, if at all. The Upper Regional Unconformity truncates the lobes. Their bounding surfaces are subtle in several places, and the demarcation included here is based on criteria that are not distinguishable in every profile, but rather a recurring shift in reflectivity, angle of dip and general appearance. Refer to Figures 3, 5 and 6 for distribution, relative age relationships and seismic appearance of each lobe.
Lobe NE5 (Figs 5, 6) chiefly laps onto the LCU within the study area, and is the oldest mappable lobe sourced from the NE in the Norwegian sector of the Barents Sea, but should have older equivalents further to the NE in the Russian Barents Sea. Its lower boundary cannot be defined in the available seismic data. Its seismic character is a series of reflectors that terminate onto the LCU with relatively steep angles compared with younger lobes. NE5 displays the tightest curvature along its frontal termination line among all NE lobes. NE5 is considered to have developed during the Aptian Age based on age extrapolation from its overlying lobe NE4.
Lobe NE4 (Figs 5, 6) laps onto lobes NE5 and NW1 and the LCU. It is similar in internal seismic facies to NE5, but with subtly steeper clinoforms. NE4 was deposited with a main axis of transport slightly south of NE5 when comparing clinoform dip-direction. NE4 advanced further SW than NE5, and was unhindered by lateral highs. NE4 is assigned to the upper Aptian Stage, by virtue of its position between lobes NE5 and NE3.
Lobe NE3 (Figs 5, 6) laps onto lobes NE2, SE1, NW1, NW2 and NW2x and the LCU, and is identifiable by sharp internal reflectors with downlaps. A complex, multi-phase compensational stacking along its front is inferred from internal termination, truncations and angular unconformities. The main transport axis was similar to NE4, according to clinoform dips (Fig. 5a). Palynological data obtained from boreholes 7231/01-U-01 and 7231/04-U-01 reported in Bugge et al. (Reference Bugge, Elvebakk, Fanavoll, Mangerud, Smelror, Weiss, Gjelberg, Kristensen and Nilsen2002), and a tie from the latter borehole to the seismic profile illustrating lobe NE3 in Figure 5, place lobe NE3 in the upper Aptian Stage, and the boundary between lobes NE3 and NE2 is near the Aptian–Albian boundary.
Lobe NE2 (Figs 5, 6) laps onto lobes NE3, NW2x and SE1, and onto the LCU. It represents an abrupt shift into transparent seismic facies compared with NE3. Its clinoforms dip towards the SW, showing unchanged sediment transport direction. Lobe NE2 developed after the upper Aptian lobe NE3, placing it in the lower–middle Albian strata. According to Bugge et al. (Reference Bugge, Elvebakk, Fanavoll, Mangerud, Smelror, Weiss, Gjelberg, Kristensen and Nilsen2002, figs 6, 7), the lower boundary of the Kolmule Formation is picked at base Albian. This implies that the base of lobe NE2 is also the base of the Kolmule Formation, and that the older lobes NE3, NE4 and NE5 belong to the Kolje Formation. The established lithostratigraphic scheme by Worsley et al. (Reference Worsley, Johansen and Kristensen1988) is unsuited for the stratigraphic resolution in this study, and a separate effort to establish a practical lithostratigraphic scheme for this region is warranted.
Schematic chronostratigraphy of the western Barents Sea for the Lower Cretaceous strata. Chronostratigraphic ages are from Cohen et al. (Reference Cohen, Finney, Gibbard and Fan2013; updated) and Midtkandal et al. (Reference Midtkandal, Svensen, Planke, Corfu, Polteau, Torsvik, Faleide, Grundvåg, Selnes, Kürschner and Olaussen2016) for the Barremian–Aptian stage boundary. Hoop FC area: Hoop Fault Complex area.

Lobe NE1 (Figs 5, 6) is the youngest of the NE lobes, and downlaps onto lobe NE2 and the LCU (Fig. 6). It exhibits less transparency than NE2, with better resolvable clinoforms. The clinoform foreset reflectors dip steeper than those in NE2, with tangential downlaps. The NE1 topsets are either eroded or poorly imaged. Bugge et al. (Reference Bugge, Elvebakk, Fanavoll, Mangerud, Smelror, Weiss, Gjelberg, Kristensen and Nilsen2002) have proposed that lobe NE1 strata in borehole 9230/05-U-09 are of late Albian or early Cenomanian age (Fig. 3).
Lobe SE1 downlaps onto the LCU, and is conspicuous as a single lobe that appears to have originated from the SE. Its frontal termination line is NNE–SSW-oriented, and well-defined internal reflectors show progradation towards the ENE. Lobe SE1 is similar in age to lobe NE3 (late Aptian), judging by its stratigraphic position below NE2.
6. Sediment source areas, depocentres and basin physiography: a summary of observations
The Lower Cretaceous strata on Svalbard and the NW lobes in the Barents Sea have the same Crockerland/HALIP sediment source area based on sediment transport direction data (e.g. Gjelberg & Steel, Reference Gjelberg and Steel1995; Midtkandal & Nystuen, Reference Midtkandal and Nystuen2009). The HALIP age and associated widespread uplift fits the subaerial erosion and fluvial deposits well. The Lomonosov Ridge was emerged during Early Cretaceous time (Cochran et al. Reference Cochran, Edwards and Coakley2006; Backman et al. Reference Backman, Jakobsson, Frank, Sangiorgi, Brinkhuis, Stickley, O’Regan, Løvlie, Pälike, Spofforth, Gattacecca, Moran, King and Heil2008; Knudsen et al. Reference Knudsen, Hopper, Bierman, Bjerager, Funck, Green, Ineson, Japsen, Marcussen, Sherlock, Thomsen, Pease and Coakley2018) and must have delivered some sediments to surrounding depocentres. However, its landmass is roughly one-fifth the size of the sedimentary sink detailed here, making it insufficient as a lone sediment source. The total sediment source area may have included the Lomonosov Ridge (Jackson & Dahl-Jensen, Reference Jackson and Dahl-Jensen2010), but the total uplifted area must have been larger (e.g. Davidson & North, Reference Davidson and North2009).
The Taimyr and North Kara region was located north of Novaya Zemlya during Early Cretaceous time and may have been the main source area for the NE-sourced lobes (Inger et al. Reference Inger, Scott and Golionko1999; Torsvik & Andersen, Reference Torsvik and Andersen2002; Zhang et al. Reference Zhang, Pease, Skogseid and Wohlgemuth-Ueberwasser2015).
Novaya Zemlya was emerged during Early Cretaceous time (Smelror et al. Reference Smelror, Petrov, Larssen and Werner2009), as evident from sediment lobes to its west and east, which interfinger with the large-scale lobes described above (Suslova, Reference Suslova2013; Kayukova & Suslova, Reference Kayukova and Suslova2015; Polteau et al. Reference Polteau, Hendriks, Planke, Ganerød, Corfu, Faleide, Midtkandal, Svensen and Myklebust2015a). The South Kara Sea east of Novaya Zemlya also received sediments from Novaya Zemlya at the same time as the Barents Sea was fed by sediments originating during this orogeny (Drachev et al. Reference Drachev, Malyshev and Nikishin2010; Faleide et al. Reference Faleide, Pease, Curtis, Klitzke, Minakov, Scheck-Wenderoth, Kostyuchenko, Zayonchek, Pease and Coakley2017). As a consequence, sediment transport from the erosion of Novaya Zemlya was shared between the Kara Sea and the Barents Sea. Novaya Zemlya is consequently considered a modest sediment source, ultimately contributing to the overall basin physiography as opposed to being the source for sedimentary infill.
6.a. Timing of sediment arrival, island emergence and Cretaceous faulting
Improved temporal constraints on basin infill are possible by combining well data with seismic tie-lines and relative timing relationships. Biostratigraphic analysis of borehole 7321/7-1 (Fig. 3) in the Fingerdjupet Sub-basin (Figs 1, 3), dates sediment arrival, erosion and faulting in a temporal framework within the Hauterivian–Albian ages. Subsidence and sedimentation in the Fingerdjupet Sub-basin after Barremian time allow a higher-resolution temporal breakdown than on the surrounding platforms and highs. Serck et al. (Reference Serck, Faleide, Braathen, Kjølhamar and Escalona2017) resolved the main phases of tectonostratigraphic evolution of the Fingerdjupet Sub-basin, enabling the present study to build on their framework (Fig. 7).
Late Jurassic: Shelf platform conditions prevailed on Svalbard and in the western Barents Sea. The Fuglen and Hekkingen formations developed.
Valanginian: The Hekkingen and Knurr/Klippfisk formations developed as hemipelagic mud and starved platform conditions on the Bjarmeland Platform (Fig. 7). The earliest onset of sag or rifting in Fingerdjupet Sub-basin (sequence 3 in Serck et al. Reference Serck, Faleide, Braathen, Kjølhamar and Escalona2017) occurred during this time interval.
Hauterivian: The Knurr and Klippfisk formations developed in the west and east, respectively (Fig. 7). The Knurr Formation formed a siliciclastic wedge sourced from the west or NW. This widespread, shallow ocean basin experienced several periods of sediment starvation in its central areas due to long distances from any siliciclastic sediment source. Habitable conditions for benthic, carbonate-secreting organisms developed (structural highs not necessary), thereby developing the Klippfisk Formation on an open, unprotected platform.
Earliest Barremian (Fig. 7): The Barents Sea distal equivalent unit to the Festningen Member of the Helvetiafjellet Formation should show a slightly younger Barremian age, but cannot be determined accurately without fossils or radiometric age data. NW-sourced lobes NW1 and NW2 prograded into the Fingerdjupet Sub-basin and the Bjarmeland Platform after sea-level rise and transgression of the LCU. The Loppa High inversion took place during this time (Indrevær et al. Reference Indrevær, Gabrielsen and Faleide2017), causing emergence and minor sediment delivery to surrounding depocentres. Emergence of the Sentralbanken and/or Gardarbanken highs (NPD, 2017; Kairanov et al. Reference Kairanov, Escalona, Mordasova, Śliwińska and Suslova2018) may have diverted the river system into different areas of the Bjarmeland Platform area.
Latest Barremian: NW lobes were buried by horizontally stratified strata after further relative sea-level rise and consequent widespread marine flooding. Rifting was revived in the Fingerdjupet Sub-basin (Serck et al. Reference Serck, Faleide, Braathen, Kjølhamar and Escalona2017) (Fig. 7).
Aptian: Continued rifting occurred in the Fingerdjupet Sub-basin while the Bjarmeland Platform area experienced a prolonged period of very little sedimentation (Fig. 7). The Oceanic Anoxic Event 1a was recorded on Svalbard and elsewhere (Midtkandal et al. Reference Midtkandal, Svensen, Planke, Corfu, Polteau, Torsvik, Faleide, Grundvåg, Selnes, Kürschner and Olaussen2016; Vickers et al. Reference Vickers, Price, Jerrett and Watkinson2016). This was the time of the earliest arrival of NE-sourced lobes (lobe NE5) in the study area.
Aptian–Albian: Main phase of extension and associated faulting that post-dates the deposition of the NW-sourced lobes. The NE-sourced lobes continued to prograde towards SW onto and across the Bjarmeland Platform until the middle Albian age. The Svalbard area became flooded at this time, forming accommodation for the open-shelf Carolinefjellet Formation.
Late Albian – Cenomanian: The youngest NE-sourced lobe (NE1) was deposited in the study area.
7. Discussion
7.a. Source areas and implications for palaeotectonic configuration
Svalbard contains Barremian strata and was part of a widespread continental to marginal marine depocentre that experienced fluvial deposition and gradual base level rise (Midtkandal & Nystuen, Reference Midtkandal and Nystuen2009). The significant volumes of sediment on Svalbard and basinward have implications for size estimation of the upstream drainage area. While the HALIP can explain uplift of a source area, a palaeotectonic configuration that supports a landmass of sufficient size is necessary (Midtkandal et al. Reference Midtkandal, Holbrook, Faleide, Myers, Van Yperen, Shephard and Nystuen2018).
Lobes NE5 and NE4 were funnelled through the passage between the Sentralbanken High to the north, and the Fedynsky High to the south (Figs 1, 3), and their frontal curvature and lateral distribution were affected by these highs. At the time of lobe NE3 deposition, the Fedynsky High appears to have been surrounded by the NE-sourced sediments, and gave rise to another lobe development, SE1, on its southern flank (Fig. 3). The progradational lobes were redirected around the high, and continued SSW-wards. Seismic profiles near the Fedynsky High show a depositional system that envelops the high, with sediment transport from the NE routed around this obstacle (Kayukova & Suslova, Reference Kayukova and Suslova2015). Although the sediment transport direction of lobe SE1 appears to have been from the SE, there are no candidate source terranes located in that direction according to seismic profiles presented in Kayukova & Suslova (Reference Kayukova and Suslova2015). The source area for lobe SE1 is therefore suggested to have been the same as for the lobes NE1–NE5. The NW direction of progradation of lobe SE1 is interpreted to reflect a routing of sediment around the Fedynsky High at approximately the same time as development of lobe NE3 (late Aptian).
The Gardarbanken High (Fig. 1) was, similarly to the Sentralbanken High, located near the distal terminus of the NW-sourced lobes described above. Most of the Gardarbanken High is located outside the Lower Cretaceous subcrop (Fig. 1), making direct observations from seismic data impossible. However, the broad front along the NW lobes suggests that sediments were unaffected by any highs in this area during Early Cretaceous time.
The Hoop Graben was a modest bathymetric depression, but no evidence of significant sediment rerouting is discernible here on seismic data. Similarly, the NE-sourced lobes are restored by flattening the seismic data on their downlap surface on both sides of the Nordkapp Basin, indicating this area was flat at the time (Fig. 6). Note that the seismic profiles in Figure 6 cover parts of the Nordkapp Basin, as restoration is possible into the rim-syncline of the salt-cored basin.
7.b. Sediment lobe composition and depositional environments
While the Lower Cretaceous strata on Spitsbergen are well mapped and with known lithologies, the lithologic composition of the time-equivalent NW lobes in the Barents Sea is unknown. Possible depositional systems may include subaqueous delta clinoforms and shelf prism clinoforms in the sense of Patruno et al. (Reference Patruno, Hampson and Jackson2015). Basin margin clinoforms are considered too large and unlikely in the basinal setting, and delta clinoforms are generally an order of magnitude smaller. A restoration of clinoform heights and corresponding foreset dip angles according to an average seismic velocity of 2900 m s–1 and a maximum burial of 2300 m yields typical lobe heights of c. 200 m. This suggests the lobes represent an intrashelf platform strata (Grundvåg et al. Reference Grundvåg, Marin, Kairanov, Śliwińska, Nøhr-Hansen, Jelby, Escalona and Olaussen2017; Midtkandal et al. Reference Midtkandal, Faleide, Faleide, Planke, Anell and Nystuen2019), similar to those described by Mountain & Proust (Reference Mountain and Proust2010).
The runoff system that formed the NW lobes has transported sediment at least 800 km from a source area located NW and/or north of Svalbard, while the sediments in the NE lobes appear to have been transported in excess of 1500 km. A fluvial sediment transport distance in the range of 800–1500 km is not an argument against a sandy coast in the Early Cretaceous Boreal Basin, as evident from modern rivers (e.g. Rivera et al. Reference Rivera, Karabanov, Williams, Buchinskyi and Kuzmin2006). If the sediment transport was mainly by marine currents in a shallow marine setting, the lobe composition is probably mud and/or silt (Cosgrove et al. Reference Cosgrove, Hodgson, Poyatos-Moré, Mountney and McCaffrey2018). At their basinward terminus, the clinoforms in lobe NW2 include an extended toeset component that reaches several kilometres basinward of the relatively steeply dipping foreset component, here labelled NW2x (Figs 3, 5). This depositional lobe may have formed by gravitationally triggered mass wasting along the lobe front with the development of a coalesced turbidite fan in front of the parent sedimentary lobe, similar to that described in Hodgson et al. (Reference Hodgson, Browning, Miller, Hesselbo, Poyatos-Moré, Mountain and Proust2018).
7.c. Refined Lower Cretaceous depositional model in the Barents Sea
A refined depositional model for the Lower Cretaceous sedimentation in the Barents Sea is proposed here (Fig. 8). This model ties the Svalbard stratigraphy in with the NW lobes, is a refined version of the regional conceptual model of Midtkandal & Nystuen (Reference Midtkandal and Nystuen2009) and bridges the correlation gap presented in Grundvåg et al. (Reference Grundvåg, Marin, Kairanov, Śliwińska, Nøhr-Hansen, Jelby, Escalona and Olaussen2017).
Depositional model for the NW-sourced sediment influx, tying in the outcrop area on Svalbard with the strata imaged on seismic profiles in the Bjarmeland Platform together. See discussion in text for details. Refer to Figure 3 for location of borehole 7324/2-1. Yellow and orange colours indicate sandy strata; brown and grey indicate mud-dominated strata; blue is water.

The Valanginian Knurr and Klippfisk formations in the Barents Sea are distal equivalents to the Rurikfjellet Formation on Svalbard. The Klippfisk Formation was partially covered by marine mud from the west or NW during deposition of the Rurikfjellet Formation (Fig. 8a). A fall in relative sea level developed a regionally significant subaerial surface of erosion (LCU) over the Rurikfjellet Formation and marks the onset of fluvial incision and deposition across Svalbard (Fig. 8b). The correlative composite conformity surface of LCU on the Bjarmeland Platform marked the end of carbonate development in this area.
A forced regressive delta is presumed to have developed between the outcrop area on Spitsbergen and the Bjarmeland Platform subcrop area in response to this base level fall (Fig. 8b, c). Renewed rise in relative sea level created accommodation both in Spitsbergen and on the Bjarmeland Platform. This resulted in continued fluvial deposition represented by the Festningen Member in the Helvetiafjellet Formation on Spitsbergen (Fig. 8b, c). A normal regressive delta and shelf deposition occurred on the Bjarmeland Platform (Fig. 8c), forming the NW lobes. Continued normal regression on the Bjarmeland Platform gave rise to further progradation of the NW lobes until the point of maximum regression (Fig. 8d).
A thin mudstone unit containing marine foraminifera marks the top of the Festningen Member of the Helvetiafjellet Formation on Spitsbergen (Midtkandal et al. Reference Midtkandal, Nystuen and Nagy2007) (Fig. 8e). This marine flooding surface is of regional significance, and has been applied as a datum for correlation between outcrop sites on Spitsbergen (Midtkandal & Nystuen, Reference Midtkandal and Nystuen2009). This flooding surface is marked by mud deposition on the Bjarmeland Platform (Fig. 8e). On Spitsbergen, the marine flooding was succeeded by aggradational to regressive deposition in the Glitrefjellet Member, followed by transgression during development of the Carolinefjellet Formation (Fig. 8f, g).
The NE lobes arrived in the Bjarmeland Platform area near the Aptian–Albian age transition (Fig. 8h).
7.d. Palaeogeography of the Early Cretaceous Barents Sea
The assembled data are used to establish an approximate palaeogeographic reconstruction of the Barents Sea for the Barremian–Aptian–Albian stages, with details from the dataset summarized in Figures 5 and 9. Our reconstructions depart from the maps presented in Marín et al. (Reference Marín, Escalona, Sliwihska, Nøhr-Hansen and Mordasova2017) and Grundvåg et al. (Reference Grundvåg, Marin, Kairanov, Śliwińska, Nøhr-Hansen, Jelby, Escalona and Olaussen2017) as detailed in Figure 4, and their palaeotectonic reconstruction. The palaeogeography is coupled with the palaeotectonic constellation of landmasses in Figure 1, which are updated according to Shephard et al. (Reference Shephard, Müller and Seton2013) and Shephard et al. (Reference Shephard, Flament, Williams, Seton, Gurnis and Müller2014).
Schematic palaeogeographic reconstruction of environments for the Barents Sea during the (a) Barremian; (b) Aptian; and (c) Albian ages. The background tectonic configuration is adapted from Shephard et al. (Reference Shephard, Müller and Seton2013). See text for details.

During the Barremian Age (Fig. 9a), the time of maximum regression onto the Bjarmeland Platform area for the NW-sourced lobe front is illustrated, while the NE-sourced lobes were yet to prograde into the study area. The Loppa and Fedynsky highs were isolated islands, while the Sentralbanken High (and possibly Garderbanken High) were highs that were encompassed by the advancing coast, as also noted in Kairanov et al. (Reference Kairanov, Escalona, Mordasova, Śliwińska and Suslova2018). The Sverdrup Basin (Fig. 9a) also received fluvial sediments during the same time period (Embry, Reference Embry1993). The incipient Atlantic rifting (Ziegler, Reference Ziegler and Ziegler1988; Faleide et al. Reference Faleide, Vågnes and Gudlaugsson1993) is inferred to have formed a bay in response to extension along North Greenland faults during the pre-Eurekan deformation phase (Piepjohn et al. Reference Piepjohn, von Gosen and Tessensohn2016).
The Aptian stage (Fig. 9b) marks two significant shifts in the infill and relative sea-level changes in the Boreal Basin; the NW-sourced lobes were flooded and replaced with an open shelf environment in the Bjarmeland Platform area. A tidally influenced depositional system gave rise to the Glitrefjellet Member of the Helvetiafjellet Formation in the Spitsbergen area (e.g. Midtkandal et al. Reference Midtkandal, Nystuen and Nagy2007; Grundvåg et al. Reference Grundvåg, Marin, Kairanov, Śliwińska, Nøhr-Hansen, Jelby, Escalona and Olaussen2017; Grundvåg & Olaussen, Reference Grundvåg and Olaussen2017).
The contemporaneous NE-sourced lobes NE5 and NE4 advanced into the eastern study area, and encompassed the Fedynsky High. Continued Atlantic rifting opened up the NW–SE-oriented bay further (Piepjohn et al. Reference Piepjohn, von Gosen and Tessensohn2016), and reflects palaeogeographic reconstructions in NE Greenland proposed by Håkansson & Stemmerik (Reference Håkansson, Stemmerik and Spencer1984), Håkansson & Pedersen (Reference Håkansson and Pedersen2001) and Dypvik et al. (Reference Dypvik, Håkansson and Heinberg2002).
The Albian stage (Fig. 9c) continued the Aptian stage development. The NE-sourced lobes NE3, NE2 and NE1 prograded SW-wards across the Bjarmeland and Finnmark platform areas, while a fully marine environment developed as a result of further relative sea-level rise across the Spitsbergen area (e.g. Grundvåg & Olaussen, Reference Grundvåg and Olaussen2017).
7.e. Depositional dynamics in a low-gradient, low-accommodation basin
The depositional architecture displayed by the Barents Sea Lower Cretaceous strata reflects an accommodation-driven sedimentary style. The very low-angle ramp geometry of the Boreal Basin shelf had the potential to create significant and widespread changes in relative sea level, thereby altering depositional patterns over large areas. As an example, this is expressed on Spitsbergen as the abrupt shift from the fully fluvial Festningen Member of the Helvetiafjellet Formation to the marginal marine Glitrefjellet Member that overlies it (Figs 2b, 8d, e), marking a maximum regression/transgression surface (MRS/TS). The downstream Bjarmeland Platform equivalent is the maximum regression and onset of flooding of the NW-sourced sediment lobes (Fig. 8d, e). These changes shifted the positions of fluvial delivery to the marine basin from NW to NE and the corresponding marine facies belts further basinward, similarly to the Triassic development in the Barents Sea as documented by Glørstad-Clark et al. (Reference Glørstad-Clark, Faleide, Lundschien and Nystuen2010, Reference Glørstad-Clark, Birkeland, Nystuen, Faleide and Midtkandal2011).
In the Early Cretaceous Barents Sea area the regional tilt was caused by minor changes in the lithospheric plate inclination, presumably driven by deeper mantle processes associated with the ascending plume, giving rise to the HALIP. As the plume rose, the amplitude of the surface uplift increased while its periphery was lowered. The marginal (peripheral) regions of the dome (i.e. the Barents Shelf) experienced transient uplift followed by subsidence (Friedrich et al. Reference Friedrich, Bunge, Rieger, Colli, Ghelichkhan and Nerlich2018). Similarly, the shift in depositional influx from NW to NE must have been driven by long-wavelength tectonic tilting that caused the HALIP-related sediment drainage area to reduce its delivery to the distal terminus, while simultaneously allowing the Taimyr-related drainage to become dominant. The depositional system sourced from the NE had to fill the wide Russian part of the sink before entering our study area in the Norwegian Barents Sea. Ultimately, this affected stratigraphic patterns across the entire low-accommodation basin. The Bjarmeland Platform area remained a depocentre for the clinoform-bearing shelf platform development throughout a period when the depositional influx was reorganized in its entirety. This can only be explained by substantially altering the sediment source areas and components of the upstream reaches of the system tracts, while the basin conditions at the depositional termini remained relatively unchanged. Consequently, the Bjarmeland Platform area must have experienced continued subsidence for the stacking of shelf platform lobes to take place. A complicating factor is the Atlantic rifting and its trough at the leading edge of seafloor spreading (Ziegler, Reference Ziegler and Ziegler1988; Faleide et al. Reference Faleide, Vågnes and Gudlaugsson1993; Piepjohn et al. Reference Piepjohn, von Gosen and Tessensohn2016).
The depositional model outlined here highlights the regional importance of two stratigraphic surfaces: the downlap surface at the base of the sedimentary lobes, and the maximum regressive/transgressive surface (MRS/TS) at their top. The downlap surface at the base of the NW lobes and correlative unconformity at the base of the Helvetiafjellet Formation on Svalbard are distal and proximal expressions of the LCU, respectively. The diachronous nature of an erosive unconformity dictates that the LCU varies in age across the Svalbard–Barents Sea region; the surface is younger at Spitsbergen than at the Bjarmeland Platform. The LCU should therefore be considered a sequence stratigraphic correlation surface and not a timeline. Additionally, the two different lobe complexes have temporally different maximum regression surfaces, and should be treated separately. The MRS/TS above the Festningen Member and the NW-lobes arguably represents a shorter timespan than the LCU, but the > 300 km separation between the onshore (Svalbard) and the offshore (Bjarmeland Platform) strata is an argument against applying the surface as an isochronous timeline due to lag times from downstream to upstream across significant distances (Schumm, Reference Schumm1993). Despite their diachronous nature, the LCU at the base of the lobe deposits and the MRS/TS can be applied as regionally significant horizons for seismic correlation with future datasets.
8. Conclusions
Seismic data from the Bjarmeland Platform in the Barents Sea reveal well-defined sediment lobes with clinoforms. The mapped lobes originated from two different source areas: one from the NW in an area uplifted by the High Arctic Large Igneous Province (HALIP) NW of Svalbard; and the other from the NE, possibly from the Taimyr region in northern Russia. The resultant palaeogeographic reconstruction differs from previously published maps in accordance with the different ages of the depositional lobe sets. The lobe with a NW source is a distal stratigraphic product of the Barremian-aged forced regression recorded on Svalbard. The lobes sourced from the NE developed over a longer distance.
Accommodation-driven sediment transport and storage played a significant role in filling this epicontinental basin. Long-wavelength tectonic tilting, likely associated with the HALIP, affected sediment transport systems across the whole low-gradient, low-accommodation basin, thereby shifting shoreline positions and associated facies belts across hundreds of kilometres. Consequently, low-accommodation basin infill patterns may be attributed to forcing mechanisms that originate far outside the study area, and possibly unavailable for detailed analysis. Single correlative surfaces can be identified or inferred along depositional strike from the fluvial to marine domains, but their application as temporal markers should be treated with care.
Acknowledgements
The authors thank TGS and NPD for providing seismic data and allowing us to use the data in this publication. We also acknowledge support from the Research Centre for Arctic Petroleum Exploration (ARCEx), which is funded by the Research Council of Norway (grant no. 228107) together with ten academic and nine industry partners, and the Centre for Earth Evolution and Dynamics (CEED) funded by the Research Council of Norway through their Centre of Excellence grant (no. 223272). Insights, comments and discussions with Henrik Stokke, Maria Dahlberg, John Holbrook, Cody Myers and Anna van Yperen have improved the discussion in this manuscript. Constructive reviews and editorial comments from R. Jerrett, T. Klausen, S. Henriksen and S. Hubbard as well as two anonymous reviewers have helped to refine earlier versions of the text.
Conflict of interest
None.