1. Introduction
In England, informal carersFootnote 1 are the primary source of social care support for people with long-term care (LTC) needs. Many people will, at some point in their life, provide informal care to a family member, a relative or a friend. The most common caring relationships involve adult children caring for an elderly parent, care between spouses and a parent caring for a disabled child (Pickard, Reference Pickard2013). Caring activities range from help with light daily activities to intensive, around the clock care for complex health care needs. Caring responsibilities have been shown to have significant impacts on informal carers' employment, health and wellbeing (Courtin et al., Reference Courtin, Jemiai and Mossialos2014). Warnings have also been raised about significant imbalances between the increasing demand for informal care (e.g. due to the ageing population; Wittenberg et al., Reference Wittenberg, Hu, Hancock, Morciano, Comas-Herrera, Malley and King2011) and the expected decrease in informal care supply linked to factors such as a greater female labour force participation and an increased geographical dispersion of family networks (Pickard, Reference Pickard2013).
Informal care is recognised as fundamental to the sustainability of LTC systems, both in the English national context and internationally. National and local governments however offer various levels of support and incentives for informal carers (Courtin et al., Reference Courtin, Jemiai and Mossialos2014). Over the past 20 years, the key role of informal care in the English social care system has been reflected in legislation and policy. Recently, the Care Act 2014 brought about an enhanced recognition of the legal status of carers. The Act gave carers equal rights to a needs assessment (a necessary step for receiving social care support) and clarified the factors that should be considered when assessing carers' eligibility (Care Act, 2014). However, there are concerns as to what extent these rights have translated into increased support for carers. Evidence suggests that many carers are not helped by social care services, with only around 65% of carers receiving an eligibility assessment (Carers UK, Reference Carers2018).
The increasing recognition and importance of informal carers need to be considered in the context of the formal social care services available to users. Since the financial crisis of 2008, publicly-funded social care services have operated in a challenging environment. The fiscal austerity imposed on English local authorities2 (LAs) resulted in a contraction of LA budgets, and consequently, in a reduction in LA-funded (i.e. publicly-funded) social care (Fernandez et al., Reference Fernandez, Snell and Wistow2013b). Between 2007/2008 and 2012/2013, LA budgets were reduced by an average of 30%. In order for LAs to balance the books, stricter eligibility criteria (i.e. needs test) for access to LA-funded care have been imposed (Fernandez et al., Reference Fernandez, Snell, Forder and Wittenberg2013a). As a result, LA-funded services are available to fewer users, but with more significant care needs. Those who are not eligible for LA-funded care would need to purchase services privately, rely on informal care or get by without having their needs fully met (Hancock et al., Reference Hancock, Morciano and Pudney2019).
This paper explores the impact of the reduction in formal care provision on informal care utilisation in England between 2001 and 2011. We hypothesised that, even though part of the reduction in LA-funded social care was likely to be replaced with privately-funded (so-called self-funded) care, informal care provision would increase to ‘fill the gap’ left by the reductions in LA-funded formal care services. We tested this hypothesis using small area data from the English censuses from 2001 to 2011. These datasets provided an unprecedented opportunity to analyse changes in the levels and determinants of informal care across the entire population in England, and to control for a range of factors known to influence informal care provision. We examined the effects of individual and local factors on patterns of informal care provision and compared the local area analysis with the results of previous individual-level data studies. It has been argued that the relationship between formal and informal care is inherently endogenous (Van Houtven and Norton, Reference Van Houtven and Norton2004). We addressed this by using instrumental variable models and instrumented formal care using lagged indicators of formal care provision at the LA level.
This paper proceeds as follows: Section 2 outlines the English social care system and key literature focusing on the relation between formal and informal care and the drivers of supply and demand for informal care. Section 3 outlines the data and methods used, followed by the results of our empirical modelling in Section 4. The discussion in Section 5 concludes the paper.
2. Background
The drivers and outcomes of informal care, and the interplay between informal care and work, have received much attention in the literature (e.g. Spiess and Schneider, Reference Spiess and Schneider2003; Lilly et al., Reference Lilly, Laporte and Coyte2007; Courtin et al., Reference Courtin, Jemiai and Mossialos2014). Informal care provision varies in terms of time investment, care duration and the number and type of care tasks. Frequently, informal care includes supporting the care recipient with housework (e.g. cooking and cleaning), personal care (e.g. dressing, washing and toileting), health care needs, mobility, administrative tasks and socialising (Hancock et al., Reference Hancock, Morciano and Pudney2019). Whether and how much informal care is provided is a function of, sometimes contradictory, underlying structures of supply and demand, as well the availability and cost of formal care services. In this section, we discuss the possible determinants of the observed informal care provision in terms of demand and supply of informal care. First, however, we discuss the English social care system and the effects of the budget cuts, as well as the current state of research on the relationship between formal and informal care.
2.1 The social care system in England and austerity
In England, tax-funded public social care is organised by 152 LAs.Footnote 2 They are responsible for the funding and commissioning of institutional and community-based social care (Fernandez et al., Reference Fernandez, Snell and Wistow2013b). Once a user has been assessed as in need of care, a financial assessment (i.e. means test) determines whether the services will be funded by the LA, by the service user or by contributions from both. In 2011/12, individuals with assets worth more than £23,250 did not receive care funded by their LA (Fernandez et al., Reference Fernandez, Snell, Forder and Wittenberg2013a). Consequently, a significant proportion of services in the English social care system are purchased directly by so-called ‘self-funders’, that is, people who do not meet the means test criteria or indeed choose to pay for their care. This care is purchased out of pocket by care users or their families from privately owned and managed providers (Forder and Allan, Reference Forder and Allan2011). Little is known about the situation of self-funders and how they use formal and informal care. The combination of means and needs tests results in several possible combinations of care provision (and associated funding): LA-funded/commissioned care; self-funded/privately-purchased care; and informal care. Many people use a combination of two or more options.
Generally, informal care is unpaid. However, some funding is available to informal carers, including Carer's Allowance and less frequently, Direct Payments. A significant proportion of users do not receive any LA-funded care and may not afford self-funded care, leading to unmet needs. In the English Longitudinal Study of Ageing (ELSA), 31.6% of over 65 years old who reported difficulties with activities of daily living (ADLs) received no help at all (Vlachantoni et al., Reference Vlachantoni, Shaw, Willis, Evandrou, Falkingham and Luff2011). In summary, informal care plays a central role in the combination of LA-funded social care, self-funded care and unmet needs. This complex landscape of providers and funders has implications for our empirical modelling, as we discuss below.
Between 2005/2006 and 2012/2013, spending on social care services by LAs had been reduced by an average of 26% (Fernandez et al., Reference Fernandez, Snell and Wistow2013b). This was achieved through stricter eligibility criteria (i.e. needs test) for LA-funded social care which resulted in LAs providing services to a smaller number of people, but with the most significant needs in the population (Fernandez et al., Reference Fernandez, Snell, Forder and Wittenberg2013a). The effect on the offer of social care services was particularly evident for older people; between 2005/2006 and 2011/2012, the total number of older clients (unadjusted) dropped by 31%. The reduction in the number of clients related predominantly to community care users, while nursing and residential care client numbers remained stable between 2007 and 2013 (Fernandez et al., Reference Fernandez, Snell and Wistow2013b). Community care is, more so than other types of services, used in conjunction with informal care provision, but can also be substituted by informal care. This means that the availability of community care provision is particularly relevant when exploring patterns of informal care.
2.2 The relationship between formal and informal care
One of the key challenges for the empirical analysis of this paper is to disentangle the relationship between the utilisation of formal and/or informal care. The issue of whether, and under what circumstances, formal and informal care can complement or substitute each other has been studied extensively (see Langa et al., Reference Langa, Chernew, Kabeto and Katz2001; Van Houtven and Norton, Reference Van Houtven and Norton2004; Bolin et al., Reference Bolin, Lindgren and Lundborg2008).
A key concern, as highlighted by Van Houtven and Norton (Reference Van Houtven and Norton2004), is the likely presence of endogeneity in the relationship between formal and informal care. The key causes of the endogeneity are reverse causality and inadequately controlled for need. At the individual level, the decision to provide informal care may be joint between a user and a carer, and hence may be endogenous to the availability of formal care provision (Gannon and Davin, Reference Gannon and Davin2010). Also, it is likely that the user's unobserved health impairments can influence both the amount of formal care and the amount of informal care utilised. This can increase the bias of the estimated effect of informal care on formal care, leading to the flawed conclusion that informal care is positively related to formal care services (Bremer et al., Reference Bremer, Challis, Hallberg, Leino-Kilpi, Saks, Vellas, Zwakhalen and Saurland2017). These dynamics apply to the area-level analysis in this paper in the same way as they do to micro-data analysis.
Out of the previous papers using rigorous methods accounting for endogeneity, formal and informal care are found to be both substitutes and complements depending on a range of factors, such as type of service and severity of need. The relationship is also complex in that the two types of care can be provided at the same time or precede or follow one another (Van Houtven and Norton, Reference Van Houtven and Norton2004). The literature suggests that various types of formal care services, such as hospital care, nursing home care and community care services, have different effects on informal care. Survey data from the USA showed that informal care substituted formal home care and paid domestic help (Van Houtven and Norton, Reference Van Houtven and Norton2004), and similar effects were reported by the Survey of Health, Ageing and Retirement in Europe (SHARE; Bolin et al., Reference Bolin, Lindgren and Lundborg2008; Bonsang, Reference Bonsang2009; Gannon and Davin, Reference Gannon and Davin2010). However, any substitution effect tended to disappear as the level of frailty or disability of the elderly person increased (Bonsang, Reference Bonsang2009). Similarly, Spillman and Pezzin (Reference Spillman and Pezzin2000) found that formal and informal care were complements among the severely disabled, where the specialist knowledge and skills of professionals cannot be fully replaced by informal care required.
Research is often driven by the policy-relevant hypothesis that informal care can delay or avoid care home admission or hospitalisation, and reduce the use of community services, such as home care. We take a different approach to this puzzle and investigate whether informal care utilisation is likely to have increased to fill the gap in social care services provision in England (Fernandez et al., Reference Fernandez, Snell and Wistow2013b), i.e. whether formal, mainly community care, has been replaced by informal care. Only a few studies have tested the effects of a formal LTC policy change on the utilisation of informal care. The findings generally suggest that an increase in formal LTC is complementary to informal care utilisation. For example, an increase in paid home care in the USA was shown to have been allocated mainly to people who were already receiving a greater amount of informal care from their adult children (Liu et al., Reference Liu, Manton and Aragon2000; Langa et al., Reference Langa, Chernew, Kabeto and Katz2001). Furthermore, the effects of institutional differences on the utilisation of informal and formal care were explored in the Netherlands and Germany (Bakx et al., Reference Bakx, De Meijer, Schut and Van Doorslaer2015). Interestingly, eligibility rules, level of coverage and social preferences appeared to influence higher utilisation of informal care in Germany, but higher utilisation of formal care in the Netherlands. The findings of the Japanese Longitudinal Study of Aging also suggest that there may be a system-level effect; they showed a complementary relationship between informal home care and community-based services in Japan (Chen et al., Reference Chen, Yamada, Nakashima and Chiu2017).
2.3 Demand for informal care
Demand for informal care is primarily determined by levels of frailty and disability, leading to the need for support. Need is commonly measured by a person's ability to perform ADLs, which include mobility, personal care (e.g. washing, dressing and toileting) and self-feeding (Grundy and Glaser, Reference Grundy and Glaser2000). The care intensity and duration vary significantly depending on the type of need and any co-morbidities (Karlsson et al., Reference Karlsson, Mayhew, Plumb and Rickayzen2006). Also, with the help of improved technical aids, people with quite intense care needs can be cared for at home, often with a combination of support from informal carers and formal home care services (Liu et al., Reference Liu, Manton and Aragon2000).
Individual and cultural preferences and relationships with family and friends also influence the demand and supply of informal care. Users generally prefer informal carers over formally provided care, because informal carers are trusted and are more likely to understand the needs of the user (Chappell and Blandford, Reference Chappell and Blandford1991); or, as found by Pinquart and Sörensen (Reference Pinquart and Sörensen2002), the strongest preferences can be for combined informal and formal care. The extent to which such preferences are present depends not only on individual-level factors, but also on culture, the national LTC system and the severity and duration of needs. A generous formal care system (such as in the Scandinavian countries) can weaken preferences for informal care. For example, older people in Germany have been found to prefer informal care to a larger extent than older people in the USA, where people preferred the exclusive use of informal support and combined (informal and formal) support for short-term care needs, compared with LTC needs (Mair et al., Reference Mair, Quiñones and Pasha2016).
2.4 Supply of informal care
The supply of informal care depends on a range of factors, including individual constraints, intra-household dynamics, local area characteristics and the availability of formal care provision (Van Groenou and De Boer, Reference Van Groenou and De Boer2016). Further, as nearly half of carers in England are of working age, employment status and work hours are likely to play an important role (Pickard, Reference Pickard2013).
The main factors affecting the individual's willingness to supply informal care include the relative time constraints and preferences for work time, leisure time and time spent on other care duties. We can think of informal care as introducing a further time constraint that complicates the usual trade-off between leisure and work, and that has the same opportunity cost as leisure, i.e. the wage. A higher wage, that is, a higher opportunity cost of caring, has been found to lead to a lower supply of informal care (Carmichael and Charles, Reference Carmichael and Charles2003; Spiess and Schneider, Reference Spiess and Schneider2003). The opportunity cost argument also applies to future earnings, e.g. among highly educated people. On the other hand, an individual might choose to provide care to bridge spells of unemployment, during job search or if he/she lacks the skills to obtain work (Heitmueller and Inglis, Reference Heitmueller and Inglis2007).
Further, household type is an important structural correlate of the availability of informal care (Pezzin and Schone, Reference Pezzin and Schone1999). Co-resident spouses provide a significant proportion of all informal care and for adult children providing care to a parent/parent-in-law, sharing a household means that travel costs and time can be saved (Pezzin et al., Reference Pezzin, Kemper and Reschovsky1996). However, co-residence between adult children and care users is becoming less common in England (Grundy, Reference Grundy2000). Household structure is also linked to home ownership and consequently housing wealth. Larger wealth may lead to both increased use of private formal care (the LA means test is less likely to be met) and decreased informal care, or conversely, increased informal care due to limited publicly-funded formal care. Also, the idea of intergenerational solidarity and the role of bequests are related to wealth (Bernheim et al., Reference Bernheim, Shleifer and Summers1985; Kohli, Reference Kohli1999). It has been suggested that a family functions as an informal insurance market, and that transfers within the family are motivated by factors beyond altruism and can represent exchange-type transactions among generations (Brown, Reference Brown2006).
In the growing field of cultural economics; preferences, beliefs and culture are important factors for employment and labour force participation, and can provide valuable insights for social care research. Prejudicial attitudes towards female employment stemming from traditional or cultural practices decrease female labour force participation over and above the impact of economic factors (Fernandez and Fogli, Reference Fernandez and Fogli2009; Contreras and Plaza, Reference Contreras and Plaza2010). These traditional values, which are often more common in rural locations, have been found to increase informal care supply (Ryan et al., Reference Ryan, McKenna and Slevin2011).
3. Data and methods
Our primary source of data was the two most recent English censuses, which were collected on 29 April 2001 and 27 March 2011. The census data is unique in that it collects information on informal care across the population of England and Wales.
Our main research questions were:
(1) What determines patterns of informal care in local areas in England?
(2) Has the reduction in formal social care provision in England since 2008/2009 affected informal care utilisation, and how?
Using census data has the advantage of including the entire population in the analysis, compared to commonly used survey data. Surveys have an above average non-response rate for people with severe health problems and people in a strained living situation (such as when providing intense informal care). However, the census is limited in the range of variables collected, and therefore we built a dataset using micro-level area data, which enabled us to control for a wide range of local area characteristics in our econometric models.
Our main unit of observation, Middle Layer Super Output Area (MSOA), is a small area with a minimum population of 5000 and a mean of 7200. MSOAs were defined by the Office for National Statistics for statistical purposes. MSOAs, in contrast to administrative units such as ward or council, were intended to remain reasonably stable over time. However, due to population change, the number of MSOAs increased from 6781 in 2001 to 6791 in 2011.Footnote 3 We were unable to match just under 3% of the sample in 2001 to the corresponding 2011 MSOAs, generating a balanced panel dataset of 6597 observations. The missing values were spread across LAs, so unless there were significant differences in how the LA-level withdrawal of services affected MSOAs within the LA, there should be little effect on the results of the missing MSOAs. MSOAs do not cross LA borders. There were no significant differences (in 2001 and 2011) of key variables in the 3% unmatched sample compared to the rest of the sample. When unavailable at MSOA level, data has been sourced at LA levelFootnote 4 and adjusted to MSOA level.
Our dependent variable, the proportion of people providing informal care in any given MSOA, was self-reported in the census collection. The census asked all individuals over the age of 15 to respond to the following question:
“Do you look after, or give any help or support to family members, friends, neighbours or others because of either: • long-term physical or mental ill-health/disability? • problems related to old age?”
The response options were: No, Yes, 1–19 hours a week, Yes, 20–49 hours a week, Yes, 50 or more hours a week.Footnote 5
We created four dependent variables based on the response categories of the census question which captured the intensity of the caring situation: ‘low’ (1–19 hours per week), ‘medium’ (20–49 hours per week) and ‘high’ (50+ hours per week) intensity of informal care provision and finally, the above categories combined to include all people who provided informal care. For each MSOA, the dependent variables showed the proportion of the population over the age of 15 who provided care at any number of hours and those who provided low-, medium- and high-intensity care. This allowed us to explore not only whether there had been an overall effect of the reduction of formal care, but also whether this differed depending on care intensity.
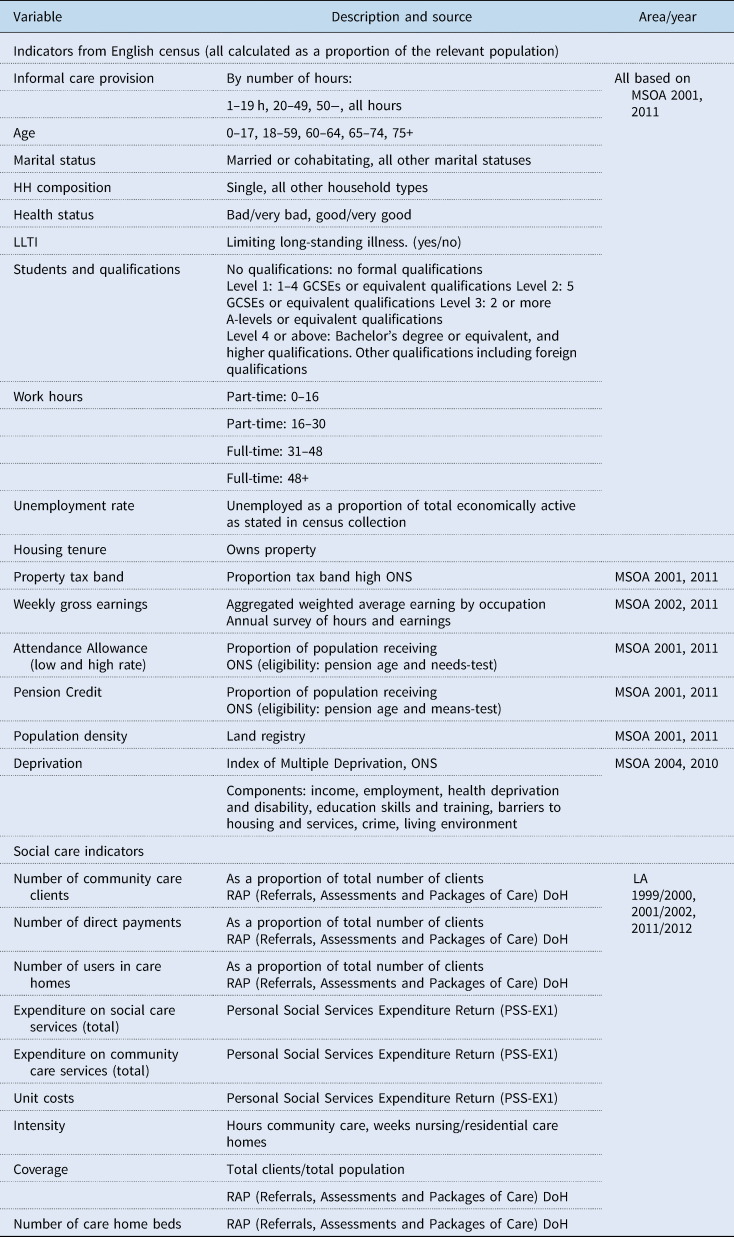
Research question (i) was explored through a range of covariates identifying demand and supply of care. Table 1 shows the sources and calculation of each variable (descriptive statistics are available in Table A1 in Appendix). To control for need, we used self-rated health status, self-identified limiting long-standing illness and the local age structure. The categories of the self-rated health variable changedFootnote 6 between the censuses and we tested the models without the variable and with different groupings of the categories without affecting the overall results. We further used benefits data [such as the proportion of the population receiving Attendance Allowance (AA)] from official statistics. The benefits data captures need through an ‘external validation’, i.e. the person satisfies a formally established needs assessment. Finally, we included the Index of Multiple Deprivation which measures relative levels of deprivation in terms of, e.g. income, employment and health in local areas in England, and correlates with broad population needs (Table 1). This set of needs-related variables correspond to those used in Relative Needs Formulae used by the government to calculate budgets and are understood to capture population need as thoroughly as possible (Vadean and Forder, Reference Vadean and Forder2018).
Sources and calculations of variables

In order to capture the local supply of informal care, we controlled for employment and earnings, work hours and education. Deprivation, as mentioned above, can also capture local area supply of care, as it includes indicators of economic activity (Grundy and Glaser, Reference Grundy and Glaser2000). A further set of variables captured the availability and access to LA-funded services. We included an indicator of the availability of nursing and residential care in each LA (calculated as the number of LA-funded nursing and residential care home beds per person over the age of 65). We also included the proportion of the relevant population receiving Pension Credit. Pension Credit is means tested and correlates to some extent with the proportion of the older population likely to be covered by formal care (Hancock et al., Reference Hancock, Morciano and Pudney2019).
All variables were entered into the regressions as the calculated percentage point change between 2001 and 2011, resulting in a cross-sectional dataset of variables ranging between −100 and +100 with N = 6597. We used a first difference (FD) model based on a two-period panel (Wooldridge, Reference Wooldridge2012).Footnote 7 We took this approach, which has the same properties as a fixed effect panel regression, to account for within observation unobserved heterogeneity, in our case at the MSOA level. These are any time-invariant MSOA-level factors, e.g. geographical or social features, which remain constant over the period. In essence, we ‘differenced away’ the constant features of each MSOA. We applied a standard OLS estimation (Table 2) and, following Wooldridge (Reference Wooldridge2012), our model can be illustrated as:

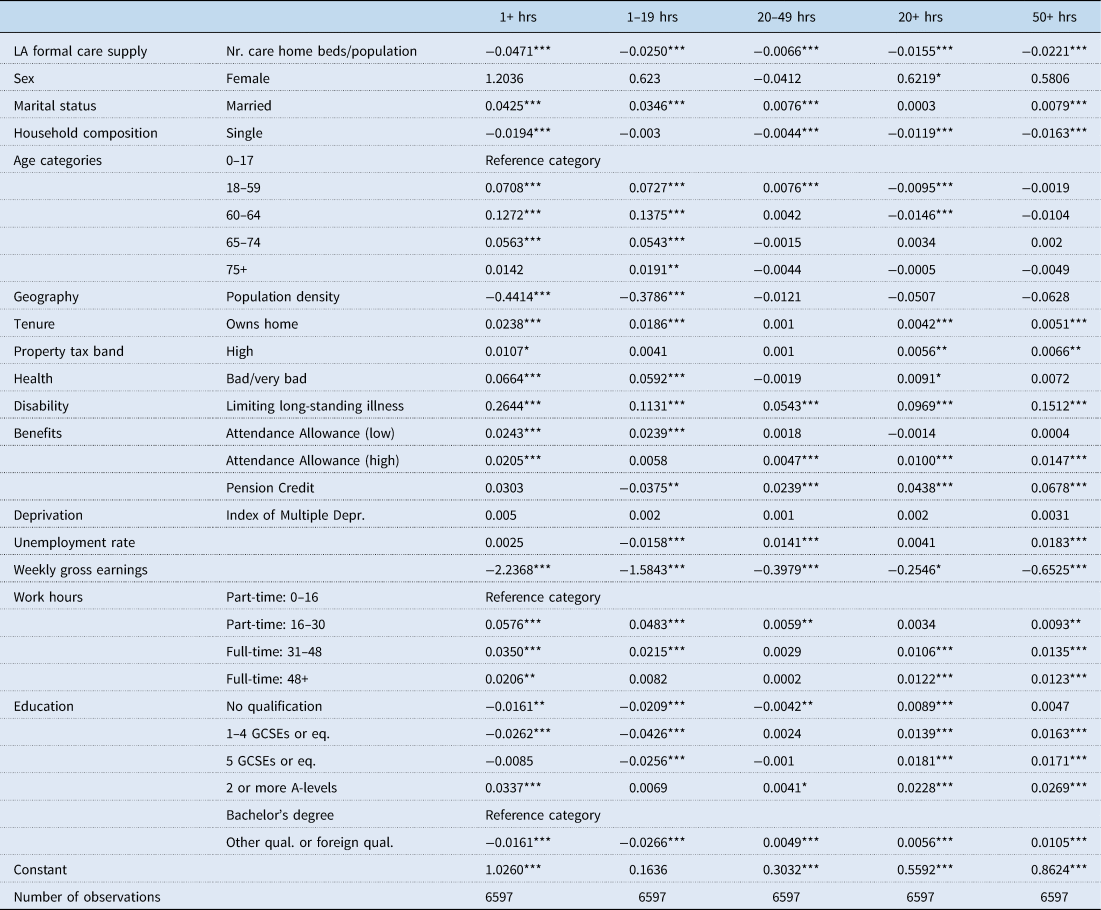
OLS regressions of socio-demographic determinants of change in informal care (2001–2011)

Our dependent variable yi is the number of informal carers as a proportion of the population; i denotes the MSOA; and Δ denotes the change in any variable from t = 2001 to t = 2011. The intercept in (1) is the change in the intercept from t = 2001 to t = 2011. x denotes a vector of socio-economic and geographical covariates (generally the proportion of the population with a certain characteristic), and Δu i the error term. Standard errors were clustered at LA level to account for correlation in the errors among MSOAs in any given LA. We noted concern over the use of OLS when the dependent variable was bounded (in our case to −100 and +100), given the possible violation of the assumption of normally distributed errors. This is mainly an issue if much of the data are close to the bounds. If all the data fall in the middle section, as in our case, and N is large, a linear model allows for testing of hypothesis also with bounded data (Srivastava, Reference Srivastava1971). We tried running our models as truncated regressions with no changes to the results.
Research question (ii): how the reduction in formal care coverage has impacted on the utilisation of informal care was analysed using IV models. Our tests confirmed the presence of endogeneity of the formal care indicator (the coverage of formal care, calculated as the proportion of the population receiving LA-funded services) which can be solved by instrumenting the relation between informal and formal care. Appropriate instruments should be: (1) correlated with the potentially endogenous variable (formal care), (2) orthogonal to the error process and (3) not directly correlated to informal care (but indirectly through formal care). Variables assumed to affect the amount of formal care received, but not directly the amount of informal care, are potential good instruments. Previous studies, which generally used individual-level data, have instrumented for informal care and not formal care, using variables influencing the availability of informal care, e.g. adult children living nearby (Bolin et al., Reference Bolin, Lindgren and Lundborg2008).
We used a set of lagged indicators of formal care provision as instruments in our models. These were indicators of pre-2001 formal care levels (not change as in the dependent and independent variables) to instrument the change in formal care between 2001 and 2011. These indicators came from the data return from English LAs (Referrals, Assessments and Packages of Care; RAP) in the year 1999/2000 (N = 147).Footnote 8 The instruments were the numbers of home care clients and day care clients as a proportion of the total number of social care clients, and the proportion of the population covered by social care in each LA. We applied a Wald test to check for overidentification of our models and for the validity of the instruments, i.e. whether there was an association between the instruments and the error term in the second equation. The test confirmed the validity of the instruments. The IV models covered a somewhat smaller sample due to missing data in the first year of the annual data collection from English LAs which started fully in 2001 (RAP; Table 1). We tested the OLS regressions (reported in Table 2) on the smaller sample used for the IV models with comparable results.
4. Results
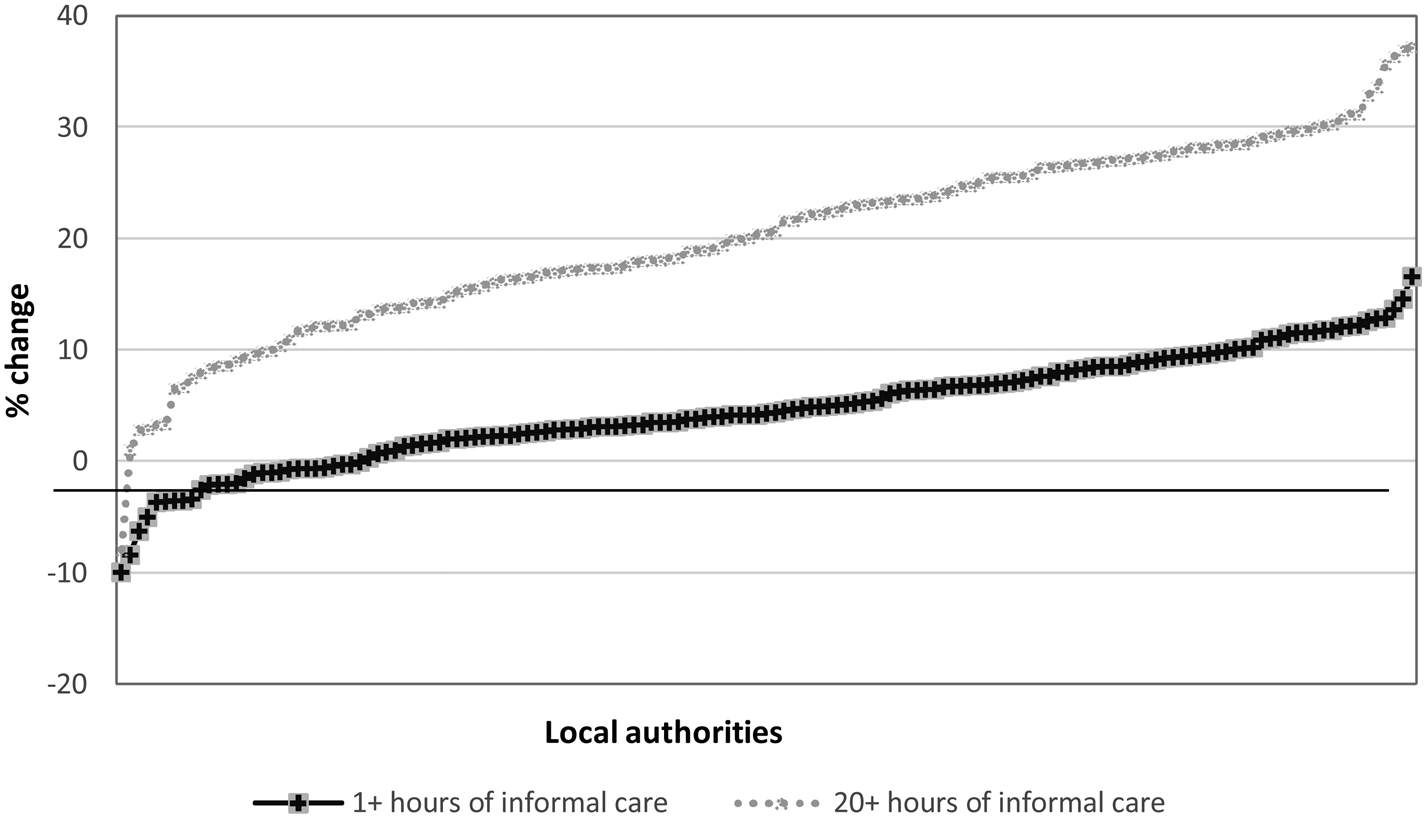
Overall, we found that informal care provision had increased between 2001 and 2011. Figure 1 shows this development at the LA level. In all but one LA (Tower Hamlets in London), the proportion of people providing informal care had increased, and the increase was markedly larger for high-intensity care. Figure 1 shows unadjusted numbers which means that the change may to some extent be explained by population ageing as well as other changes in society.
Variation across LAs in % change informal care between 2001 and 2011 censuses (any number of care hours).
Source: Census data 2001, 2011. The two lines represent the percentage point change for all informal care (i.e. 1 or more hours per week) and the change in medium to high-intensity care (20 hours or more per week), respectively. The average change in the proportion of the population providing care for each LA has been plotted, ranked from smallest to largest change. This means that the ordering of LAs along the x-axis is different for the two lines.

The results of the empirical modelling are presented in two parts: Table 2 shows the demographic and social determinants of informal care provision, and the effects of changes in these variables on changes in informal care between 2001 and 2011. We compared our area-level results to studies using micro-data, including survey data, as well as individual-level data drawn from the census (Robards et al., Reference Robards, Vlachantoni, Evandrou and Falkingham2015).Footnote 9 With our analysis being unique in the use of small area data models, it is important to ensure that our results reflect previous empirical findings from individual-level data, as well as theory. This supports the validity of our conclusions from the instrumental models shown in Table 3. Both Tables 2 and 3 report five regression models using the three key dependent variables (low, medium and high informal care intensity) and the overall effect on informal care of any intensity (1+ hours of care per week) and of medium- and high-intensity grouped together (20+ hours of care per week). The coefficients should be interpreted as in a standard linear regression, where the effect of a one percentage point change in the covariate results in a percentage point change in the dependent variable corresponding to the size of the relevant coefficient.Footnote 10
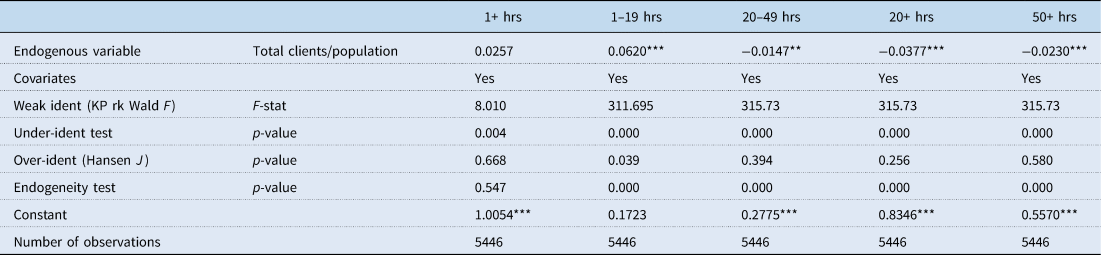
Instrumental variable regressions: effect of change in formal care on informal care (2001–2011)

Notes: Sample size is reduced due to missing data in the instruments. The sample includes 130 out of 146 LAs in the main model in Table 2.
Instruments: home care clients/total number of social care clients, day care clients/total number of social care clients, total number of clients as a proportion of the population.
Household characteristics, including gender, marital status and household composition, are known to affect informal care utilisation (Table 2). While micro-data studies have shown that women are more likely to provide care (Carmichael and Charles, Reference Carmichael and Charles2003), this is only partly reflected in our results. The positive effect of a larger proportion of women in the population on informal care utilisation was significant for high-intensity care (50+ hours), but not for lower care intensities. The effect of a larger proportion of married or cohabitating couples was increased informal care utilisation significantly, which also mirrors individual-level theory. Care between spouses is one of the most common forms of caring, along with care provided by a daughter or daughter-in-law, all of which tend to be married or live in cohabitating relationships (Hughes et al., Reference Hughes, Giobbie-Hurder, Weaver, Kubal and Henderson1999). Household composition showed a parallel dynamic; a greater proportion of single households reduced informal care utilisation, compared with households consisting of two or more people. The local age structure (the proportion of the population found in the age bands 18–59, 60–64, 65–74 and 75+, compared to the reference category 0–17 years) is related to low- relative to high-intensity informal care in the opposite way. At the low informal care intensity, the more people in older age groups leads to more informal care, but the opposite is true for high-intensity care. The local age structure captures potentially both demand (need) and supply factors determining care utilisation, which may explain the conflicting results.
The variables covering demand for informal care behaved as expected. A larger proportion of the population reporting poor health status and a higher prevalence of limiting long-standing illness predicted higher informal care utilisation. Correspondingly, the uptake of AA at the high and the low rate also had the expected positive coefficient. For high rate AA, the effect was significant for high-intensity care, and for low rate AA at low-intensity care. We observed some collinearity between the variables capturing need. Deprivation, as well as standardised mortality rates, tended to be insignificant when the self-rated health variables were included.
Changes in the supply of informal care were captured through geographic characteristics (i.e. population density), work, wages and education of carers. We found a significant negative effect of higher population density on low-intensity care provision, while the effect on high-intensity care was insignificant. Previous studies found that formal care was more common in urban areas, whereas informal care dominated in rural areas (Clark, Reference Clark1992), possibly due to weakening social networks in urban areas (Horwitz and Rosenthal, Reference Horwitz and Rosenthal1994). In rural areas, provision of formal care (primarily home care) can also be difficult due to travel distances, which may encourage informal care provision.
The MSOA unemployment rate can capture reduced opportunity cost and free time available for caring but is also linked to deprivation and hence relatively high need and demand for care. Higher unemployment rate correlated with more informal care utilisation, significant at the 20+ hours per week intensity, while the effect was negative and significant at the lower intensity (1–19 hours per week). This may be explained by the unemployment rate being calculated on the economically active population, which does not include many carers, particularly among the elderly. However, a higher proportion of full-time workers had the expected negative and significant effect on the supply of low-intensity informal care. The effect of full-time employment was not significant in the high-intensity informal care model, which may be due to the small proportion of high-intensity carers in full-time employment. The level of educational attainment had the expected effect: a high proportion of the population with lower educational attainment was positively linked to high-intensity informal care supply (20+ hours per week), whereas educational attainment at A-levels and undergraduate degree level had a positive effect on low-intensity informal care supply (1–19 hours per week).
Higher weekly gross earnings had a consistently negative relationship with informal care provision. This is in line with the opportunity cost hypothesis; high earnings reduce the likelihood of providing informal care (Lilly et al., Reference Lilly, Laporte and Coyte2007). We tried including the distribution of occupations (manager, professional, etc.) as a proxy for opportunity cost, with insignificant results. We included two variables for wealth in the models: home ownership and proportion of properties found in the highest property tax band. Both indicators were positively linked to informal care utilisation, i.e. higher level of wealth in the areas lead to more informal care utilisation. Several factors may explain these counterintuitive effects; ownership was positively correlated with older age and with cohabitation, and negatively correlated with the likelihood of meeting LA-funded care means test (i.e. more informal care is required to cover those who do not receive sufficient LA care while not being wealthy enough to privately fund the additional care needed).
Finally, the availability and access to LA-funded services were captured through pension credit uptake and supply of residential and nursing home care. The higher proportion of the population receiving Pension Credit negatively affected low-intensity and positively affected high-intensity informal care. Because state-funded social care in England is mean-tested, demand for statutory support will increase with the proportion of the population receiving Pension Credit. The effect is as expected for high-intensity informal care, as this reflects the level of need required for a user to meet the needs test's criteria for LA-funded care. The negative effect of the number of nursing and residential care home beds suggested that a higher availability of formal care significantly reduced the utilisation of informal care, regardless of informal care intensity.
Table 3 reports the results of the instrumental variable modelling of the relationship between formal and informal care. We tested a range of variables capturing LA-funded social care services.Footnote 11 The only significant effect was found for total formal care coverage, i.e. the total number of clients as a proportion of the population. This indicates a relationship between the overall LA formal care provision of services and informal care, but no relationship with the combination of services. We found that a lower formal social care coverage leads to less low-intensity care being utilised. This suggests that LA-funded services and low-intensity informal care are complements. For high-intensity care (20+ hours per week) on the other hand, a lower formal care coverage leads to more utilisation of informal care. This suggests that there was a substitution effect between high-intensity informal care and LA-funded social care, i.e. that informal care was being used instead of formal care.
The effects of covariates did not change substantially in the IV model compared to the OLS models in Table 2. The availability of nursing and residential care was negative and significant as in the OLS models. The Index of Multiple Deprivation was insignificant in the IV models, whereas in the OLS models, we found significant effects. This may be due to the fact that the Index includes indicators of economic deprivation which are likely to correlate with the proportion of the population meeting the means test for LA-funded care, and hence this effect is captured through the formal care coverage variable. Similarly, the effects of household characteristics were weaker when we controlled for the effect of formal care coverage. This indicates that the weaker determinants of informal care provision have even lower impact when substitutes (i.e. formal care) are controlled for.
5. Discussion
This paper sought to investigate the effects of the sharp reduction in formal social care funding and provision by LAs on the utilisation of informal care in England. Our approach is novel in that we used small area (MSOA) data which enabled us to fully utilise the data from the English census collection, as well as to match a large set of covariates to our dataset. The baseline model in Table 2 suggests that our data and method are robust, given that most of the well-established relationships found in the micro-data literature also hold for the small area data. Tests confirmed the endogenous relationship between informal care and the coverage of formal care and the IV models in Table 3 show significant relationships between the change in LA coverage (the proportion of the population receiving services) and the change in the provision of informal care.
Interestingly, the relationship between formal and informal care varied depending on the intensity of informal care. The effect was positive (complementary) at the low-intensity level and negative (substitutive) at the higher intensities. The former, complementary relationship at the low informal care intensity may indicate that where LA-funded social care covered a larger proportion of the population, users were receiving formal as well as informal care, and therefore informal carers reported a lower average number of hours. The substitutive effect at high-intensity informal care likely stems from the opposite dynamic. Due to intense budget cuts, LAs were forced to shift provision to cases of more severe need and, on average, low-intensity informal care had slightly contracted, while higher intensity informal care hours had increased across nearly all LAs (Figure 1). The shift may be due to new informal carers providing high-intensity care and long-term informal carers increasing the intensity of care that they provide, from low-intensity to high-intensity care, to cover for withdrawn or unavailable social care services. The latter explanation resonates with a previous study of a small sample of census respondents (carers who provided care at both 2001 and 2011) reporting that 21.3% had increased the intensity of provision, compared with 12.6% who had reduced care intensity (Robards et al., Reference Robards, Vlachantoni, Evandrou and Falkingham2015). It has been suggested that a lack of formal care induces demand for informal care to close the ‘care gap’ (Pickard, Reference Pickard2013). On the other hand, if we imagine an increase in formal care service availability, as was implemented in Scotland in 2002, our models predict that low-intensity informal care would increase, and high-intensity decrease. Indeed, this effect has been identified in Scotland (Bell et al., Reference Bell, Bowes and Heitmueller2007).
The reduction in LA-funded formal care is likely to not only have impacted on informal care utilisation as explored in our models. Social care in England can be provided and funded by a range and combination of different entities (see Section 2.1). The calibration of our LA-level variables (used in the IV models) means that we estimated what can be understood as the net effect of the change in formal care provision on informal care. A reduction in LA-funded care is likely to result in changes not only in informal care utilisation, but also in self-funded care for those who can pay privately; in addition, it also results in unmet need. Therefore, the change in informal care is only one component of the effect of a change in publicly-funded formal care. This means that our results are unlikely to overestimate the real effect and are instead likely to be underestimations. It is difficult to quantify the size of the change to self-funded formal care and unmet need, as there is little consistent data on self-funded care, and unmet need can only be estimated, for example, using survey data (Vlachantoni et al., Reference Vlachantoni, Shaw, Willis, Evandrou, Falkingham and Luff2011).
Regarding the limitations of our study, we note that using small area data requires caution when interpreting the results. The ecological inference problem (King, Reference King1997) implies that, per definition, we cannot expect any relationships identified at the group level to imply the presence of the relationships at the individual level. However, our results of the baseline model align well with the evidence of individual-level (micro-level) studies. Also, individual-level data on formal care provision is not generally available, hence most studies rely on LA-level data, as we do here. Furthermore, regression to the mean is a concern when using area-level data. A bounded variable that is at the top of the range can only decrease, and a variable at the bottom can only increase. As the majority of our data was found around the mid-point of the distribution, this is less of a concern.
Our results show that several policy-relevant variables are important for the provision of informal care. It is important to understand how population characteristics translate into informal care outcomes, especially in times of fiscal austerity. This suggests a need for further area-level research. Equally, our findings are particularly important to consider in relation to projection models (e.g. Wittenberg et al., Reference Wittenberg, Hu, Hancock, Morciano, Comas-Herrera, Malley and King2011). In conclusion, when formal care services are reduced, it is likely that informal care is utilised; however, it only covers part of the gap. This carries important implications not only for the social care system, but also for the health care system as insufficient social care provision can lead to unnecessary hospitalisation and institutionalisation.
Supplementary material
The supplementary material for this article can be found at https://doi.org/10.1017/S1744133120000146.
Acknowledgements
This research has been partly funded by the Policy Research Programme in the Department of Health from the Economics of Social and Health Care Research Unit (ESHCRU). ESHCRU is a joint collaboration between the University of York, London School of Economics and the University of Kent. The views expressed are those of the authors and may not reflect those of the funders.