Introduction
Phenotypic characterization refers to the population identification process and to the description of their characteristics and those of their production environment (FAO, 2012). The Global Action Plan for Animal Genetic Resources recognizes that “a better understanding of the characteristics of livestock breeds is necessary for guiding decision making in the development of farms and breeding programs” (FAO, 2007). In goats, the analysis of morphological traits was used in several studies for characterizing goat genetic resources (Dekhili et al., Reference Dekhili, Bounechada and Mannalah2013; Fantahun et al., Reference Fantahun, Alemayehu and Abegaz2013), differentiating populations and breeds (Herrera et al., Reference Herrera, Rodero, Gutierrez, Peňa and Rodero1996; Capote et al., Reference Capote, Delgado, Fresno, Camacho and Molina1998; Yakubu and Salako, Reference Yakubu and Salako2011; Pires et al., Reference Pires, Machado, Araújo, Olson, da Silva, Torres and da Silva Costa2012; Nafti et al., Reference Nafti, Khaldi and Haddad2014) and studying genetic distances and taxonomic trees (Machado et al., Reference Machado, Chakir and Lauvergne2000; Marichatou et al., Reference Marichatou, Karimou, Issa, Chaibou, Banoin, Yénikoye, Falke and Ayatunde2012).
The Moroccan goat livestock accounts more than 6.2 million heads and occupies the 13th position worldwide (http://faostat3.fao.org/browse/Q/QA/E). Only the goat of oases in Southern-East of Morocco, called Draa, has been considered as a breed (Hossaini-Hilali and Mouslih, Reference Hossaini-Hilali and Mouslih2002) and has been defined as a medium-sized goat with a fine and triangular head often polled (Ezzahiri et al., Reference Ezzahiri, El Maghraoui, Benlakhal and Ouchtou1989). The other populations have been classified according to their geographical site (“goat of the North”) or their dominant coat colour (“black goat” called also “R'halia”). In the last decade, some subpopulations of black goat were described on the basis of slightly different morphologies and were officially called Atlas, Barcha and Ghazzalia.
This phenotypic description remains insufficient since it was not based on a statistical analysis of morphometric traits. Such analysis will contribute to define a morphological standard and to guide the genetic improvement programs in the future. Thus, the objective of this study was to characterize the Draa breed in comparison with other local populations using a multivariate analysis of morphometric traits.
Materials and methods
Site of the study and data collection
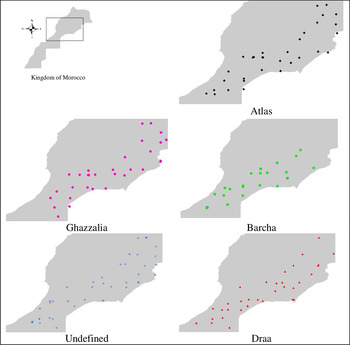
The study was carried out in the cradle zone of Draa breed (Draa valley) and in the neighbouring areas that include other goat populations in the South-eastern and Southern Morocco (Figure 1). A sampling grid covering these areas was established on the basis of geo-referenced and uniform cells of 2 500 km2. A total of 54 cells were sampled in which five adult animals were randomly selected from each of three different flocks in each cell. The gender of animals was recorded and their age was estimated from their dentition. Morphometric traits studied, as described by FAO (2011), were height at withers (HW), heart girth (HG), body length (BL), ischion circumference (IC), ear length (EL), horn length (HoL), hair length (HL) and body live weight (BW).
Sampled areas for each population located on the map of Morocco.

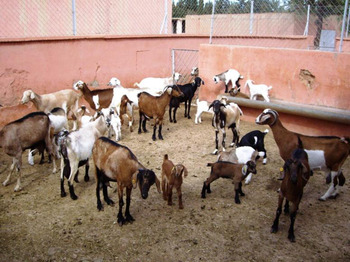
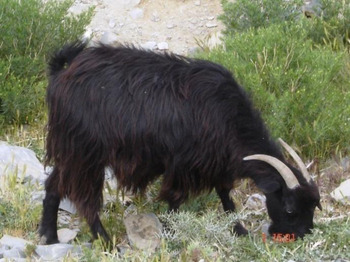
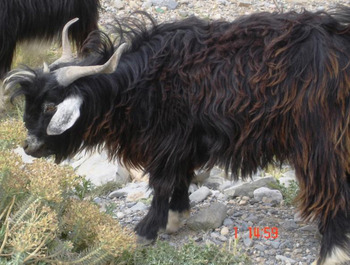
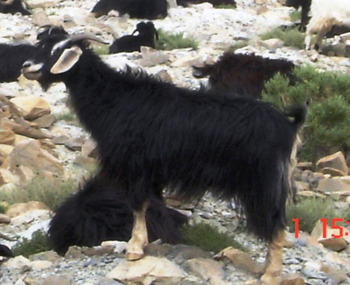
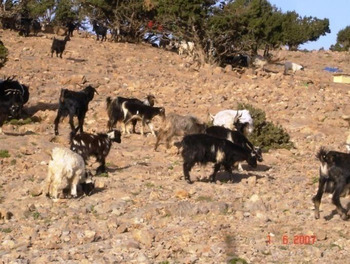
According to their dominant phenotype, the sampled animals were classified into five populations. The Draa breed has been defined and recognized as the goat of oasis area (Figure 2). The population called “Atlas” (A) was described as all black with a reddish glow (Figure 3) and the population called “Barcha” (B) is black with speckled ears and muzzle (Figure 4). The population called “Ghazzalia” (G) is also black, but scratched on the face, with ears, limbs and lower abdomen brown (Figure 5). The other phenotypes different from these were grouped as “Un-defined goats” (Figure 6). Thus, a total of 251 does and 36 bucks were sampled from Draa (85 animals), Atlas (50 animals), Barcha (31 animals), Ghazzalia (58 animals) and Un-defined goats (63 animals).
Draa does with different coat colour.

Atlas doe.

Barcha buck.

Ghazzalia doe.

Un-defined animals.

Statistical analyses
Statistical analyses were performed using SAS software, version 9.0 (Statistical Analysis System, 2002). The analysis of variance was performed using the Mixed procedure fitting a model that included the random effect of animal and the fixed effects of gender and age of animal. A canonical discriminant analysis was performed, using Candisc procedure, for determining morphometric traits most discriminating the populations. Then, the probabilities of including an individual in a population were determined using Discrim procedure based on the linear discriminant function that included the eight morphometric variables. Mahalanobis distances between studied populations were calculated (Mahalanobis, Reference Mahalanobis1936) as used in several studies (Capote et al., Reference Capote, Delgado, Fresno, Camacho and Molina1998; Jimcy et al., Reference Jimcy, Raghavan and Sujatha2011; Nafti et al., Reference Nafti, Khaldi and Haddad2014). These distances were then used to construct a dendrogram using the Unweighted Pairs Group Method Analysis.
Results
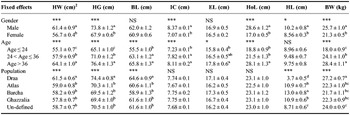
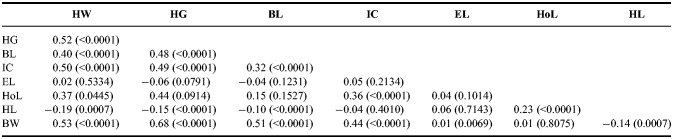
Least-squares means and standard errors for morphometric traits are presented in Table 1. Only HW, HG, BL and BW varied significantly among populations. Draa animals had the highest HW (61.5 cm), HG (74.4 cm), BL (64.6 cm) and BW (27.2 kg), as well as the shortest HL (3.74 cm) (P < 0.05). For IC, EL and HoL the measurements were similar for the five populations (P > 0.05). Except HL, all morphometric traits increased significantly with the age of animal (P < 0.05). Also, males had the highest values for HW, HG, IC, HoL, HL and BW (P < 0.05). The correlations between the studied measurements were given in Table 2. The highest correlations varying between 0.15 and 0.68 were found among HW, HG, BL, IC, HoL and BW. Correlations among the other measurements varied from −0.18 to 0.07.
Least-squares means ± standard errors of morphometric traits taken in the five populations 1 .

1 Least-squares means within a column that have a different superscript are significantly different (P < 0.05).
NS, not significant (P > 0.05), *P < 0.05, ***P < 0.001.
2 HW, height at withers; HG, heart girth; BL, body length; IC, ischion circumference; EL, ear length; HoL, horn length; HL, hair length; BW, body live weight.
Correlation matrix of morphometric traits studied with P-value between brackets 1 .

1 HW, height at withers; HG, heart girth; BL, body length; IC, ischion circumference; EL, ear length; HoL, horn length; HL, hair length; BW, body live weight.
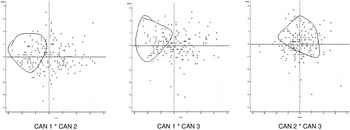
The canonical discriminant analysis allowed determining the morphometric traits most differentiating between the identified populations. Thus, three canonical variables were fitted; the first (CAN 1) included HL (0.90) and HOL (0.54), the second (CAN 2) represented HG (0.70), BL (0.56) and BW (0.55) and the third (CAN 3) included EL (0.75) and IC (0.59). The graphical representation of all animals according to these canonical variables (Figure 7) showed that Draa animals tended to be isolated according to CAN 1 *CAN 2 and CAN 1 *CAN 3 plans because of having the highest HG, BL and BW and the shortest HL. Therefore, the most differentiating morphometric traits of Draa breed were HG, BL, BW, HL, EL, IC and HoL.
Graphical representation of all individuals according to canonical variables (Draa animals are circled).

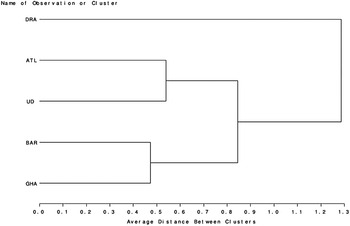
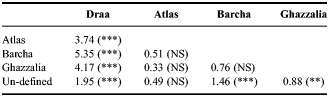
Mahalanobis distances between the five populations studied were calculated based on the eight morphological traits. These distances showed that the Draa breed had the greatest distance from the other populations (Table 3). The smallest distance of the Draa breed was from the “un-defined goats”. The dendrogram of the five populations, built on the basis of the morphometric measurements (Figure 8), showed two main clusters. The first one was formed by Atlas and “Un-defined goats” and the second one by Barcha and Ghazzalia populations. Draa breed was located far from these two clusters.
UPGMA tree based on pair-wise Mahalanobis distances of studied populations (DRA = Draa, ATL = Atlas, UD = Undefined, BAR = Barcha, GHA = Ghazzalia).

Mahalanobis distances between the studied populations on the basis of morphometric traits.

NS, not significant (P > 0.05), **P < 0.01, ***P < 0.001.
The discriminant analysis revealed that 88 individuals were misclassified in their own populations. These individuals correspond to 46.9 percent in Atlas, 38.7 percent in Barcha, 4.71 percent in Draa, 39.7 percent in Ghazzalia and 41.3 percent in Un-defined goats. Thus, the Draa breed showed the least assignment error; with only four individuals that were misclassified.
Discussion
The Draa breed was distinguished from the other populations. It had the highest HW, HG, BL and BW, as well as the shortest hair. These findings are in agreement with those already reported on the same breed (Ezzahiri et al., Reference Ezzahiri, El Maghraoui, Benlakhal and Ouchtou1989). The variability among populations may reflect some genetic differences and specific adaptation of each population to the environment conditions.
Compared with goats in the Canary Islands, from which the breed was suspected to be introduced, the Draa is less long, has almost the same HW but has a thin chest. Capote et al. (Reference Capote, Delgado, Fresno, Camacho and Molina1998) reported that measurements’ averages of Canary goats were 69.5–72.4; 66.2–71.7 and 92.6–97.1 cm, for BL, HW and HG, respectively. Moreover, Draa goats are similar to goats of Kerala in India (Jimcy et al., Reference Jimcy, Raghavan and Sujatha2011) for which HW varied from 62 to 71 cm, BL from 59 to 67 cm, HG from 67 to 75 cm and IC from 7 to 8 cm. However, it is not comparable with Andalusian goats whose morphometric measurements varied from 69 to 78, 71 to 81, 85 to 96 and 8 to 10 cm, for HW, BL, HG and IC, respectively (Herrera et al., Reference Herrera, Rodero, Gutierrez, Peňa and Rodero1996).
Moreover, morphometric traits increased with the age, reflecting the development of animals’ body with age. The same tendency was reported by Fantahun et al. (Reference Fantahun, Alemayehu and Abegaz2013). Also, there was a certain sexual dimorphism in all studied traits, except in HL. This result is in accordance with those of Birteeb et al. (Reference Birteeb, Peters, Yakubu, Adeleke and Ozoje2012) and Yadav et al. (Reference Yadav, Jain, Kulkarni, Govindaiah, Aswathnarayan and Sadana2013) who found that males had the highest value for all morphometric traits studied in Djallonke and Sahel sheep and in sheep of southern peninsular zone of India, respectively.
The most discriminating traits between the studied populations were BL, HG, HL, HoL EL and BW. These discriminating factors were almost similar to those reported in Andalusian goats (Herrera et al., Reference Herrera, Rodero, Gutierrez, Peňa and Rodero1996) and in some goat breeds from the Bench Maji area in Ethiopia (Fantahun et al., Reference Fantahun, Alemayehu and Abegaz2013). In the opposite, Nafti et al. (Reference Nafti, Khaldi and Haddad2014) found that only three morphological measurements (HL, EL and HW) were the most discriminant traits in goats of Tunisian oases.
Based on morphometric measurements, the Draa breed had the largest Mahalanobis distances to other populations. This result is consistent with Machado et al. (Reference Machado, Chakir and Lauvergne2000) who found a high genetic distance between Draa- and black-goat called “R'halia”. Likewise, Nafti et al. (Reference Nafti, Khaldi and Haddad2014) reported a highest distance between Arbi Jerid and Serti Nefzawa goats in Tunisia and attributed this result to differences in body size. In fact, phenotypic divergence between breeds/populations might be partly attributed to differences in management practices, agro-climatic conditions and biophysical resources (Yadav et al., Reference Yadav, Jain, Kulkarni, Govindaiah, Aswathnarayan and Sadana2013). Also, the different goat populations raised in Morocco appeared to bear specific adaptation, even when submitted to similar conditions and the difference between Draa- and black-goats support the hypothesis of different mechanisms of adaptation (Benjelloun et al., Reference Benjelloun, Alberto, Streeter, Boyer, Coissac, Stucki, BenBati, Ibnelbachyr, Chentouf, Bechchari, Leempoel, Alberti, Engelen, Chikhi, Clarke, Flicek, Joost, Taberlet and Pompanon2015).
The tendency showed by the canonical discriminant analysis is illustrated by the dendrogram of the five populations on the basis of morphometric measurements. Thus, Atlas is closely related to the “Un-defined” goats, and Barcha is closely related to Ghazzalia populations. The Draa breed appears to be far from these four populations. Also, fewer Draa animals were erroneously assigned, indicating homogeneity and distinctiveness of Draa breed. A similar result was found between Florida breed and Andalusia goat populations (Herrera et al., Reference Herrera, Rodero, Gutierrez, Peňa and Rodero1996).
Conclusions
The Draa goat breed is morphometrically differentiated and had the largest distances from the other local populations being raised in the neighbouring areas. This distinctiveness can contribute in defining the breed standard and in guiding the genetic improvement programs. However, it is recommended that this study be repeated in the future on a large scale and considering all different areas of Draa breed throughout the Draa valley. Also, more solid characterization tools are needed for further characterization.
Acknowledgements
The authors acknowledge the technical support of Mrs EL Mustapha Sekkour, Abdelkader Lberji, Ali Dadouch and Cherif Er-rouidi, technicians at the Experimental Station of Errachidia.