1. Introduction
The Turkana Basin of northwestern Kenya is well known for its rich Neogene–Quaternary vertebrate fauna, including one of the richest records of hominin fossils in Africa (e.g. HB Boschetto, unpub. M.Sc. thesis, Univ. Utah, 1988; Feibel et al. Reference Feibel, Brown and McDougall1989; Ducrocq et al. Reference Ducrocq, Boisserie, Tiercelin, Delmer, Garcia, Kyalo, Leakey, Marivaux, Otero, Peigné, Tassy and Lihoreau2010; Fleagle & Leakey, Reference Fleagle and Leakey2011; Fortelius et al. Reference Fortelius, Zliobaite, Kaya, Bibi, Bobe, Leakey and Werdelin2016). The Turkana Basin is also known for its long-lived sedimentary history, with fossiliferous deposits extending back into the Upper Cretaceous (Brown & McDougall, Reference Brown and McDougall2011; O’Connor et al. Reference O’Connor, Sertich and Manthi2011). Interest in the petroleum geology of the East African Rift basins has been stimulated through discoveries of commercial quantities of hydrocarbons in the Neogene of the Lokichar area of the Turkana Basin (Ngamia-1 discovery well drilled 2008; Purcell, Reference Purcell2014), as well as similar major discoveries in the Neogene deposits of the Albertine Rift in Uganda (Fig. 1) a few years earlier (e.g. Neumaier et al. Reference Neumaier, Tiercelin, Nalpas and Castillo2014; Purcell, Reference Purcell2014). The economic significance of such discoveries has led to a regional renewal of interest in and exploration for hydrocarbons in Mesozoic and Cenozoic (Oligocene–Miocene) basins throughout eastern and central Africa (e.g. Genik, Reference Genik1993; Morley et al. Reference Morley, Karanja, Wescott, Stone, Harper, Wigger, Day and Morley1999; Wescott et al. Reference Wescott, Wigger, Stone, Morley and Morley1999; Tiercelin et al. Reference Tiercelin, Potdevin, Morley, Talbot, Bellon, Rio, Le Gall and Vétel2004, Reference Tiercelin, Potdevin, Thuo, Abdelfettah, Schuster, Bourquin and Ruffet2012a, b; G Muia, unpub. Ph.D. thesis, Univ. Rennes 1, 2015; Tullow Oil plc, unpub. presentation, 2017 half year results).
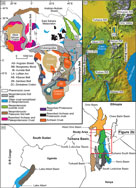
Location and geological map of the Turkana Basin showing sample locations for the Lapur and Muruanachok sandstones. (a) Generalized basement map of Africa showing the main cratonic blocks and mobile belts (map modified from Begg et al. Reference Begg, Griffin, Natapov, O’Reilly, Grand, O’Neill, Hronsky, Poudjom, Swain, Deen and Bowden2009 and Foster et al. Reference Foster, Goscombe, Newstead, Mapani, Mueller, Gregory and Muvangua2015). (b) EARS showing the various rifts/basins in the region (Landsat image taken from the NASA Shuttle Radar Topography Mission collection and modified after Roberts et al. Reference Roberts, Stevens, O’Connor, Dirks, Gottfried, Clyde, Armstrong, Kemp and Hemming2012). (c) Location of the Kenya Rift (Turkana Basin) showing some of the sub-basins within area (map modified after Tullow Oil plc, unpub. presentation, 2017 half year results).

The Turkana Basin is located within the Turkana Depression between the Ethiopian and Kenyan domes, and is generally associated with the formation of the East African Rift System (Dunkelman et al. Reference Dunkelman, Rosendahl and Karson1989; Chorowicz, Reference Chorowicz2005; Purcell, Reference Purcell2017). The Turkana Basin is one of several N–S-trending rift basins within the Kenya Rift (Tiercelin et al. Reference Tiercelin, Potdevin, Morley, Talbot, Bellon, Rio, Le Gall and Vétel2004, Reference Tiercelin, Potdevin, Thuo, Abdelfettah, Schuster, Bourquin and Ruffet2012a, b; Purcell, Reference Purcell2017). The complexity of the structures and stratigraphic framework within the basin has led to many challenges and uncertainties with subdivision and correlation of different sedimentary units (Bosworth, Reference Bosworth1992; Figs 1, 2). However, many workers have attempted to describe these sedimentary deposits (e.g. Murray-Hughes, Reference Murray-Hughes1933; Arambourg, Reference Arambourg1943). The entire lower sedimentary succession in the basin overlying the Precambrian basement rocks has previously been collectively called the ‘Turkana Grits’, and they are generally assumed to be Cretaceous in age based primarily on the presence of isolated dinosaur, crocodyliform and other vertebrate fossil remains (Murray-Hughes, Reference Murray-Hughes1933; Tiercelin et al. Reference Tiercelin, Potdevin, Morley, Talbot, Bellon, Rio, Le Gall and Vétel2004; O’Connor et al. Reference O’Connor, Sertich and Manthi2011; Figs 2a, 3). The term ‘Turkana Grits’ has previously been used as a ‘catch-all’ phrase for any outcrop of pre-Miocene, fluvial-dominated, coarse-grained sandstone in the Turkana Basin/Anza Rift (e.g. Wescott et al. Reference Wescott, Morley and Karanja1993; P Thuo, unpub. Ph.D. thesis, Univ. Western Brittany, 2009). The age and stratigraphic relationships of the different units within the ‘Turkana Grits’ are poorly understood, and they are assumed to be primarily Cretaceous in age, although considerable uncertainty still exists (Bellieni et al. Reference Bellieni, Visentin, Zanettin, Piccirillo, Di Brozolo and Rita1981; Zanettin et al. Reference Zanettin, Visentin, Bellieni, Piccirillo, Rita, Popoff and Tiercelin1983; Morley et al. Reference Morley, Wescott, Stone, Harper, Wigger and Karanja1992; McDougall & Brown, Reference McDougall and Brown2009; O’Connor et al. Reference O’Connor, Sertich and Manthi2011). The rift systems from central Sudan through to southern Kenya are believed to be the same, and oil production from southern Sudan has primed the Turkana region for exploration (Bosworth, Reference Bosworth1992; P Thuo, unpub. Ph.D. thesis, Univ. Western Brittany, 2009). A refined age and provenance for the ‘Turkana Grits’ could significantly improve exploration efforts in the area. The two most prominent sub-aerially exposed, and presumed laterally equivalent, units of the ‘Turkana Grits’ are the Lapur and the Muruanachok sandstones, and together they form the focus of this study.
(a) Stratigraphic chart of the Turkana Grits showing some of the units previously lumped together. Stratigraphic chart was modified from Tiercelin et al. (Reference Tiercelin, Potdevin, Morley, Talbot, Bellon, Rio, Le Gall and Vétel2004, Reference Tiercelin, Potdevin, Thuo, Abdelfettah, Schuster, Bourquin and Ruffet2012a and references therein). (b) Geological map of the Turkana Basin showing sample areas (map modified from Ministry of Energy and Regional Development of Kenya, Geological Map, 1987).

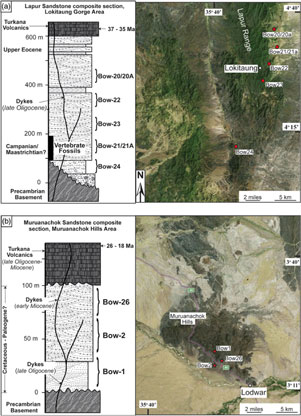
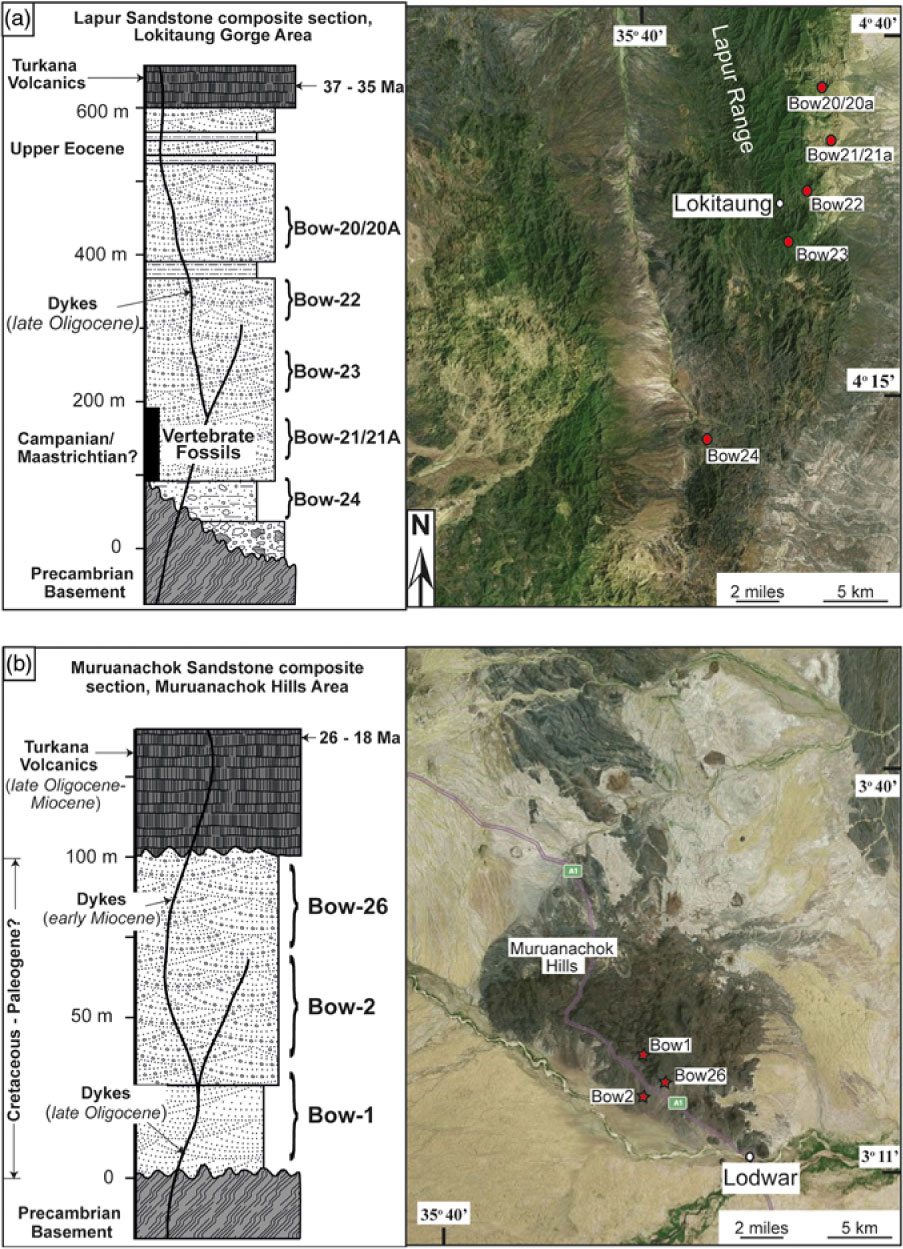
Simplified stratigraphy and aerial view of portions of the Kenya Rift within the Turkana Basin showing sample locations of (a) Lapur Sandstone (n = 7), and (b) Muruanachok Sandstone (n = 3). (Aerial maps taken and modified from Bing maps – Earthstar Geographics SIO, © 2017).
The aim of this study is to constrain the age and sediment provenance of the Lapur and Muruanachok sandstones using framework petrography coupled with U–Pb geochronology, Lu–Hf isotope analysis and trace-element geochemistry on detrital zircons from ten stratigraphically and spatially arrayed outcrop samples of these two units. This multifaceted provenance approach is expected to improve the stratigraphic control, enhance our understanding of the depositional history of the Turkana Grits and its palaeofauna, and elucidate the tectonic evolution of the Turkana Basin. Furthermore, the composite data generated by this study is expected to help test recent hypotheses regarding the initiation of and tectonic control on large-scale drainage patterns in central Africa during Late Jurassic–Cretaceous times (Stankiewicz & de Wit, Reference Stankiewicz and de Wit2006; Roberts et al. Reference Roberts, Stevens, O’Connor, Dirks, Gottfried, Clyde, Armstrong, Kemp and Hemming2012), and perhaps even during the initiation of the East African Rift System.
2. Geologic setting and stratigraphy of the Turkana Basin
2.a. Geologic setting
The study area is located in northwestern Kenya within the Turkana Basin (Omo–Turkana Basin). The Turkana Basin covers an area of 131,000 km2 of northern Kenya and southern Ethiopia, with a mean elevation of ∼400 m above sea level. It is bordered by the Omo basins of Ethiopia to the north, the North Lokichar Basin to the west and the Kerio Basin to the east (Baker et al. Reference Baker, Mohr and Williams1972; Feibel, Reference Feibel2011; Tullow Oil plc, unpub. presentation, 2017 half year results; Fig. 1). The structural and tectonic association of the Turkana Basin to the East African Rift or Central African Rift systems is still unresolved, as some researchers consider it to be part of the East African Rift System (e.g. Wolfenden et al. Reference Wolfenden, Ebinger, Yirgu, Deino and Ayalew2004; Chorowicz, Reference Chorowicz2005; Nutz et al. Reference Nutz, Schuster, Boës and Rubino2017), whereas others (e.g. Browne & Fairhead, Reference Browne and Fairhead1983; Reeves et al. Reference Reeves, Karanja and Macleod1987) view it as part of the Central African Rift System. The Mesozoic component of the Turkana region is generally considered to be derived from the Central African Rift System (e.g. Anza Rift), which was later overprinted by the Cenozoic East African Rift System, although the complexities of these two rift systems suggest their ages may overlap (see Bosworth, Reference Bosworth1992 for discussion). Many workers have also highlighted the complex interactions between the Mesozoic and Cenozoic rift systems of the Turkana region, including the long-lived structural weakness (e.g. Bosworth, Reference Bosworth1992; Le Gall et al. Reference Le Gall, Vétel and Morley2005), and the presence of Mesozoic, Palaeogene and Neogene strata filling the basin attests to this. However, the tectonic characterization of the Turkana Basin is beyond the scope of this work. In this study the Turkana Basin is considered to be part of the East African Rift System.
The East African Rift System is divided into the eastern and western branches that together stretch from the Red Sea to Mozambique (Baker et al. Reference Baker, Mohr and Williams1972; McConnell, Reference McConnell1972). Rifting in the eastern branch has traditionally been thought to have initiated much earlier than in the western branch (Chorowicz, Reference Chorowicz2005). The earliest evidence of plume-related volcanism in the East African Rift System, which is heralded as the precursor to rifting, is recorded in the eastern branch in the Kenya Rift (Turkana Basin: Fig. 1) at ∼45 Ma (Morley et al. Reference Morley, Wescott, Stone, Harper, Wigger and Karanja1992; Ebinger & Sleep, Reference Ebinger and Sleep1998). However, recent findings from the Rukwa Rift Basin within the western branch suggest that rift initiation may actually have been nearly synchronous between the two branches (Roberts et al. Reference Roberts, Stevens, O’Connor, Dirks, Gottfried, Clyde, Armstrong, Kemp and Hemming2012). Updated thermochronology of the Malawi and Albert rift flanks (Bauer et al. Reference Bauer, Karl, Glasmacher, Nagudi, Schumann and Mroszewski2012; Mortimer et al. Reference Mortimer, Kirstein, Stuart and Strecker2016; Fig. 1) and new geochronologic data from the Kivu Rift (Pouclet et al. Reference Pouclet, Bellon and Bram2016) also provide additional support for more synchronous volcanism, rifting and uplift between the two branches.
2.b. Stratigraphy of the Turkana Basin
The Turkana Basin is floored by Precambrian and Palaeozoic gneisses of the Mozambique Belt (e.g. Feibel, Reference Feibel2011) and filled by up to 7 km of Cretaceous fluvial sandstones, overlain by Oligocene–Miocene volcaniclastic fluvial–lacustrine strata and capped by Pliocene to Holocene alluvial and lacustrine deposits (Williamson & Savage, Reference Williamson, Savage, Frostick, Renaut, Reid and Tiercelin1986; HB Boschetto, unpub. M.Sc. thesis, Univ. Utah, 1988; Feibel, Reference Feibel2011; Fig. 2). The Mozambique Belt (Fig. 1a) is characterized by exposed supracrustal rocks in northern Kenya and crustal granulite-facies rocks in southern Kenya and Tanzania (Cutten et al. Reference Cutten, Johnson and De Waele2006). Two distinct domains have been identified within the Mozambique Belt, which have been called the Western Mozambique Belt with bedrock ages of between 2970 Ma and 1870 Ma, and the Eastern Granulites with metamorphic ages of between 841 Ma and 632 Ma (Cutten et al. Reference Cutten, Johnson and De Waele2006). The geologic and tectonic evolution of this belt is discussed by Mosley (Reference Mosley1993) and others (Holmes, Reference Holmes1951; Key et al. Reference Key, Charsley, Hackman, Wilkinson and Rundle1989; Kröner, Reference Kröner2001; Grantham et al. Reference Grantham, Maboko, Eglington, Yoshida, Windley and Dasgupta2003; Kröner & Stern, Reference Kröner and Stern2004 and references therein).
Prior to the characterization of the different lithostratigraphic units in the Turkana Basin by Walsh & Dodson (Reference Walsh and Dodson1969), Williamson & Savage (Reference Williamson, Savage, Frostick, Renaut, Reid and Tiercelin1986), HB Boschetto (unpub. M.Sc. thesis, Univ. Utah, 1988) and others, all clastic deposits in the Kenya Rift were collectively referred to as the ‘Turkana Grits’ by Murray-Hughes (Reference Murray-Hughes1933). Detailed discussion on the ‘Turkana Grits’ can be found in Williamson & Savage (Reference Williamson, Savage, Frostick, Renaut, Reid and Tiercelin1986), HB Boschetto (unpub. M.Sc. thesis, Univ. Utah, 1988), Boschetto et al. (Reference Boschetto, Brown and McDougall1992), Morley et al. (Reference Morley, Wescott, Stone, Harper, Wigger and Karanja1992), Wescott et al. (Reference Wescott, Morley and Karanja1993), P Thuo (unpub. Ph.D. thesis, Univ. Western Brittany, 2009) and G Muia (unpub. Ph.D. thesis, Univ. Rennes 1, 2015). The age of the ‘Turkana Grits’ was originally considered to be Oligocene to Miocene based on the presence of the fossil wood genus Dryoxylon (Murray-Hughes, Reference Murray-Hughes1933), until Arambourg (Reference Arambourg1943) reinterpreted the fossilized ‘wood-bearing sediments’ as most likely Eocene and/or Cretaceous in age (also see HB Boschetto, unpub. M.Sc. thesis, Univ. Utah, 1988). Arambourg (Reference Arambourg1943) proposed two distinct episodes of sedimentation in the Turkana Basin, characterized by a basal Mesozoic event and an overlying Miocene event (Williamson & Savage, Reference Williamson, Savage, Frostick, Renaut, Reid and Tiercelin1986).
Subsequently, Williamson & Savage (Reference Williamson, Savage, Frostick, Renaut, Reid and Tiercelin1986) defined four major lithostratigraphic units in the Turkana Basin (see HB Boschetto, unpub. M.Sc. thesis, Univ. Utah, 1988), which include: (1) the Precambrian and Palaeozoic gneisses of the Mozambique Belt; (2) a thick sequence of coarse, immature clastic sedimentary rocks, named the ‘Turkana Grits’ or Laburr (Lapur) Series (Arambourg, Reference Arambourg1935); (3) a sequence of Oligocene through Miocene volcanic and interbedded sedimentary rocks; and (4) a thick, heterogeneous assemblage of Pliocene–Pleistocene volcanic and sedimentary rocks (HB Boschetto, unpub. M.Sc. thesis, Univ. Utah, 1988). Subsequent authors have since subdivided the clastic sequences of the ‘Turkana Grits’ into several distinct lithostratigraphic units, including the Sera Iltomia Formation (Mount Porr), Kajong Formation (Loriu), Kimwarer Formation, and Lapur and Muruanachok sandstones (e.g. Tiercelin et al. Reference Tiercelin, Potdevin, Morley, Talbot, Bellon, Rio, Le Gall and Vétel2004; G Muia, unpub. Ph.D. thesis, Univ. Rennes 1, 2015; Fig. 2a). The stratigraphic relationships between each of these units are poorly understood and, in many cases, these units are assumed to be lateral equivalents to one another in different parts of the basin. Complex faulting and the presence of younger volcanic and sedimentary cover across much of the basin make precise stratigraphic and temporal correlations difficult. In general, however, the lower part of the coarse-grained portion of the ‘Turkana Grits’ rests nonconformably on basement rocks and is variably overlain by upper Miocene volcanic and sedimentary units. The key exception to this is in the Lapur Range (Fig. 2b) where significantly older Oligocene basalts overlie and, in some cases, appear to interfinger with the presumed Cretaceous-age Lapur and Muruanachok sandstones of the ‘Turkana Grits’ (Walsh & Dodson, Reference Walsh and Dodson1969; HB Boschetto, unpub. M.Sc. thesis, Univ. Utah, 1988; Tiercelin et al. Reference Tiercelin, Potdevin, Thuo, Abdelfettah, Schuster, Bourquin and Ruffet2012a).
2.b.1. Stratigraphy of the Lapur and Muruanachok sandstones
The Lapur Sandstone is a quartzo-feldspathic sandstone-dominated unit characterized by abundant metamorphic and sedimentary rock fragments (G Muia, unpub. Ph.D. thesis, Univ. Rennes 1, 2015). The Lapur Sandstone is composed of pebbly sandstones with clast- to matrix-supported conglomerates interbedded with thin mudstone and fine-grained sandstone horizons (Miall, Reference Miall1996; P Thuo, unpub. Ph.D. thesis, Univ. Western Brittany, 2009). This distinctive unit of the ‘Turkana Grits’ is located on the northwestern side of Lake Turkana and extends over 60 km in length along the Lapur Range (Figs 2b, 3a). The lower beds of the Lapur Sandstone are affected by N–S-oriented minor faulting (Tiercelin et al. Reference Tiercelin, Potdevin, Thuo, Abdelfettah, Schuster, Bourquin and Ruffet2012a). Volcanic sills and dyke intrusions of late Oligocene age (Fig. 3a) are common within the upper and middle beds of the Lapur Sandstone, a situation that is attributed to a major phase of volcanic activity in the region (P Thuo, unpub. Ph.D. thesis, Univ. Western Brittany, 2009; Tiercelin et al. Reference Tiercelin, Potdevin, Thuo, Abdelfettah, Schuster, Bourquin and Ruffet2012a). The Lapur Sandstone has variously been interpreted as being between Cretaceous and Eocene in age (Morley et al. Reference Morley, Wescott, Stone, Harper, Wigger and Karanja1992; McDougall & Brown, Reference McDougall and Brown2009; O’Connor et al. Reference O’Connor, Sertich and Manthi2011). The upper beds can be no younger than upper Eocene based on dating of the overlying rhyolitic and basaltic lavas called the Turkana Volcanics, which are dated to between 37 Ma and 29 Ma (Bellieni et al. Reference Bellieni, Visentin, Zanettin, Piccirillo, Di Brozolo and Rita1981; Zanettin et al. Reference Zanettin, Visentin, Bellieni, Piccirillo, Rita, Popoff and Tiercelin1983). In contrast, the age of the lower to middle portion of the stratigraphy has been assumed to be Lower or ‘middle’ Cretaceous (Bosworth & Morley, Reference Bosworth and Morley1994). Palynological evidence supports a Campanian–Maastrichtian age, and fossil indicators of nearshore marine vertebrates (e.g. dyrosaurids, mosasaurs) correlated with proposed marine incursions in the Anza Rift Basin in Campanian and Maastrichtian times (Bosworth & Morley, Reference Bosworth and Morley1994) are consistent with recent fossil discoveries also suggesting that these beds are Turonian–lower Campanian (O’Connor et al. Reference O’Connor, Sertich and Manthi2011). The depositional environments associated with the Lapur Sandstone have typically been interpreted as fluvial based on the facies and fragmentary nature of the fossils found within it (Walsh & Dodson, Reference Walsh and Dodson1969). Palaeocurrent directions are variable but generally indicate a northerly transport direction (e.g. Wescott et al. Reference Wescott, Morley and Karanja1993; P Thuo, unpub. Ph.D. thesis, Univ. Western Brittany, 2009). Two main palaeoflow directions are inferred for the Lapur Sandstone based on palaeocurrent analysis, which indicates WNW to NE flow for the lower and upper parts and S to WSW for the middle part of the unit (McGuire et al. Reference McGuire, Serra and Day1985; Wescott et al. Reference Wescott, Morley and Karanja1993; Sertich et al. Reference Sertich, Manthi, Sampson, Loewen and Getty2006).
The Muruanachok Sandstone crops out in isolated hills and gullies in the Muruanachok Hills c. 45 km northwest of Lodwar town (Figs 2b, 3b). The Muruanachok Sandstone is estimated at between 100 and 350 m thick, and is composed of coarse-grained sandstones interbedded with minor red-brown siltstones and shales. The petrography of this unit is characterized as quartzo-feldspathic, and the unit has traditionally been considered a lateral equivalent of the Lapur Sandstone (e.g. P Thuo, unpub. Ph.D. thesis, Univ. Western Brittany, 2009). The Muruanachok Sandstone is intruded by late Miocene dykes and unconformably overlain by the late Oligocene to Miocene Turkana Volcanics (Figs 2a, 3b; Morley et al. Reference Morley, Wescott, Stone, Harper, Wigger and Karanja1992; G Muia, unpub. Ph.D. thesis, Univ. Rennes 1, 2015). The age of the Muruanachok Sandstone is variously estimated as between Cretaceous and Paleocene, although the top of the sandstone has also been considered to be as young as upper Oligocene – lower Miocene (P Thuo, unpub. Ph.D. thesis, Univ. Western Brittany, 2009). Regardless, the top of the Muruanachok Sandstone can be no younger than 25.5–18.5 Ma, based on dating of overlying volcanic rocks in the Muruanachok area (McGuire et al. Reference McGuire, Serra and Day1985; Figs 2b, 3b). Palaeocurrent directions for the Muruanachok Sandstone are towards the NNW based on measurements on trough-cross bedding within it (McGuire et al. Reference McGuire, Serra and Day1985; P Thuo, unpub. Ph.D. thesis, Univ. Western Brittany, 2009).
2.b.2. Palaeontology of the Lapur sandstone
Vertebrate fossils were first recorded in the Lapur Sandstone following the discovery of an isolated sauropod dinosaur humerus in 1968 by FH Brown and GG Eck while in transit to the lower Omo Valley (Fig. 1b; Arambourg & Wolff, Reference Arambourg and Wolff1969). A subsequent palaeontological expedition to the region in 1985 succeeded in locating abundant, but isolated, vertebrate remains that included dinosaurs and other archosaurs. Though never formally described, notes from the expedition were widely reported (e.g. Jacobs et al. Reference Jacobs, Winkler and Gomani1996; Weishampel et al. Reference Weishampel, Barrett, Coria, Le Loeuff, Xing, Xijin, Sahni, Gomani, Noto, Weishampel, Dodson and Osmolska2004). These expedition notes described fauna that included theropod and sauropod dinosaurs, and resulted in tentative temporal assessments ranging from Jurassic through Cretaceous (Williamson & Savage, Reference Williamson, Savage, Frostick, Renaut, Reid and Tiercelin1986; Weishampel et al. Reference Weishampel, Barrett, Coria, Le Loeuff, Xing, Xijin, Sahni, Gomani, Noto, Weishampel, Dodson and Osmolska2004). In particular, the report of a possible spinosaurid theropod dinosaur suggested a ‘middle’ Cretaceous age for the deposits, an interval biostratigraphically consistent with assemblages from other northern African and South American localities (e.g. Sereno et al. Reference Sereno, Beck, Dutheil, Gado, Larsson, Lyon, Marcot, Rauhut, Sadleir, Sidor and Varricchio1998; Amiot et al. Reference Amiot, Buffetaut, Lécuyer, Wang, Boudad, Ding, Fourel, Hutt, Martineau, Medeiros and Mo2010).
More recent palaeontological exploration of the Lapur Sandstone has recovered significant, though mostly fragmentary, vertebrate remains. These collections, housed at the National Museums of Kenya in Nairobi and the Turkana Basin Institute (TBI)-Turkwel, Kenya, consist entirely of large-bodied vertebrates including dinosaurs, crocodyliforms and turtles. Despite largely fluvial deposition of the Lapur Sandstone, several recovered taxa are consistent with marginal marine settings, including an isolated vertebra originally attributed to a pterodactyloid pterosaur (O’Connor et al. Reference O’Connor, Sertich and Manthi2011) but later re-identified as the caudal vertebra of a mosasaur (Averianov, Reference Averianov2014), and abundant remains of dyrosaurid crocodyliforms. Several marine incursions into the Anza Rift system, notably in Cenomanian and Maastrichtian times (Bosworth & Morley, Reference Bosworth and Morley1994), could explain the presence of estuarine/marine vertebrate taxa within the fluvial Lapur Sandstone. Dyrosaurid crocodyliforms are currently known only from Maastrichtian–Eocene deposits (Jouve et al. Reference Jouve, Bouya and Amaghzaz2008; Hastings et al. Reference Hastings, Bloch and Jaramillo2011), providing weak biostratigraphic support for a Maastrichtian age for the Lapur assemblage.
The Cretaceous-aged vertebrate fossils of the Lapur Sandstone are exclusively located in the lower 200 m of the section exposed around Lokitaung Gorge (Figs 2b, 3a). The high-energy, coarse-grained sandstones and conglomerates typical of the Lapur Sandstone sequence produce a taphonomic bias towards large and robust fossil remains. Among the most common vertebrate fossils recovered from the Lapur Sandstone include large sauropod dinosaur limb bones and caudal vertebrae. More delicate remains, including thin vertebrae and cranial elements, are fragmentary and heavily abraded by transport in a coarse fluvial system. Microvertebrate remains, including teeth and small bones, are virtually absent from collections despite intensive surveys by one of the authors (JS). This bias may explain the absence of small to medium vertebrates typical of most early Palaeogene assemblages in the upper horizons of the Lapur Sandstone, and possibly the Muruanachok Sandstone.
3. Sampling and analytical methods
3.a. Sampling
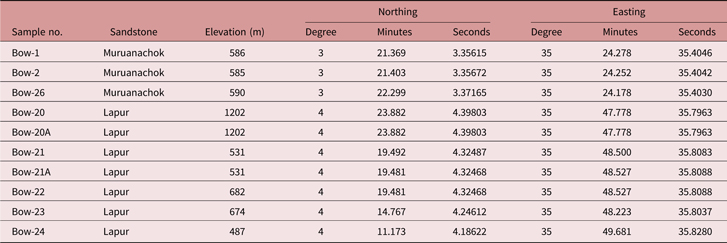
The ‘Turkana Grits’ in the Lapur Range and the Muruanachok Hills were investigated as part of a hydrocarbon exploration programme in Block 11b conducted by Adamantine Energy Limited and Bowleven plc during March 2014. Mapping was focused on identification of lithologic units and key geologic structures and their relationships. Lithologic and sedimentologic characterization was carried out for both the Lapur and Muruanachok sandstones in an attempt to date and correlate the different stratigraphic units (Figs 2a, 3). Detailed stratigraphic logs and palaeocurrent data for the Lapur and Muruanachok sandstones are presented in P Thuo (unpub. Ph.D. thesis, Univ. Western Brittany, 2009), Tiercelin et al. (Reference Tiercelin, Potdevin, Thuo, Abdelfettah, Schuster, Bourquin and Ruffet2012a) and G Muia (unpub. Ph.D. thesis, Univ. Rennes 1, 2015), and are referenced in this study. Sampling was extensive and attempted to represent all major lithologies and sedimentary facies of both the Lapur and Muruanachok sandstones. To determine the sedimentary provenance of the Lapur and Muruanachok sandstones, hand samples typically weighing 2–2.5 kg each were collected from the Lapur (n = 7) and Muruanachok (n = 3) sandstones for sandstone petrography and U–Pb geochronology, Lu–Hf isotope analysis and trace-element analysis of detrital zircons. Sample location details are presented in Table 1 and plotted in Figures 2b and 3.
Location details of Lapur and Muruanachok sandstone samples from the Turkana Basin

3.b. Analytical methods
Provenance analysis of sedimentary units like the Lapur and Muruanachok sandstones is considered an effective method of understanding basin kinematics, mountain building systems and the tectonic evolution of orogens (e.g. Jorge et al. Reference Jorge, Fernandes, Rodrigues, Pereira and Oliveira2013). An integrated approach rather than a single method to sedimentary provenance can provide comprehensive information on source characteristics, which enhances tracing sediments to their sources (Morton et al. Reference Morton, Ellis, Fanning, Jolly, Whitham, Rasbury, Hemming and Riggs2012; Jian et al. Reference Jian, Guan, Zhang, Zhang, Feng, Liu and Lin2013). Detrital minerals such as zircons in sedimentary rocks can provide useful information on the genesis, transport and deposition of such rocks (e.g. Oliveira et al. Reference Oliveira, McNaughton, Windley, Carvalho and Nascimento2015). The ubiquitous and refractory nature of zircon is particularly useful as the uranium stored in its crystal structure makes it advantageous for obtaining the age of source rocks in addition to acquiring geologic information on unknown magmatic or metamorphic events (Carrapa, Reference Carrapa2010; Cawood et al. Reference Cawood, Hawkesworth and Dhuime2012). In situ Lu–Hf isotopic data from zircons can also provide additional information about the crustal evolution of the zircon sources to complement the U–Pb geochronology data (Corfu & Noble, Reference Corfu and Noble1992; Griffin et al. Reference Griffin, Belousova, Shee, Pearson and O’Reilly2004; Zheng et al. Reference Zheng, Zhang, Zhao, Wu, Li, Li and Wu2007).
3.b.1. Sedimentology and sandstone petrography
Macroscopic observations on hand specimens and microscopic studies on thin-sections were performed at James Cook University, Townsville, Australia. This was done in an attempt to infer the parent rock characteristics of the ‘Turkana Grits’ (e.g. Dickinson & Suczek, Reference Dickinson and Suczek1979; Dickinson et al. Reference Dickinson, Beard, Brakenridge, Erjavec, Ferguson, Inman, Lindberg and Ryberg1983). Ten thin-sections prepared to the standard thickness of 30 μm and impregnated with blue-dyed epoxy resin to highlight porosity were point-counted following the Gazzi-Dickinson method (Ingersoll et al. Reference Ingersoll, Bullard, Ford, Grimm, Pickle and Sares1984). The sandstone point-counts consisted of 350 points per sample, which were used to estimate the compositional percentages of quartz (Q), feldspar (F) and lithic (L) grain fragments (Ingersoll et al. Reference Ingersoll, Bullard, Ford, Grimm, Pickle and Sares1984; Dickinson, Reference Dickinson1985). The point counting was conducted using a transmitted-light polarizing Leica DMRXP microscope. Modal parameters were normalized and plotted on ternary diagrams using tectonic discrimination fields as outlined in Dickinson & Suczek (Reference Dickinson and Suczek1979) and Dickinson et al. (Reference Dickinson, Beard, Brakenridge, Erjavec, Ferguson, Inman, Lindberg and Ryberg1983).
3.b.2. U–Th–Pb dating
Ten detrital zircon samples from the Lapur (n = 7) and Muruanachok (n = 3) sandstones were analysed to determine U–Pb ages. Detrital zircon separation and U–Pb dating were conducted following standard procedures outlined by Gehrels et al. (Reference Gehrels, Valencia and Ruiz2008) and Sláma & Košler (Reference Sláma and Košler2012), and adapted by Tucker et al. (Reference Tucker, Roberts, Hu, Kemp and Salisbury2013) for the Advanced Analytical Centre at James Cook University, where all analyses were conducted. Samples were each crushed, milled and passed through a Wilfley Table for gravity separation using water. The washed samples from the Wilfley Table were dried in an oven set at ∼60 °C. A hand magnet was used to extract magnetic minerals from the dried sample. A Frantz magnetic separator set at progressively higher magnetic currents of 0.4, 0.8, 1.0 and 1.2 A at a constant side slope of 10° was used to remove strongly magnetic minerals from the samples. The non-magnetic portion of each sample was then density separated using lithium polytungstate adjusted to a specific gravity of ∼2.85 g cm−3. Subsequently, the heavy mineral separates were washed with distilled water and dried in an oven set at ∼60 °C. All identified zircons were handpicked (≥100 zircons/sample) using an electron microscope and mounted in a 25 mm diameter transparent epoxy resin disc with fragments of zircon standards GJ-1 (609 Ma, Jackson et al. Reference Jackson, Pearson, Griffin and Belousova2004) and Temora-2 (416.8 Ma, Black et al. Reference Black, Kamo, Allen, Aleinikoff, Davis, Korsch and Foudoulis2003). The zircons in the epoxy disc were polished to expose the zircons for cathodoluminescence imaging using a Jeol JSM5410LV scanning electron microscope. Steps were taken throughout the sample preparation and mineral separation processes to prevent contamination.
The cathodoluminescence images were used to identify unaltered areas of the zircon grains for U–Pb dating. Dating was conducted using laser-ablation inductively coupled plasma mass spectrometry (LA-ICP-MS) via a Coherent GeolasPro 193 nm ArF Excimer laser ablation system connected to a Bruker 820-MS (formerly Varian 820-MS) following methods outlined in Owusu Agyemang et al. (Reference Owusu, Roberts and Jelsma2016). Total analysis time for each zircon grain was 70 s; the first 30 s was used to measure the background intensities followed by 40 s of zircon ablation. Standard bracketing was used to correct for the remaining elemental fractionation and mass bias (Gehrels et al. Reference Gehrels, Valencia and Ruiz2008). Two analyses each of zircon standards GJ-1 and Temora-2 were conducted before and after analysis of 10–12 unknown zircons from the studied samples. NIST 612 standard glass (50 ppm glass USGS working values, 2009) was also analysed before and after each U–Pb laser ablation session (usually 8 h per session) and at least once between sessions for calibrating thorium and uranium concentrations. Zircon grains were ablated using a 32 μm beam diameter.
Data reduction and age determination was performed using the GLITTER 4.0 software (Van Achterbergh et al. Reference Van Achterbergh, Ryan, Jackson, Griffin and Sylvester2001). The reduced data was exported to Microsoft Excel with Isoplot/Ex 3.75 (Ludwig, Reference Ludwig2012), an Excel-based macro for the calculation of discordancy, which is a ratio of the 206Pb–238U and 207Pb–206Pb ages. A discordance cut-off of 10 % was used in this study for all grains older than 300 Ma (Gehrels, Reference Gehrels, Busby and Azor2012). Concordia diagrams (2σ error ellipses) and probability density plots were developed for the U–Pb age dataset using Isoplot/Ex 3.75. Reported uncertainties were propagated by linear addition of the external reproducibility obtained from primary standard zircon GJ-1 during individual analytical sessions.
3.b.3. Lu–Hf isotope analyses
The Lu–Hf isotopic compositions of the zircons were measured from a subset of detrital zircon grains selected to provide the greatest coverage of different grain-age populations from eight of the U–Pb detrital zircon samples with ≤10% discordance. Lu–Hf methods followed those described by Kemp et al. (Reference Kemp, Foster, Scherstén, Whitehouse, Darling and Storey2009) and Næraa et al. (Reference Næraa, Scherstén, Rosing, Kemp, Hoffmann, Kokfelt and Whitehouse2012) for the Advanced Analytical Centre at James Cook University. The eight samples included five from the Lapur and three from the Muruanachok sandstones. The Lu–Hf analyses were performed using a GeoLas 193-nm ArF laser and a Thermo Scientific Neptune multi-collector ICP-MS, with a repetition rate of 4 Hz and power density of sample maintained at around 6–7 J cm−2, which translates into an estimated ablation rate of ∼0.5 μm s−1 using helium gas for ablation. The Lu–Hf isotopic ratios for each analysis were derived from a 60 s ablation period, comprising 60 cycles of 1 s integration time. Background gas was measured for ∼60 s at the beginning of every analysis. The isotopic data were acquired using a uniform laser spot size of 60 μm, usually overlapping the same spot where the zircon grain was ablated for concordant U–Pb age data (Fisher et al. Reference Fisher, Vervoort and Hanchar2014).
The Lu–Hf datasets were subsequently processed offline to check for the homogeneity of all ablated zircons. Correction for the isobaric interference of lutetium (Lu) and ytterbium (Yb) on 176Hf was performed by monitoring 175Lu (176Lu/175Lu = 0.026549) and 171Yb (176Yb/171Yb = 0.897145). Both 171Yb and 173Yb were measured in order to correct for the mass bias, which was subsequently corrected by the exponential law (Fisher et al. Reference Fisher, Hanchar, Samson, Dhuime, Blichert-Toft, Vervoort and Lam2011). The measured average 176Hf/177Hf from two standard zircons, Mud Tank zircon (MTZ) and FC-1 zircon, were used to monitor the instrumental state and analytical accuracy (Fisher et al. Reference Fisher, Vervoort and Hanchar2014). The FC-1 zircon standard was repeatedly measured, for which the normalized 176Hf/177Hf value is 0.282178 ± 16 (n = 13) and the ‘true’ (solution) value is 0.282184 ± 16 (Woodhead & Hergt, Reference Woodhead and Hergt2005), where the uncertainties are two standard deviations. The measured average 176Hf/177Hf from MTZ obtained over all analytical sessions is 0.282493 ± 6 (n = 18) and compared with the ‘true’ (solution) value of 0.282507 ± 6 (Woodhead & Hergt, Reference Woodhead and Hergt2005). Based on the analyses of the MTZ, a 176Hf/177Hf normalization factor of 1.000050 was applied to the unknown sample zircons from this study (Næraa et al. Reference Næraa, Scherstén, Rosing, Kemp, Hoffmann, Kokfelt and Whitehouse2012; Fisher et al. Reference Fisher, Vervoort and Hanchar2014). The 176Lu decay constant of 1.867 ± 0.008 x 10⁻¹¹ yr−1 reported by Söderlund et al. (Reference Söderlund, Patchett, Vervoort and Isachsen2004) and the Chondritic Uniform Reservoir (CHUR) values of 176Hf/177Hf (0.282785) and 176Lu/177Hf (0.0336) reported by Bouvier et al. (Reference Bouvier, Vervoort and Patchett2008) were used in the calculations.
3.b.4. Zircon trace-element analysis
Zircon trace-element composition analysis, following U–Pb dating and Lu–Hf analysis, was employed to provide additional source rock characteristics, as transportation and weathering processes do not modify the trace elemental ratios in zircon (e.g. Pearce et al. Reference Pearce, Harris and Tindle1984; Hoskin & Ireland, Reference Hoskin and Ireland2000; Belousova et al. Reference Belousova, Griffin, O’Reilly and Fisher2002; Grimes et al. Reference Grimes, John, Kelemen, Mazdab, Wooden, Cheadle, Hanghoj and Schwartz2007; Yao et al. Reference Yao, Shu and Santosh2011). Selected grains from the Archaean, Proterozoic and Palaeogene zircon populations from both sandstones were analysed for their trace-element ratios. The analyses were conducted using LA-ICP-MS with a Coherent GeolasPro 193 nm ArF Excimer laser ablation system connected to a Bruker 820-MS following a similar methodology to that described above for U–Pb geochronology. The laser repetition rate was 10 Hz and the laser beam energy at the sample was maintained at between 5 and 6 J cm−2. A spot size of 44 μm was used throughout the analysis. The analysis time for each sample was also 70 s, comprising a 30 s measurement of background intensities and a 40 s sample analysis time. Cathodoluminescence images of the zircons were used to select unaltered spots on the zircons that were in the same domains as spots previously analysed for U–Pb age. Calibration was achieved using standard procedures (Kovacs et al. Reference Kovacs, Schlosser, Staub, Schmiderer, Pernicka and Günther2009) that included the use of NIST 610 glass reference material for external standardization and the stoichiometric zircon SiO2 content for internal standardization. Standard zircon 91500 (Wiedenbeck et al. Reference Wiedenbeck, Hanchar, Peck, Sylvester, Valley, Whitehouse, Kronz, Morishita, Nasdala, Fiebig and Franchi2004) was used as a secondary standard to check the method for accuracy. Zircon trace-element data were processed using SILLS with GeoREM preferred concentration values for NIST 610 (Guillong et al. Reference Guillong, Meier, Allan, Heinrich and Yardley2008).
4. Results and interpretation
4.a. Sandstone petrography
Modal quartz–feldspar–lithic (QFL) compositions were used to infer the parent rock characteristics (Dickinson & Suczek, Reference Dickinson and Suczek1979; Dickinson et al. Reference Dickinson, Beard, Brakenridge, Erjavec, Ferguson, Inman, Lindberg and Ryberg1983; Ingersoll et al. Reference Ingersoll, Bullard, Ford, Grimm, Pickle and Sares1984; Dickinson, Reference Dickinson1985). Dickinson & Suczek (Reference Dickinson and Suczek1979) proposed that the mean compositions of modal QFL grains derived from different source regions controlled by plate tectonic processes are inclined to plot within discrete fields on QtFL and QmFLt diagrams. However, these provenance assignations reported herein must be treated with caution owing to the high probability of feldspar dissolution related to surficial tropical weathering.
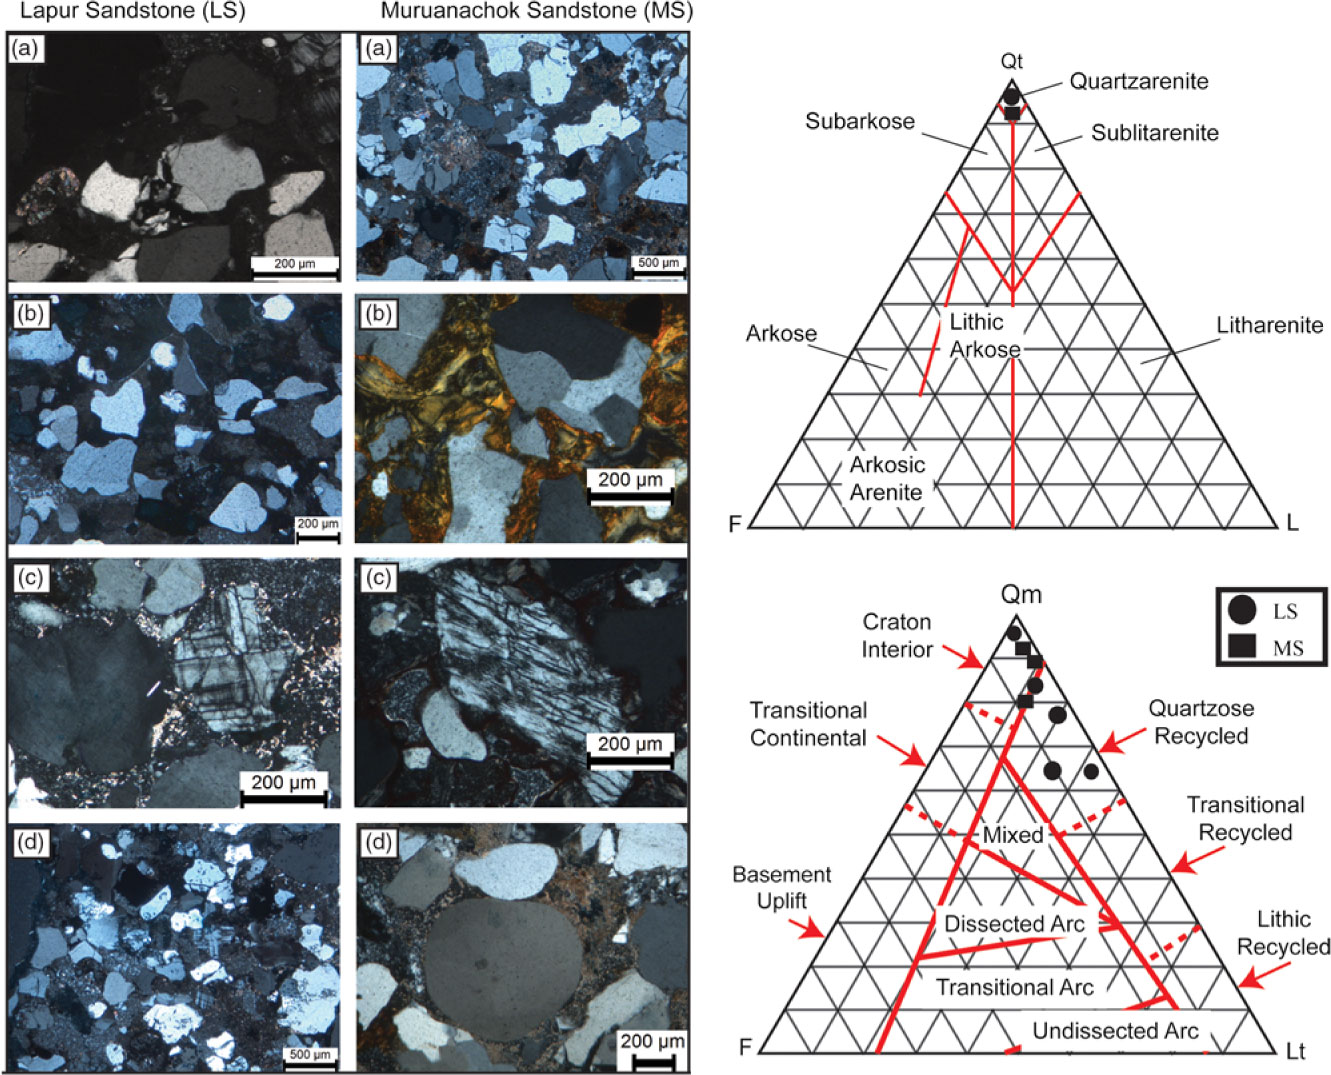
Modal QFL compositions of the Lapur and Muruanachok sandstones are presented in Figure 4. Both the Lapur and Muruanachok samples are dominated by monocrystalline quartz with subordinate polycrystalline quartz and rock fragments, and cemented by a combination of calcite, kaolin and haematite cements. The samples had no visible feldspar grains, except for one Muruanachok (Bow-26) and three Lapur (Bow-20A, Bow-21 and Bow-21A) sandstone samples (Figs 3, 4). The lithic rock fragments are dominantly from volcanic and metamorphic sources in both units. Ternary diagrams were plotted to define the petrofacies and identify possible source areas for the two sandstones. The Lapur and the Muruanachok sandstones are comparable in their quartz content, which ranges from 89 % to 97 %, consistent with a quartz arenite to sub-arkose petrofacies. Assuming that no surficial feldspar dissolution has occurred, both sets of samples plot in the recycled and craton interior provenance fields, following the tectonic discrimination diagrams of Dickinson et al. (Reference Dickinson, Beard, Brakenridge, Erjavec, Ferguson, Inman, Lindberg and Ryberg1983).
Thin-section photomicrographs and detrital modes of Lapur and Muruanachok sandstones. Representative photomicrographs for the two sandstones investigated; left column is Lapur samples and right column is Muruanachok samples. The Lapur samples mostly plot as quartz arenites with mixed provenance suggestive of a recycled orogen and craton interior. The Muruanachok samples mostly plot as quartz arenites with a craton interior provenance. Tectonic discrimination diagrams are after Dickinson et al. (Reference Dickinson, Beard, Brakenridge, Erjavec, Ferguson, Inman, Lindberg and Ryberg1983). Qt – total quartz grains; Qm –monocrystalline quartz; Lt – total lithic fragments.

The detrital grains from both sets of samples are sub-angular to sub-rounded, poorly sorted with clay matrix present and abundant calcite, kaolin and haematite cements. Primary porosity is observed mostly in the Lapur samples, although this is quite variable. A number of grains from the two sandstones are elongated with mica inclusions, suggestive of a schistose metamorphic source for those grains (Folk, Reference Folk1980), which is consistent with sediment derived from the Eastern Granulite part of the Mozambique Belt underlying most of Kenya and the Turkana Basin (Mosley, Reference Mosley1993). Some monocrystalline quartz grains also contains large vacuoles with rounded corners and embayments suggestive of plutonic and volcanic sources, respectively (Folk, Reference Folk1980), which is consistent with rocks of the Western Mozambique Belt or possibly from younger, unknown volcanic sources.
4.b. U–Pb detrital zircon geochronology
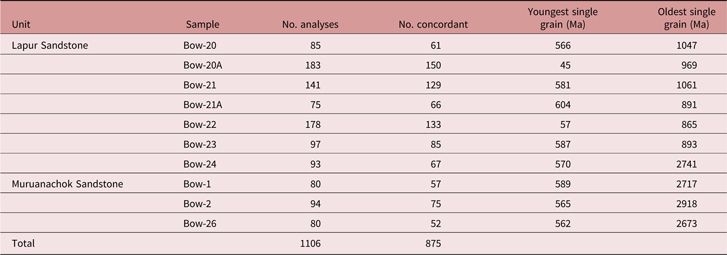
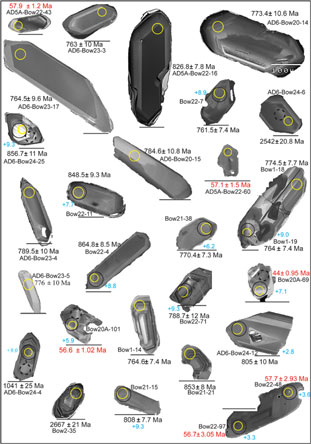
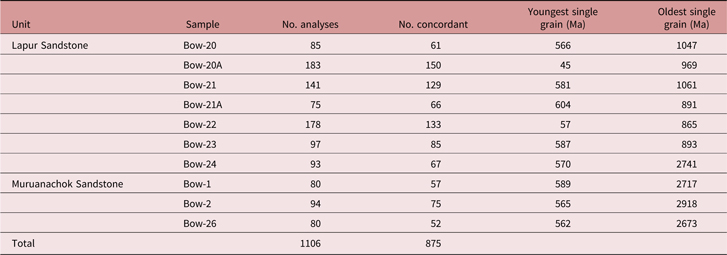
Ten detrital zircon samples were taken from the Lapur (n = 7) and Muruanachok (n = 3) sandstones, and analysed for their U–Pb ages. This work yielded 875 concordant U–Pb analyses out of 1106 total analyses using a discordance filter of 10 %. U–Pb age results are summarized in Table 2 and the complete zircon U–Pb data are presented in online Supplementary Material Table S1 available at https://doi.org/10.1017/S0016756818000663. Detrital zircon grains range from bright to dark with dominantly oscillatory zoning under cathodoluminescence (Fig. 5). Zircon grains are mostly clear to light brown, predominantly euhedral to sub-rounded, and with grain lengths ranging from 100 μm to 650 μm and widths from 50 μm to 200 μm, typical of an igneous or magmatic source (e.g. Aleinikoff et al. Reference Aleinikoff, Schenck, Plank, Srogi, Fanning, Kamo and Bosbyshell2006).
Summary of detrital zircon analysis for each of the ten studied samples from the two sandstones
Representative cathodoluminescence images showing internal structure and morphology of detrital zircons from the Lapur and Muruanachok sandstones in the Turkana Basin. Yellow circles show U–Pb age dating spots, black circles show Lu–Hf isotope analysis spots and dashed black circles show trace-element analysis spots. The analysis spot sizes used for the U–Pb, trace-element and Hf analyses are 32, 44 and 60 μm in diameter, respectively. The scale bar under each zircon is equivalent to 100 μm.

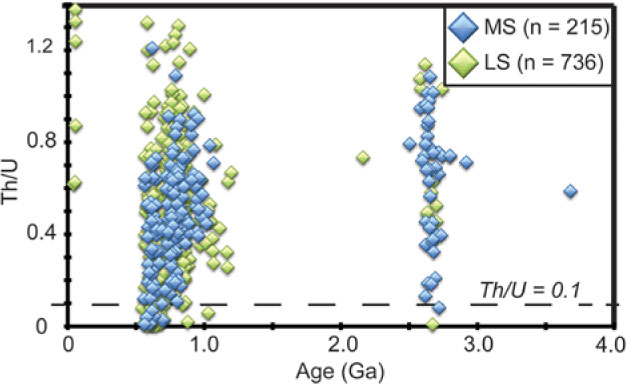
High Th/U ratios (Th/U > 0.1) in zircons are typical of magmatic sources, whereas low Th/U ratios (Th/U < 0.1) and variable ratios are characteristic of metamorphic sources (Rubatto, Reference Rubatto2002; Hoskin & Schaltegger, Reference Hoskin and Schaltegger2003). In this study, the majority of the zircon grains from the ‘Turkana Grits’ are characterized by high Th/U ratios, except for a small fraction (∼4 %) with Th/U ratios of < 0.1 (Fig. 6). The high Th/U ratios suggest that most of the detrital zircons in the Turkana Basin were sourced from magmatic/igneous rocks, or more likely in this setting from partially metamorphically overprinted igneous terrains that were unaffected by resetting. The few grains with metamorphic Th/U ratios were probably affected by localized hydrothermal fluid interactions (for example the Bow1-19 zircon grain in Fig. 5).
Thorium (Th) to Uranium (U) ratios for the Lapur and Muruanachok zircons. This figure shows the high Th/U ratios for the analysed samples from the Turkana Basin, which suggest that most of the detrital zircons have magmatic provenances. The dash line is Th/U = 0.1.

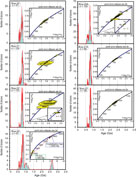
The seven Lapur samples yielded 691 concordant ages out of 852 grain analyses. The age spectra are similar for all seven samples, and the zircons range in age from Neoarchaean (∼2700 Ma) to Eocene (∼45 Ma). Each of the seven Lapur samples is dominated by Neoproterozoic zircons (1000–550 Ma), accounting for ∼96 % of all concordant analyses (Fig. 7). The main exceptions include a population of 11 Archaean-age zircons from the Lapur sample Bow-24 (base of the unit) and six Palaeogene-age zircons recovered from Lapur samples Bow-20A and Bow-22 (top of the unit; Fig. 3a). The Palaeogene zircons are particularly significant as the Lapur Sandstone has traditionally been considered to be Cretaceous in age. The Palaeogene zircons include one middle Eocene grain (∼45 Ma) and a coherent population of five Paleocene grains with a mean age of ∼57 Ma.
Probability density plot and corresponding Concordia plots for the Lapur Sandstone (n = 7). The plot shows the dominance of Neoproterozoic-age zircons for each sample. Reported results are single zircon concordant analyses with the exception of one grain from sample Bow-22 that was analysed twice (the reported analyses Bow-22-48 and Bow-22-96 are from the same zircon grain, see Fig. 5). The 207Pb–206Pb age was selected for zircon grains older than 1.0 Ga as it is more reliable for older zircons, whereas the 206Pb–238U age was selected for younger zircons with ages less than 1.0 Ga, because it is reliable for younger zircons (e.g. Gehrels, Reference Gehrels, Busby and Azor2012). The instrumental parameters and operating conditions are provided in online Supplementary Material Table S1 available at https://doi.org/10.1017/S0016756818000663.

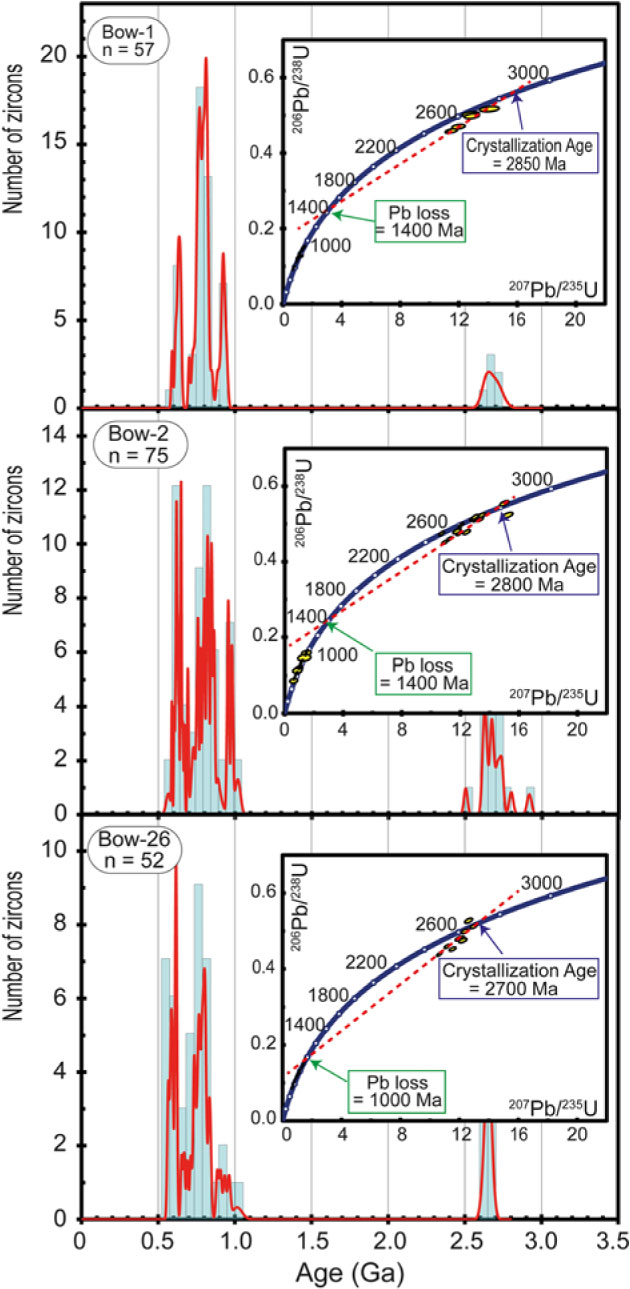
The three Muruanachok samples yielded 184 concordant grains out of 254 grain analyses, with ages ranging from Mesoarchaean (2918 Ma) to Neoproterozoic (562 Ma). The Muruanachok samples are also dominated by Neoproterozoic zircons accounting for ∼80 % of concordant zircons, followed by ∼19 % Archaean zircons (Fig. 8). The Archaean grains from the Muruanachok samples, which are clustered around 2800 Ma and 2650 Ma, are similar to the Archaean grains from the Lapur sample Bow-24 (Figs 7, 8).
Probability density plot and corresponding Concordia plots for the Muruanachok Sandstone (n = 3). The plot shows the dominance of Neoproterozoic-age zircons from the Muruanachok Sandstone. Reported results are single zircon concordant analyses, except for Bow-1-18 and Bow-1-19, which represent the same grain (see Fig. 5).

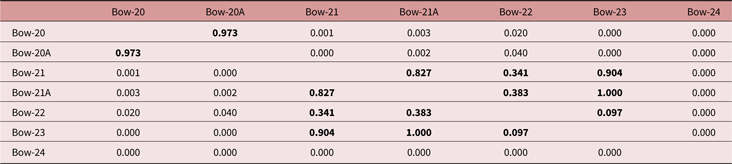
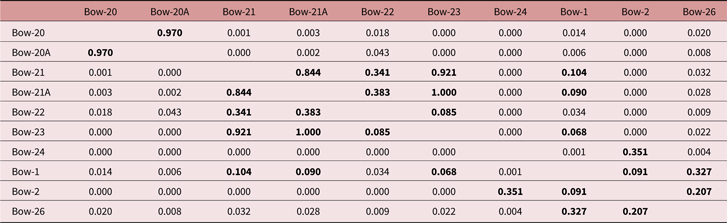
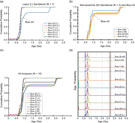
Kolmogorov–Smirnov (K–S) non-parametric statistical tests were used to compare the age distributions for provenance interpretations. This K–S test compares the maximum probability difference between two cumulative distribution frequency (CDF) curves for two populations and expresses the probability (P) that the observed difference must exceed 0.05 to be 95 % confident that the populations are not different and may have originated from a similar source terrain (Guynn & Gehrels, Reference Guynn and Gehrels2010). The degree of similarity or difference between any two of the samples from this study can be seen in the CDF plots generated from the K–S test (Fig. 9a–c; Tables 3–5). The normalized age probability plot (Fig. 9d) also highlights the differences and similarities between the two sets of samples. Qualitative comparison of the cumulative frequency distribution plots (Fig. 9a–c) for each of the Lapur and Muruanachok samples suggests that both sandstones were sourced from a similar, if not the same, Neoproterozoic source, presumably the local crystalline basement rocks of the Mozambique Belt exposed along the rift flanks before the onset of metamorphism around 640 Ma (Hauzenberger et al. Reference Hauzenberger, Sommer, Fritz, Bauernhofer, Kröner, Hoinkes, Wallbrecher and Thöni2007), as shown by the dominance of magmatic sources (Fig. 6).
Kolmogorov–Smirnov (K–S) test for seven Lapur Sandstone samples from the Turkana Basin

Note: P-values from Kolmogorov–Smirnov test of detrital zircon age spectra assessing similarities of Lapur Sandstone samples. The bold P-values indicate that they pass the K–S test and could be from a similar terrain.
Kolmogorov–Smirnov (K–S) test for three Muruanachok and one Lapur sample from the Turkana Basin

Note: P-values from Kolmogorov–Smirnov test of detrital zircon age spectra assessing similarities of Muruanachok Sandstone samples and Lapur Bow-24, showing they are similar, particularly to Bow-2. The bold P-values indicate that they pass the K–S test and could be from a similar terrain.
Kolmogorov–Smirnov (K–S) test for ten samples from the Turkana Basin, including both Lapur and Muruanachok sandstones

Note: P-values from Kolmogorov–Smirnov test of detrital zircon age spectra assessing similarities of all samples. The bold P-values indicate that they pass the K–S test and could be from a similar terrain.
Cumulative distribution frequency diagram of the studied samples. (a) Lapur Sandstone (n = 7). This figure shows that only Bow-24 is different because of the Archaean population and hence more similar to the Muruanachok Sandstone. (b) Muruanachok samples (n = 3) and Bow-24 (mapped as Lapur). This plot shows that the three Muruanachok samples have identical provenance to the Lapur Bow-24 sample. (c) All analyses. (d) Relative age probability plot of detrital zircon samples (n = 10) from the Lapur (L) and Muruanachok (M) samples showing the similarities and differences in age spectra. Three main Neoproterozoic age populations are also highlighted.

The K–S test for the Lapur samples (Fig. 9a; Table 3) indicates that six out of seven samples passed the test and are likely to have come from a similar source. The Lapur sample Bow-24, did not pass the K–S test, but does pass the K–S test when compared with the Muruanachok samples (Fig. 9b; Table 4). The key provenance difference is the presence of a substantive Neoarchaean zircon population in the Muruanachok samples and Bow-24 (from the Lapur Sandstone), which is not seen in any of the other six Lapur samples. It must be noted that these Neoarchaean zircon populations appear to have been affected by Pb-loss (Figs 7, 8). Additionally, sandstone petrography confirms a closer similarity between Bow-24 and the Muruanachok Sandstone samples than with the six other Lapur samples (Fig. 4). Although the stratigraphic context of the Bow-24 sample in relation to rest of the Lapur samples is not entirely clear, this sample, which is the southernmost Lapur Sandstone unit sample in this study, is reinterpreted herein to be part of the lower Lapur Sandstone (Figs 2b, 3). Considered together, it would seem that two distinct provenance sources exist for the same unit and that sample Bow-24, which is the most basal, southernmost Lapur sample, may share both sources or be sourced from the same source as the Muruanachok Sandstone, but not that of the Lapur Sandstone.
4.c. Lu–Hf isotope geochemistry
The Lu–Hf isotope ratios were used to estimate the initial ɛHf(t) values of selected zircon grains, in order to predict their tectonic source. This process provides a targeted approach to sedimentary provenance investigation (e.g. Kinny & Mass, Reference Kinny, Mass, Hanchar and Hoskin2003). Zircons yielding positive initial ɛHf(t) values are indicative of sources of juvenile crustal additions/growth or significant input from new melt from the depleted upper mantle with minimal reworking, whereas negative ɛHf(t) values indicate crustal reworking (Kinny & Mass, Reference Kinny, Mass, Hanchar and Hoskin2003; Condie et al. Reference Condie, Beyer, Belousova, Griffin and O’Reilly2005; Morag et al. Reference Morag, Avigad, Gerdes, Belousova and Harlavan2011). In particular, we were interested in better understanding the source of sediment for the different populations, so subsets from each of the major U–Pb grain-age populations, including the Palaeogene grains, were selected to help refine the provenance of the ‘Turkana Grits’. The selected populations included 57 Muruanachok and 120 Lapur detrital zircons (Fig. 10). The 57 zircon grains were selected from all three Muruanachok samples to represent Proterozoic (mostly Pan-African, n = 46) and Archaean populations (n = 11), whereas the 120 Lapur detrital zircons include Palaeogene (n = 4), Proterozoic (n = 115) and Archaean (n = 1) populations from five of the Lapur samples (see online Supplementary Material Table S2 available at https://doi.org/10.1017/S0016756818000663).
Plot of initial ɛHf(t) versus U–Pb age of concordant detrital zircons from the Lapur and Muruanachok sandstones in the Turkana Basin (n = 177). The plot shows that most of the zircons in this study were derived from juvenile mantle sources. Note: The depleted mantle (DM) evolution curve is for linear evolution from a Chondritic Uniform Reservoir (CHUR) value at the Earth’s formation (i.e. 0 at 4.56 Ga) to ɛHf(t) = 17 at the present for the DM (Dhuime et al. Reference Dhuime, Hawkesworth and Cawood2011). The mass spectrometer cup configuration for this study is shown in online Supplementary Material Table S2 available at https://doi.org/10.1017/S0016756818000663.

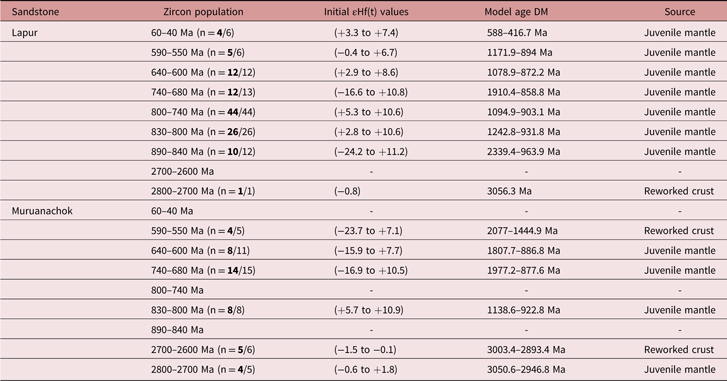
The results show a wide spread of 176Hf/177Hf ratios from 0.281453 to 0.282567 and initial ɛHf(t) values ranging from –26.4 to + 11.2 (Fig. 10), which are dominated by positive values accounting for 87 % of the analysis. The main populations with their initial ɛHf(t) values and inferred sources are shown in Table 6. The four Palaeogene zircons, including three Paleocene grains (∼57 Ma) and a single Eocene grain (∼45 Ma), have positive initial ɛHf(t) values, ranging from +3.3 to +7.4, suggestive of a juvenile mantle provenance. The Archaean and Proterozoic zircon populations from both sandstones yielded mostly positive initial ɛHf(t) values ranging from −1.5 to +1.8 and −26.2 to +11.2, respectively (Fig. 10).
Summarized Lu–Hf isotope analysis

Note: This table shows the different detrital zircon populations in the studied zircons from the two sandstones indicating the dominant contributing source of sediment in each population. All populations from the two sandstones, except three, are dominantly from juvenile mantle sources. The number of analyses for each population is shown as n = a/b; where ‘a’ is the dominant number of zircons with either positive or negative initial ɛHf(t) values. ‘b’ is the total number of analyses for a particular population. The population is described as being sourced from a juvenile mantle or reworked crustal source provenance when ‘a’ represents positive or negative values, respectively.
The ɛHf(t) values from this study indicate a mixed provenance with dominant (n = 153) input from juvenile mantle components and a minor contribution (n = 24) from older reworked crustal sources. The negative initial ɛHf(t) values are mainly from the more mature Muruanachok and Lapur Bow-24 samples. For example, the ɛHf(t) values for the 590–550 Ma age population (Table 6) from the Muruanachok Sandstone are mainly negative, whereas the ɛHf(t) values for the same age population in the Lapur samples are dominantly positive, indicating different tectonic sources for zircons with similar ages in the two sandstones. Additionally, the two different Archaean grain populations at ∼2700 Ma and ∼2650 Ma from the Muruanachok Sandstone show distinct positive and negative values, respectively, again suggesting different sources for the two Archaean grain populations (Table 6).
4.d. Zircon trace-element results
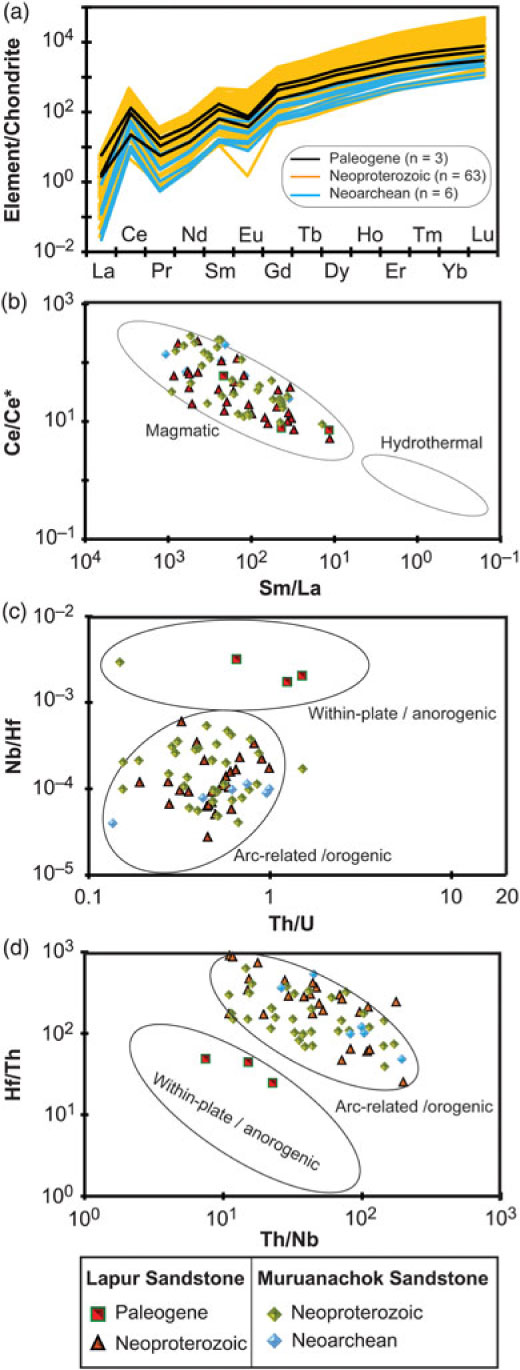
Summarized detrital zircon trace-element analyses are shown in Figure 11 and Table 7, and the complete results are listed in online Supplementary Material Table S3 available at https://doi.org/10.1017/S0016756818000663. The trace-element composition analyses were performed on a subset of 31 grains from the Lapur and 41 grains from the Muruanachok sandstones, representing Palaeogene, Proterozoic and Archaean zircon populations, in a further attempt to better define discrete provenance sources (Taylor & McLennan, Reference Taylor and McLennan1985; Hoskin, Reference Hoskin2005). For example, a single grain-age population may be further queried to look for different populations that may have been formed synchronously, but in different areas that had very different patterns of crustal evolution (e.g. the 590–550 Ma population from the two sandstones; see Table 6). If this happened, then trace-element ratios could potentially shed light on provenance (Taylor & McLennan, Reference Taylor and McLennan1985); however, similarity of rare earth element (REE) patterns from different rock types certainly has the potential to make using trace elements as a provenance indicator problematic (Hoskin & Ireland, Reference Hoskin and Ireland2000).
(a) Chondrite-normalized rare earth element patterns for the main populations of the Lapur and Muruanachok sandstones (Turkana Grits). (b) Discrimination plots for magmatic and hydrothermal zircons. Zircons from both sandstones plot within the magmatic domain. The plots (c, d) show closely clustered zircons in the magmatic domains. (c, d) Plots of trace-element ratios showing a dominant arc-related/orogenic tectonic source for zircons from the two sandstones, except for the Palaeogene-age grains from the Lapur Sandstone, which show trace-element patterns suggestive of a within-plate magmatic setting. Chondrite normalization values from Taylor & McLennan (Reference Taylor and McLennan1985).

Ratios of chondrite-normalized zircon REE patterns

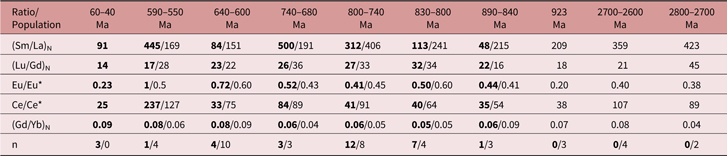
Note: Chondrite normalizing values are from Taylor & McLennan (Reference Taylor and McLennan1985). n = the number of analyses contributing to the mean. The first number in the ratio a/b represents the Lapur Sandstone whereas the second number represents the Muruanachok Sandstone. The numbers presented in this table are the averages of the various ratios. Eu and Ce anomalies were calculated as Ce/Ce* = CeN/(sqrt(LaN * PrN)) and Eu/Eu* = EuN/(sqrt(SmN*GdN)), where ‘N’ is normalized.
Magmatic zircons are characterized by heavy rare earth element (HREE) contents, high Th/U ratios and distinct enrichment of HREEs (high LaN/YbN), a positive Ce anomaly and a negative Eu anomaly (Hoskin & Ireland, Reference Hoskin and Ireland2000). The trace-element composition of metamorphic zircons in contrast is characterized by the concurrent growth of other minerals, which can be relevant for the identification of metamorphic conditions (Schaltegger et al. Reference Schaltegger, Fanning, Günther, Maurin, Schulmann and Gebauer1999; Rubatto, Reference Rubatto2002). For instance, garnet incorporates HREEs, and its crystallization in a metamorphic environment causes a depletion of HREEs in metamorphic zircon (Rubatto, Reference Rubatto2002). Plagioclase also acts as a sink for Eu, and zircons without a negative Eu anomaly are usually interpreted as having formed in plagioclase-deficient environments such as kimberlite, syenite (Belousova et al. Reference Belousova, Griffin, O’Reilly and Fisher2002) and eclogite (Rubatto, Reference Rubatto2002).
Our results demonstrate that zircons from the different populations within the Lapur and Muruanachok sandstones have similar chondrite-normalized REE patterns, strongly enriched in light rare earth elements (LREEs) and depleted in HREEs, and with strong negative Eu anomalies (Fig. 11a). The Th/U ratios for both sets of samples range from 0.01–1.50 and 0.14–1.55 for the Lapur and Muruanachok sandstones, respectively. The strong Ce and Eu anomalies (Fig. 11a; Table 7) for the different populations from both sets of samples are consistent with the magmatic source (Fig. 11b) characterization of Hoskin (Reference Hoskin2005) as presented in Ce/Ce* versus SmN/LaN diagrams. This diagram support our previous interpretations based on the Th/U ratios (Fig. 6). Plots of Hf/Th–Th/Nb (Fig. 11c, d) for these grains also indicate a dominantly arc-related orogenic source (Hawkesworth & Kemp, Reference Hawkesworth and Kemp2006; Yang et al. Reference Yang, Cawood, Du, Huang, Huang and Tao2012) for the ‘Turkana Grits’ zircons.
Felsic igneous rocks are characterized by high LREE/HREE ratios with a negative Eu anomaly (Eu/Eu* < 1), whereas mafic igneous rocks are characterized by low LREE/HREE ratios with little or no negative Eu anomaly (Cullers et al. Reference Cullers, Bock and Guidotti1997). Overall, the zircons from the Lapur and Muruanachok sandstones (‘Turkana Grits’) have a depleted GdN/YbN of between 0.04 and 0.09, with strong negative Eu (Eu/Eu* = 0.23–1.0) and positive Ce anomalies (Ce/Ce* = 25–237), which are all consistent with felsic magmatic sources. This is consistent with the presence of felsic dykes and magmatic rocks in the Mozambique Belt within the vicinity of the study area (Key et al. Reference Key, Charsley, Hackman, Wilkinson and Rundle1989).
5. Discussion
5.a. Age of the ‘Turkana Grits’
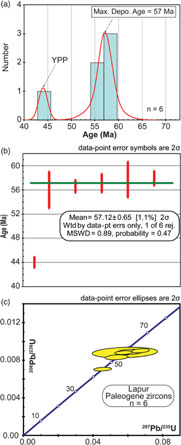
Detrital zircon analysis from this study provides new maximum depositional age constraints for the upper Lapur Sandstone; however, no new information on the age of the Muruanachok Sandstone was revealed. A population of six Palaeogene zircons from the middle to upper portions of the Lapur Sandstone (Fig. 3) provides confirmation that at least the upper portion of the unit extends into the Palaeogene as suggested by some workers (e.g. P Thuo, unpub. Ph.D. thesis, Univ. Western Brittany, 2009). Of the six Palaeogene grains, five were tightly clustered and overlapped at 2-sigma, and were used to calculate a robust Paleocene maximum depositional age with a weighted mean 206Pb–238U age of 57.12 ± 0.65 Ma (MSDW = 0.89, probability 0.47; Fig. 12). The single ∼45 Ma younger grain may indicate that the Lapur Sandstone is even younger than Paleocene. It is worth noting that volcanism of a similar age (46 Ma and younger) reported from southern Ethiopia (Bosworth et al. Reference Bosworth, Stockli and Helgeson2015; Bosworth & Stockli, Reference Bosworth and Stockli2016) may be coeval to the unknown event in the Turkana region that produced the single 45 Ma grain. However, at present, the single grain age lacks reproducibility and must be considered anomalous, possibly a result of Pb-loss, and should not be considered in maximum depositional age interpretations (see Dickinson & Gehrels, Reference Dickinson and Gehrels2009 for further discussion)
Palaeogene-age zircons recovered from the Lapur Sandstone. (a) Probability density plot of the Palaeogene zircons (n = 6) showing the maximum depositional age. (b) Weighted mean age of five of the six zircons from Bow-20A and Bow-22, estimated as the maximum depositional age of the Lapur Sandstone. (c) U–Pb Concordia plot of the six Palaeogene zircon grains recovered from the Lapur Sandstone. Seven techniques reported by Dickinson & Gehrels (Reference Dickinson and Gehrels2009) and Tucker et al. (Reference Tucker, Roberts, Hu, Kemp and Salisbury2013) were used to estimate the maximum depositional age and they are listed here for comparison. The techniques and their corresponding age estimates are: (1) youngest single grain age (YSG = 44 ± 0.95 Ma); (2) youngest graphical detrital zircon age (YPP = 44 Ma); (3) youngest detrital zircon age (YDZ = 43.92 ± (1.1/0.99) Ma); (4) the weighted mean average age (YC1σ = 57.1 ± 1.2 Ma); (5) weighted average (WA = 57.12 ± 0.65 Ma); (6) weighted mean average age (YC2σ = 57.11 ± 0.62 Ma); and (7) TuffZirc (Zircon Age Extractor = 57.1 ± (0.8/1.1) Ma). The different techniques can be accessed via most versions of Microsoft Excel with the attached Isoplot macro (Ludwig, Reference Ludwig2012).

The presence of vertebrate fossils has typically been used as evidence that all of the Lapur Sandstone is of the same Late Cretaceous age (O’Connor et al. Reference O’Connor, Sertich and Manthi2011). The Palaeogene zircons (n = 6) were recovered from the upper Lapur Sandstone (Bow-20A and Bow-22: see Figs 2b, 3a), well above the vertebrate fossil-bearing localities restricted to the lower third of the unit (e.g. Weishampel et al. Reference Weishampel, Barrett, Coria, Le Loeuff, Xing, Xijin, Sahni, Gomani, Noto, Weishampel, Dodson and Osmolska2004; O’Connor et al. Reference O’Connor, Sertich and Manthi2011). Additionally, the ∼57 Ma zircon population (n = 5) is consistent with evidence for younger Palaeogene (∼37–27 Ma) rhyolitic and basaltic volcanism in the Turkana Rift, including volcanic units capping and possibly interfingering with the upper tens of metres of the Lapur Sandstone (Cahen et al. Reference Cahen, Snelling, Delhal and Vail1984; P Thuo, unpub. Ph.D. thesis, Univ. Western Brittany, 2009; Tiercelin et al. Reference Tiercelin, Potdevin, Thuo, Abdelfettah, Schuster, Bourquin and Ruffet2012a, b). Rather than considering the entirety of the Lapur Sandstone as Palaeogene, we suggest that there is a significant discontinuity in the middle to upper portions of the stratigraphy that differentiates the underlying Cretaceous depositional succession from the overlying Palaeogene depositional succession. The discontinuity is shown by a prominent intra-Lapur unconformity reported near Lapur samples Bow-20 and Bow-20A and supported by satellite image interpretation of the field area (approx. 4° 23’ 26.61” N, 35° 48’ 42.45” E: see Table 1) from Google Earth images (2017). This interpretation is consistent with recent biostratigraphic and sedimentologic data by P Thuo (unpub. Ph.D. thesis, Univ. Western Brittany, 2009), who found evidence that the fluvial systems of the Lapur Sandstone may have existed from middle Cretaceous to early Oligocene times.
Perhaps what is most interesting about the Paleocene detrital zircon population is that these grains imply that late Paleocene – early Eocene magmatism was underway in or near the Turkana Basin by 57 Ma. The six Palaeogene zircons recovered from the Lapur Sandstone may be associated with a local source or an unknown volcanic source from outside of the Turkana Basin. This unknown volcanic source may be located in the Tibesti Region of Chad (Francis et al. Reference Francis, Thorpe and Ahmed1973; Permenter & Oppenheimer, Reference Permenter and Oppenheimer2007), or from the nearby portion the Central African Rift System in the Cameroon Volcanic Line to the southeast of the Benue Trough (Benkhelil, Reference Benkhelil1989; Wilson et al. Reference Wilson, Guiraud, Moreau, Bellion, MacGregor, Moody and Clark-Lowes1998). The southern part of the Benue Trough is known to host late Maastrichtian to Eocene magmatic rocks (68–49 Ma), which change from alkaline to tholeiitic with decreasing age (Maluski et al. Reference Maluski, Coulon, Popoff and Baudin1995; Wilson et al. Reference Wilson, Guiraud, Moreau, Bellion, MacGregor, Moody and Clark-Lowes1998), and could have been the source of the Palaeogene zircons in the Lapur Sandstone. Basaltic dykes with 87–43 Ma K–Ar ages from northern Cameroon and southern Chad (Wilson et al. Reference Wilson, Guiraud, Moreau, Bellion, MacGregor, Moody and Clark-Lowes1998) are also a potential source for the Palaeogene-age zircons. The Maastrichtian to Paleocene-age basaltic rocks identified in wells drilled in the Mudugh Basin in Central Somalia (e.g. Coffin & Rabinowitz, Reference Coffin and Rabinowitz1988; Wilson et al. Reference Wilson, Guiraud, Moreau, Bellion, MacGregor, Moody and Clark-Lowes1998) are a possible source for the Paleocene Lapur zircons. Sourcing the Palaeogene-age zircons from the Cameroon Volcanic Line (Benue Trough) or the basin in Central Somalia is inconsistent with the dominantly NNW palaeocurrent data for the Lapur Sandstone, unless they were transported by palaeo-winds as air-fall ash deposits, as may have been the case where zircons were transported from the Parana Basin in South America into the Congo Basin in central Africa by air-fall tuffs (Linol et al. Reference Linol, de Wit, Barton, de Wit and Guillocheau2016). Alternatively, they could have been brought in by the proposed marine incursions in the Anza Rift Basin (Bosworth & Morley, Reference Bosworth and Morley1994; Fig. 13). This interpretation could also explain the presence of estuarine/marine vertebrate taxa within the fluvial Lapur Sandstone. Other volcanic centres in the region, such as SW Egypt (59–46 Ma; Franz et al. Reference Franz, Puchelt and Pasteels1987), the igneous province from the Delgo area in northern Sudan (87–47 Ma; Franz et al. Reference Franz, Harms, Denkler, Pasteels, Thorweihe and Schandelmeier1993), the Bayuda Desert ring complexes, NE Sudan (74–62 Ma; Barth & Meinhold, Reference Barth and Meinhold1979; Cahen et al. Reference Cahen, Snelling, Delhal and Vail1984) and Paleocene alkaline volcanic rocks from the offshore Guinea plateau, West Africa (59 Ma; Bertrand et al. Reference Bertrand, Féraud and Mascle1993), are all possible but unlikely sources.
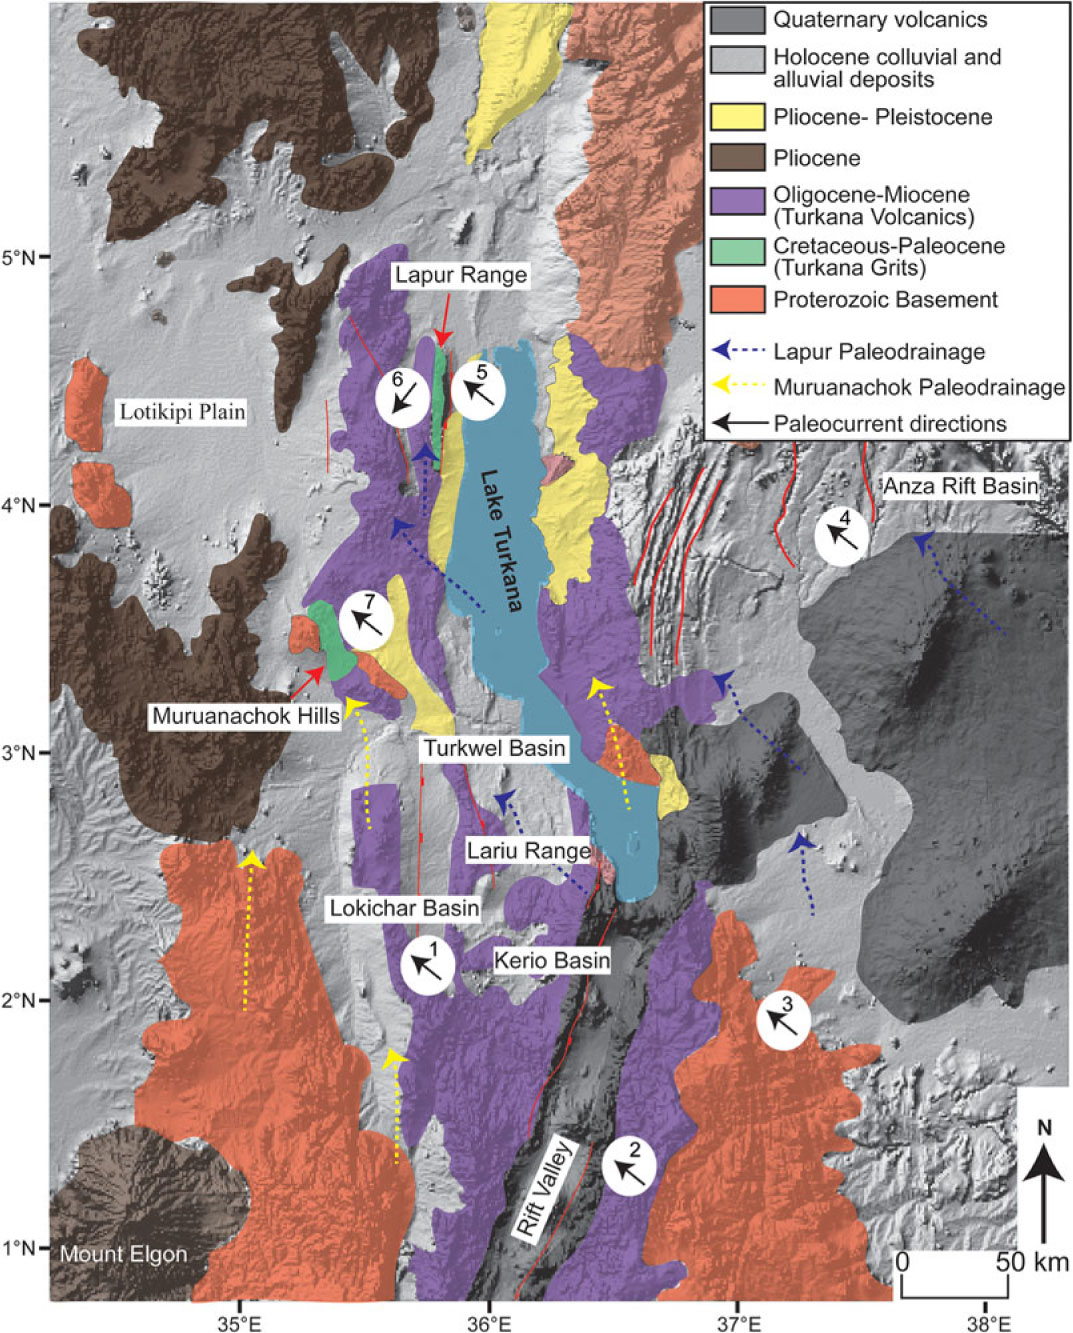
Surface geology of the Turkana Basin showing probable source areas for the sediment in the basin. Palaeocurrent directions 1–7 are after McGuire et al. (Reference McGuire, Serra and Day1985), Williamson & Savage (Reference Williamson, Savage, Frostick, Renaut, Reid and Tiercelin1986), Wescott et al. (Reference Wescott, Morley and Karanja1993), Morley et al. (Reference Morley, Karanja, Wescott, Stone, Harper, Wigger, Day and Morley1999) and Tiercelin et al. (Reference Tiercelin, Potdevin, Morley, Talbot, Bellon, Rio, Le Gall and Vétel2004). Landsat image taken from the NASA Shuttle Radar Topography Mission collection and modified after Geological Map of Kenya interpretations by the Ministry of Energy and Regional Development of Kenya, Geological Map, 1987).
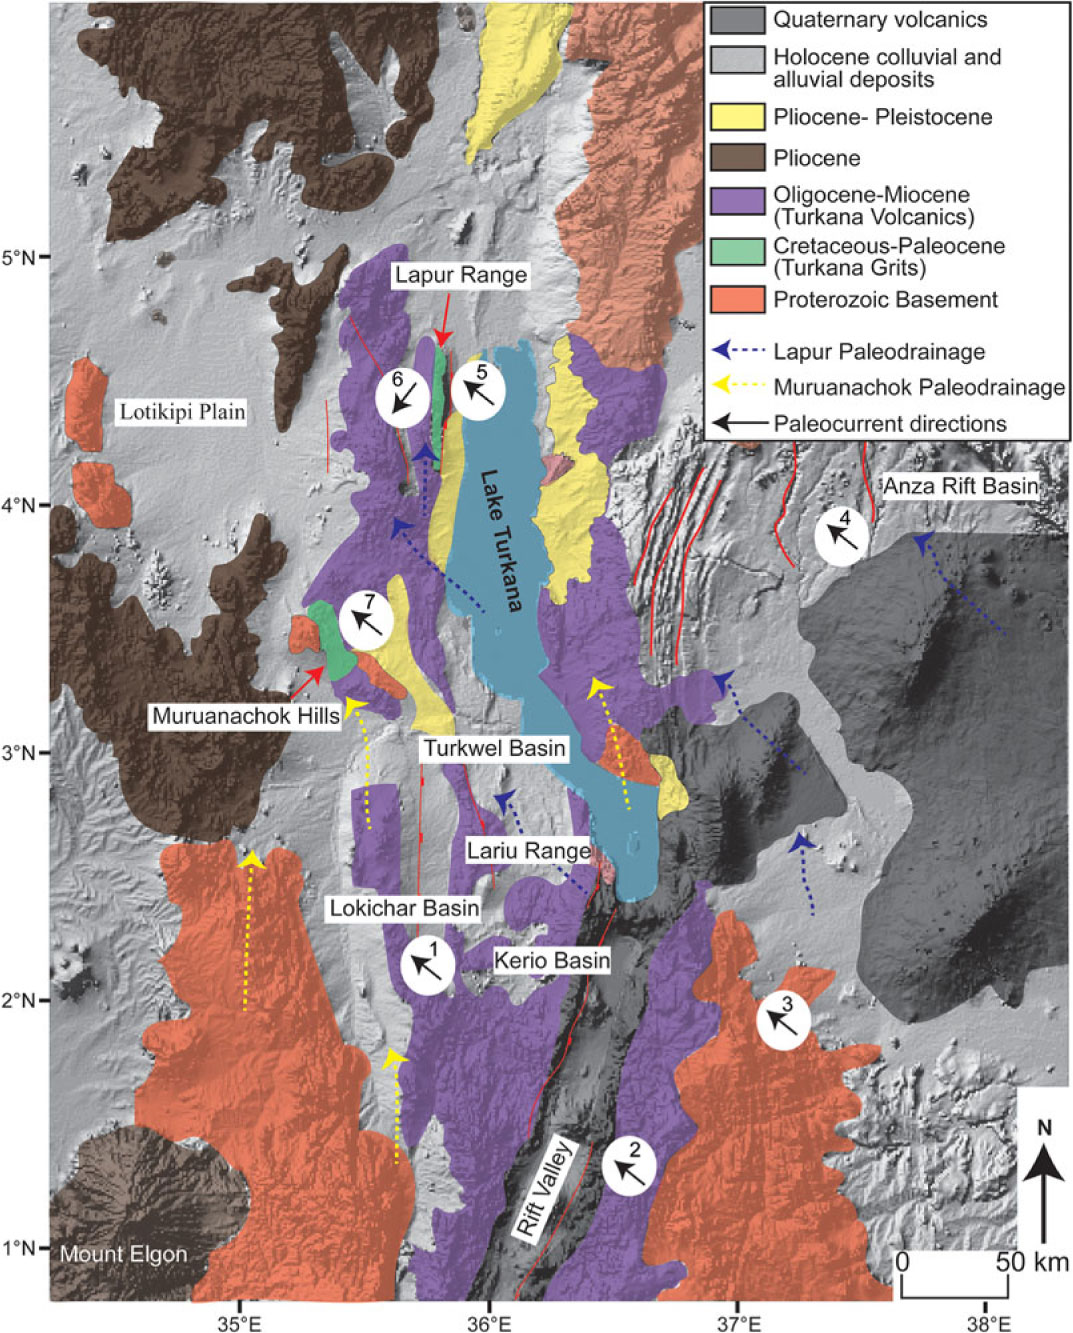
The known volcanic centres/rocks in the vicinity of the study area, for example, the Main Ethiopian Rift (46–34 Ma), the Red Sea Rift (∼30 Ma), Dafur (<23 Ma) and others are significantly younger than the Paleocene zircons recovered from the Lapur Sandstone (e.g. Emerick & Duncan, Reference Emerick and Duncan1982; Coffin & Rabinowitz, Reference Coffin and Rabinowitz1988; Bosworth, Reference Bosworth1992, Reference Bosworth2015; Sleep, Reference Sleep1996; Menzies et al. Reference Menzies, Gallagher, Yelland and Hurford1997; Ebinger & Sleep, Reference Ebinger and Sleep1998; George et al. Reference George, Rogers and Kelley1998; Bosworth et al. Reference Bosworth, Stockli and Helgeson2015; Bosworth & Stockli, Reference Bosworth and Stockli2016). Moreover, Palaeogene-age volcanic rocks have not been dated from the Turkana region, and all previous references within Kenya and the East African Rift System have been inferred from subsurface investigations (e.g. seismic); thus, it is difficult to pinpoint the exact source of these young zircon grains (Cahen et al. Reference Cahen, Snelling, Delhal and Vail1984; Boschetto et al. Reference Boschetto, Brown and McDougall1992; Morley et al. Reference Morley, Wescott, Stone, Harper, Wigger and Karanja1992, Reference Morley, Karanja, Wescott, Stone, Harper, Wigger, Day and Morley1999; McDougall & Brown, Reference McDougall and Brown2009; Feibel, Reference Feibel2011). Palaeogene-age rocks inferred from various subsurface investigations in the vicinity of the study area, including the Lokone and Auwerwer sandstones in the Lokichar Basin (Palaeogene–lower Miocene; Vincens et al. Reference Vincens, Tiercelin and Buchet2006) and the Kimwarer and Kamego formations from the Elgeyo Escarpment (Palaeogene), all to the south of the study area (e.g. Morley et al. Reference Morley, Karanja, Wescott, Stone, Harper, Wigger, Day and Morley1999; Tiercelin et al. Reference Tiercelin, Potdevin, Morley, Talbot, Bellon, Rio, Le Gall and Vétel2004, Reference Tiercelin, Potdevin, Thuo, Abdelfettah, Schuster, Bourquin and Ruffet2012a), could have been the source of the Palaeogene-age zircons in the Lapur Sandstone. The Lariu Range (Palaeogene–Miocene) and the Sera Iltomia Formation (part of the Mount Porr Sandstone) east of the Lake Turkana, considered Mesozoic–Paleocene in age (Tiercelin et al. Reference Tiercelin, Potdevin, Morley, Talbot, Bellon, Rio, Le Gall and Vétel2004), are all likely sources for the Palaeogene zircons in this study. This explanation is supported by Tiercelin et al.’s (Reference Tiercelin, Potdevin, Morley, Talbot, Bellon, Rio, Le Gall and Vétel2004) interpretation that the sediments of the Sera Iltomia Formation represent the likely early rifting from either the East African Rift System in northern Kenya (study area) or the Mesozoic–Cenozoic Anza Rift. This Anza Rift is known to host Cretaceous to Palaeogene volcanic rocks and could have been the source of the Palaeogene zircons (e.g. Reeves et al. Reference Reeves, Karanja and Macleod1987; Bosworth, Reference Bosworth1992; Mosley, Reference Mosley1993; Ebinger & Sleep, Reference Ebinger and Sleep1998). These southerly sources are all supported by palaeocurrent directions from both the Muruanachok and Lapur sandstones.
5.b. Sediment provenance of detrital zircons in the Turkana Basin
The results of this sedimentary provenance investigation demonstrate distinct differences in the petrographic and detrital zircon compositions of the Lapur and Muruanachok sandstones (Figs 4, 5, 7, 8). The Muruanachok Sandstone represents a slightly mature sandstone composition, with a discrete Archaean provenance source not observed in the Lapur Sandstone (except Bow-24). In addition to this, the young Palaeogene zircon population recovered from the upper Lapur Sandstone was not encountered in any of the three Muruanachok samples. Spatially, the Muruanachok Sandstone is located ∼140 km to the south/southwest of the southernmost exposures of the Lapur Sandstone (Fig. 2b), and hence it is possible that it simply represents a lateral equivalent of the Lapur Sandstone, with point sources to the south of the outcrop area. The southernmost Lapur sample (Bow-24) has a provenance signature identical to that of the Muruanachok Sandstone (see Fig. 9b, d), which tends to support this assertion. However, it is also possible that the Muruanachok Sandstone is older and the basal Lapur sample (Bow-24) simply represents the top of the Muruanachok Sandstone as shown by the significant elevation difference between the Lapur and Muruanachok samples (see Table 1) and the maturity of the Muruanachok and Bow-24 samples (Fig. 4). Each of the Lapur Sandstone samples except Bow-24 comes from a higher elevation than any of the Muruanachok samples, which suggests that the Lapur and Muruanachok sandstones may actually just represent distinct stratigraphic units, rather than laterally correlative units. Indeed, this hypothesis is supported by the fact that the only Lapur sample with similar provenance to that of a Muruanachok sample is the lowest Lapur sample, Bow-24 (Fig. 9b). Hence, this would suggest that the Bow-24 sample is from the top of the Muruanachok Sandstone, rather than the base of the Lapur Sandstone.
5.b.1. Archaean population
The Archaean population from the Muruanachok Sandstone and the Lapur sample Bow-24 range from 2800 Ma to 2550 Ma, and could have been transported by fluvial systems from the Archaean Tanzania Craton (Fig. 1) to the west to southwest of the study area, as they host grains of similar ages (e.g. Kabete et al. Reference Kabete, McNaughton, Groves and Mruma2012; de Wit & Linol, Reference de Wit, Linol, de Wit, Guillocheau and de Wit2015). This interpretation is consistent with the conclusions of Hepworth & Kennerley (Reference Hepworth and Kennerley1969) and Hepworth (Reference Hepworth1972), who found that the western part of the Mozambique Belt in Kenya was underlain by the Archaean Tanzania Craton (also see Grantham et al. Reference Grantham, Maboko, Eglington, Yoshida, Windley and Dasgupta2003). In addition, the Archaean zircons from our study have similar model ages (Table 6) to the Nd model ages of 3100–2700 Ma estimated from the granitoids of the Tanzania Craton (Maboko, Reference Maboko1995; Maboko & Nakamura, Reference Maboko and Nakamura1996; Möller et al. Reference Möller, Mezger and Schenk1998; Cutten et al. Reference Cutten, Johnson and De Waele2006), and could have been the source of the Archaean detrital zircons in the Turkana Basin.
Alternatively, the Archaean detrital zircons could have been sourced from the Archaean Congo-Kasai Craton to the extreme southwest of the study area (e.g. Batumike et al. Reference Batumike, Griffin, O’Reilly, Belousova and Pawlitschek2009; Kadima et al. Reference Kadima, Delvaux, Sebagenzi, Tack and Kabeya2011). However, the Tanzania Craton is considered a more likely source owing to its nearness and a lack of ∼1300–1600 Ma grains (Figs 9b, 13), which would be expected if there was sediment transport from the Congo-Kasai Craton across the Kibaran Belt (Fig. 1). Furthermore, the euhedral–subhedral morphology of Archaean zircons (Fig. 5) suggests minimal transport or limited recycling of sediment. This interpretation is supported by the dominantly positive initial ɛHf(t) values of these grains (Fig. 10), which suggests that these zircons grains were mainly sourced from juvenile crustal materials. The Archaean–Palaeoproterozoic granite-greenstones to the southwest of Kenya (Fig. 1c) close to the Ugandan border, which is also part of the Tanzania Craton (Cahen et al. Reference Cahen, Snelling, Delhal and Vail1984), have similar geochemical signatures to the Archaean zircons from this study. Moreover, palaeocurrent measurements reported for the Muruanachok and Lapur sandstones indicate a dominant NNW palaeoflow (Fig. 13: Cahen et al. Reference Cahen, Snelling, Delhal and Vail1984; McGuire et al. Reference McGuire, Serra and Day1985; Wescott et al. Reference Wescott, Morley and Karanja1993; Feibel, Reference Feibel2011). Considered together, the Archaean basement rocks to the west and south of the Turkana Basin are the most likely provenance source for Archaean zircons in both sandstones (Fig. 13).
5.b.2. Neoproterozoic population
The Neoproterozoic-age zircons from both the Lapur and Muruanachok sandstones are consistent with the range of ages assigned to the Neoproterozoic (Pan-African) age basement rocks beneath and forming the rift shoulders of the Turkana Basin (Cahen et al. Reference Cahen, Snelling, Delhal and Vail1984; Boschetto et al. Reference Boschetto, Brown and McDougall1992; Mosley, Reference Mosley1993; Rino et al. Reference Rino, Kon, Sato, Maruyama, Santosh and Zhao2008; McDougall & Brown, Reference McDougall and Brown2009). These basement rocks are part of the Mozambique Belt, which extends across much of eastern Africa (Fig. 1; e.g. Grantham et al. Reference Grantham, Maboko, Eglington, Yoshida, Windley and Dasgupta2003; Kröner & Stern, Reference Kröner and Stern2004). The basement rocks are extensively exposed in outcrop and under recent volcanic and sedimentary cover throughout the field area, but particularly to the immediate south of Lake Turkana (Fig. 13). The Mozambique Belt rocks underlying the Turkana Basin (McDougall & Brown, Reference McDougall and Brown2009), and in adjacent areas, have magmatic emplacement ages in the range of 980–850 Ma before a later metamorphic overprint around 645–630 Ma (Fig. 9d), characterizing the peak of high-grade metamorphism (Mosley, Reference Mosley1993; Hauzenberger et al. Reference Hauzenberger, Sommer, Fritz, Bauernhofer, Kröner, Hoinkes, Wallbrecher and Thöni2007). Key et al. (Reference Key, Charsley, Hackman, Wilkinson and Rundle1989) recorded two magmatic emplacement ages of 1200 Ma and 850–800 Ma within the basement rocks of the Mozambique Belt. These authors found evidence of a high proportion of juvenile mantle component within the Mozambique Belt, which is consistent with our findings of dominant contributions from juvenile sources (Fig. 10). Harris et al. (Reference Harris, Hawkesworth and Ries1984) also reported a juvenile Neoproterozoic protolith rock age of ∼860 Ma (Grantham et al. Reference Grantham, Maboko, Eglington, Yoshida, Windley and Dasgupta2003) from within the Mozambique Belt in northwestern Kenya, an interpretation that corroborates that of Kröner & Stern (Reference Kröner and Stern2004), who reported similar ages from this belt. This is in agreement with the dominantly (87 % of analysis) juvenile mantle signatures for zircons of this age from both the Lapur and Muruanachok sandstones. The magmatic emplacement ages in the Mozambique Belt are also in agreement with the Neoproterozoic ages from both the Lapur and Muruanachok sandstones, which range from 998 Ma to 558 Ma and 985 Ma to 562 Ma, respectively. The high-grade metamorphic events recorded in the Mozambique Belt in Kenya (Hauzenberger et al. Reference Hauzenberger, Sommer, Fritz, Bauernhofer, Kröner, Hoinkes, Wallbrecher and Thöni2007) appear to have had limited effect on the supposed Cretaceous ‘Turkana Grits’ in the basin as shown by the few zircons with very low Th/U ratios (Fig. 6), indicative of a metamorphic provenance.
Our findings suggest that the basement rocks of the Mozambique Belt underlying and on the flanks of the Turkana Basin are the primary provenance source for the zircons of both sandstones. Furthermore, the zircons of Pan-African (Neoproterozoic) age yielded initial ɛHf(t) values of between −25.61 and +11.2 (Fig. 10), suggestive of derivation from a mixture of reworked Pan-African crust and juvenile crustal materials, consistent with Mozambique Belt lithologies (Cahen et al. Reference Cahen, Snelling, Delhal and Vail1984; Harris et al. Reference Harris, Hawkesworth and Ries1984; Key et al. Reference Key, Charsley, Hackman, Wilkinson and Rundle1989; Grantham et al. Reference Grantham, Maboko, Eglington, Yoshida, Windley and Dasgupta2003). Finally, the morphology of Neoproterozoic zircons from both the Muruanachok and Lapur sandstones is typified by subhedral–euhedral grains (Fig. 5), suggestive of proximal transport from local sources or minimal sediment recycling. Considered together, the provenance of the Lapur and Muruanachok sandstones is interpreted as being localized from the Mozambique Belt.
5.c. Tectonic implications
The East African Rift System is believed to have initiated by c. 45–35 Ma, based in part on the isotopic dating of the oldest volcanic rocks in the rift, which are thought to have formed as a result of the development of the African Superplume beneath eastern Africa (e.g. Ebinger, Reference Ebinger1989; Ebinger & Ibrahim, Reference Ebinger and Ibrahim1994; Chorowicz, Reference Chorowicz2005). The Lapur Sandstone is typically thought to be Cretaceous, and hence its depositional history is usually not tied to the East African Rift System, although some workers have suggested the presence of pre-Cenozoic rifts underneath it (Cahen et al. Reference Cahen, Snelling, Delhal and Vail1984; Bosworth, Reference Bosworth1992; Morley et al. Reference Morley, Wescott, Stone, Harper, Wigger and Karanja1992; Boschetto et al. Reference Boschetto, Brown and McDougall1992; McDougall & Brown, Reference McDougall and Brown2009; Feibel, Reference Feibel2011; Tiercelin et al. Reference Tiercelin, Potdevin, Thuo, Abdelfettah, Schuster, Bourquin and Ruffet2012a). The recovery of six Paleocene detrital zircon grains from the Lapur Sandstone provides strong evidence for a major disconformity within the Lapur Sandstone, separating Cretaceous from Palaeogene depositional units, which also corroborates the presence of pre-Eocene strata underneath the East African Rift System. This work demonstrates that the depositional history of the Lapur Sandstone is more complex than previously thought. The deposition of the upper parts of the Lapur Sandstone may reflect the earliest stages of rift reactivation associated with the development of the East African Rift System in Palaeogene time (P Thuo, unpub. Ph.D. thesis, Univ. Western Brittany, 2009) or the Central African Rift System as suggested by others (e.g. Reeves et al. Reference Reeves, Karanja and Macleod1987). Although more work is necessary to confirm this, the presence of a discrete Paleocene population (n = 5) of detrital zircons at ∼57 Ma may indicate that initial volcanism associated with the development of the African Superplume beneath eastern African may have started prior to 45 Ma, possibly by as much as 12 Ma earlier than most accounts. Alternatively, these grains may derive from an unknown volcanic source in central Africa. These young magmatic zircons in the top of the Lapur Sandstone demonstrate the complexities between the two rift systems in the Turkana region, providing support for the presence of pre-Eocene strata beneath the East African Rift System, and in particular, highlighting the need for further geochronological work.
6. Conclusions
Based on our integrated approach incorporating framework petrography, U–Pb geochronology, Lu–Hf isotope ratios and zircon trace-element geochemistry on outcrop samples from the Lapur and Muruanachok sandstones in the Turkana Basin, the following conclusions are drawn:
(1) The Lapur and Muruanachok sandstones are predominantly sourced from felsic igneous rocks as indicated by the chondrite-normalized REE patterns, Lu–Hf analysis and U–Pb age data.
(2) The dominant provenance is attributed to the Neoproterozoic Mozambique Belt, which formed during the Pan-African Orogeny. Comparable initial ɛHf(t) values, a ubiquity of fresh, euhedral zircon grains and palaeocurrent orientations in the studied sandstone units point to proximal transport from local sources within the Mozambique Belt of Kenya.
(3) Sample Bow-24 suggests that parts of the Lapur strata may be interfingering with the Muruanachok Sandstone or, more likely, that the Lapur and Muruanachok sandstones are stratigraphically separate rather than laterally correlative units. All Lapur samples show similar provenance to one another except the basal Lapur sample Bow-24, which is indistinguishable from the Muruanachok samples, suggesting that the Lapur Sandstone mapped at the Bow-24 location may actually be the upper part of the Muruanachok Sandstone.
(4) A robust population of late Paleocene zircons from the upper part of the Lapur Sandstone suggests that a major discontinuity, which has been observed in the sandstone by previous workers near the top of the unit, most likely serves as the boundary between two discrete depositional units. Based on this, we propose an informal subdivision of the Lapur Sandstone into lower and upper members of Cretaceous and Palaeogene ages, respectively.
(5) Paleocene zircons from the Lapur Sandstone (∼57 Ma) pre-date the oldest known volcanic rocks in the Turkana Rift (∼45 Ma). The presence of these zircons suggests an older pre-Eocene volcanic source beneath the East African Rift System, which probably is coeval with older volcanism from southern Ethiopia. Alternatively, these grains may have been derived from outside the basin, possibly derived from air-fall ash deposits associated with isolated volcanic centres somewhere in northern or central Africa. However, we believe the evidence provided in this study points to a SSE volcanic source from within the Anza Rift Basin.
Supplementary material
To view supplementary material for this article, please visit https://doi.org/10.1017/S0016756818000663.
Acknowledgements
We thank Executive Editor Dr Chad Deering and two anonymous reviewers who really provided very constructive and beneficial reviews, which significantly improved the manuscript. We gratefully acknowledge Bowleven plc for funding this study and for permission to publish the results. This study is part of the corresponding author’s Ph.D. study and benefited from the Australian Government Research Training Programme Scholarship and it is gratefully acknowledged. Ioan Sanislov is thanked for his assistance in processing the Lu–Hf isotope data for this study. Yanbo Cheng and Isaac Corral are acknowledged for their assistance in processing the zircon trace-element data. The authors also acknowledge the Advanced Analytical Centre of James Cook University Townsville, especially Yi Hu, Kevin Blake and Shane Askew for their assistance with zircon imaging, U–Pb age dating, Lu–Hf isotope geochemistry and trace-element analysis. Michael S Hayford and Teirmoor N. Dehkordi are acknowledged for their assistance during after-hours laser ablation analysis.