Implications
This study presents the genetic diversity of Salers breed in Spain originated from a very low small number of individuals and evaluates if a loss of genetic variation could be occurred. In general, our results could have shown high genetic diversity in Spanish Salers as a first step toward signaling the adequacy of this population for breeding and selection strategies.
In addition, Spanish Salers cattle have shown genetic markers representative of African zebu cattle breeds. These markers were also found in other breeds from France and therefore this results support the previously postulated theory of an African heritage in southern European breeds.
Introduction
Salers are a French native and dual-purpose (beef/dairy) breed which originates from the high Massif Central in the Auvergne region of France. It is a rustic breed used for beef production in mountainous areas of central France that shows excellent maternal aptitudes, hardiness and satisfactory milk yield (Petit and Liénard, Reference Petit and Liénard1988) whose milk is also traditionally used to produce French (AOC) Controlled Designation of Origin cheese called Salers.
Salers breed dates from the middle of the 19th century and its Herd Book was created in 1906. Since then, Salers have been widely spread in France and to nearly 30 countries on five continents (Salers Evolution Group, 1992). Salers breed was first introduced to the north of Spain in 1985 with only 15 individuals from France. The population has grown to ~22 000 individuals mainly focused in the northern Iberian Peninsula. Although afterwards, more animals were imported from France for breeding, a founder effect could have occurred as a consequence of the low number of first reproducers. Genetic diversity is thought to decrease due to founder effects (Böhme et al., Reference Böhme, Schneeweiss, Fritz, Schlegel and Berendok2007) and theoretically, we could expect changes in allele frequencies due to genetic drift. In present case, Spanish Salers genetic characterization is needed to evaluate whether a founder effect has occurred, or the importation of relatively few animals and good breeding management has been enough to maintain mutation-drift equilibrium. This data could be interesting in the idea of future selection programs for economic animal improvement in Spanish Salers.
The genetic characterization of the Salers breed and its relationships to other European cattle breeds has previously been studied by different approaches. Grosclaude et al. (Reference Grosclaude, Aupetit, Lefebvre and Meriaux1990) and Blott et al. (Reference Blott, Williams and Haley1998) analyzed polymorphisms from blood groups, milk proteins and serum to discriminate between cattle breeds, Salers included. Microsatellite loci are more variable than biochemical markers, thus permit fine-scale analysis of genetic structure and the precise measurement of genetic variation (Moazami-Goudarzi et al., Reference Moazami-Goudarzi, Laloe, Furet and Grosclaude1997). Even so, few Salers genetic studies have been published so far. Three studies have included genetic diversity of French Salers by using microsatellite loci in few samples (Canon et al., Reference Canon, Alexandrino, Bessa, Carleos, Carretero, Dunner, Ferran, Garcia, Jordana, Laloe, Pereira, Sanchez and Moazami-Goudarzi2001; Cymbron et al., Reference Cymbron, Loftus, Malheiro and Bradley2005; Amigues et al., Reference Amigues, Boitard, Bertrand, Sancristobal and Rocha2011) but exhaustive diversity genetic data of Spanish Salers have not yet been reported and preliminary parentage testing data has only been published (Gamarra et al., Reference Gamarra, López-Oceja, Jiménez-Moreno and de Pancorbo2015). Thus, this study centers itself on the evaluation of a founder effect in Salers population that could describe the breeding management used in Spain for a recently introduced breed. In addition, it contributes to the knowledge of the genetic relationships between Spanish Salers and other European breeds.
Material and methods
Sample collection and DNA extraction
Blood samples of 403 Salers cattle breed individuals from 12 different herds were analyzed. Bovine genomic DNA was extracted from blood using salting out extraction with Gentra PureGene Blood kit (Qiagen, Valencia, CA, USA) following the protocol handbook. The DNA samples were stored at −20°C before use.
Microsatellite amplification and analysis
The microsatellites used are included in the international selected set of markers recommended by Food and Agriculture Organization and International Society of Animal Genetics for cattle diversity studies. Amplification of microsatellites was performed by multiplex PCR reaction using commercial Bovine GenotypesTM Panel 3.1 (Finnzymes Diagnostics, Espoo, Finland) according to the manufacturer’s instructions. Capillary electrophoresis was performed on an ABI PRISM 3130 Genetic Analyzer (Applied Biosystems, Foster City, CA, USA) using internal size standard GS LIZ500 (Applied Biosystems). Fragment analysis was determined by GeneMapper v4.0. Alleles were coded according to reference samples.
TGLA53 marker showed high inhibition during the amplification. Thus, TGLA53 microsatellite was sequenced in 10 samples of uncertain genotype to identify any possible single nucleotide polymorphism (SNP) in flanking regions. It was amplified with forward 5′ACTCTATTGACCATTGTAGGCTC3′ and reverse 5′TTATAGCATTTATCTCCCACCCTC3′ primers to a concentration of 0.1 µM, MgCl2 at 2.5 mM, buffer 1×, and dNTPs at 0.2 mM, in a C1000TM Thermal Cycler (Bio-Rad, Foster City, CA, USA) at 95°C for 3 min; 30 cycles at 95°C for 30 s, 64°C for 30 s and 72°C for 90 s; final extension at 72°C for 7 min. These products were purified by vacuum ultrafiltration using MultiScreen® PCRμ96 plates (Millipore, Billerica, MA, USA) and sequenced using BigDye® Terminator v3.1 Cycle Sequencing Kit (Applied Biosystems) on an ABI3130 Genetic Analyzer (Applied Biosystems) using the Sequencing Analysis v5.2. All the sequences have been deposited into GenBank under accession numbers KP874721-KP874730.
Statistical analysis
GENEPOP 4.2 software (Raymond and Rousset, Reference Raymond and Rousset1995) was used to test for deviations from HW equilibrium using exact test of Guo and Thompson (Reference Guo and Thompson1992). The program performed a probability test using a Markov chain (dememorization 5000, batches 100, iterations per batch 1000). Significant levels were calculated per locus and per breed. Bonferroni’s procedures were applied when necessary.
The FSTAT 2.9.3 software (Goudet, Reference Goudet1995) was used to calculate the number of alleles per locus (Na), allelic richness and inbreeding coefficient (FIS) per locus and the F-statistics (Weir and Cockerham, Reference Weir and Cockerham1984) estimates in all breeds. Expected (He) and observed (Ho) heterozygosities and polymorphism information content were calculated with Cervus 3.0 (Kalinowski et al., Reference Kalinowski, Taper and Marshall2007).
BOTTLENECK (Piry et al., Reference Piry, Luikart and Cornuet1999) was used to study a possible founder effect by determining a significant number of loci with heterozygosity excess. Sign test and Wilcoxon’s sign rank test (Cornuet and Luikart, Reference Cornuet and Luikart1996) were performed under stepwise mutation model (SMM) and two-phase model (TPM; 95% SMM with 5% multi-step mutations and a variance among multiple steps of 12) which is considered best for microsatellite data (Di Rienzo et al., Reference Di Rienzo, Peterson, Garza, Valdes, Slatkin and Freimer1994; Piry et al., Reference Piry, Luikart and Cornuet1999). In addition, a qualitative descriptor of the allele frequency distribution (mode-shift indicator) which discriminates bottlenecked populations from stable populations (Luikart et al., Reference Luikart, Sherwin, Steele and Allendorf1998) was used.
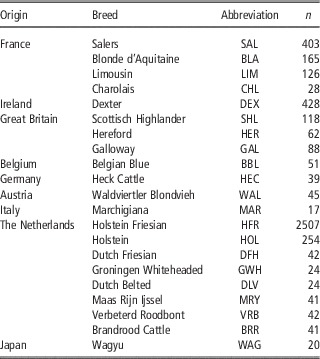
The Spanish Salers were analyzed in comparison with 20 breeds previously described by Van de Goor et al. (Reference Van de Goor, Koskinen and van Haeringen2011), shown in Table 1. Reynolds genetic distance measures were computed by Arlequin 3.5 (Excoffier and Lischer, Reference Excoffier and Lischer2010) and a neighbor-joining (NJ) tree was constructed. TreeFit (Kalinowski, Reference Kalinowski2009) was used to create NJ tree and calculate R 2 to quantify the degree to which bifurcating trees distort genetic relationships between populations. Genetic differentiation among samples was estimated using R ST (Rousset, Reference Rousset1996) with FSTAT v.2.9.3.
Origin, abbreviation and number of samples (n) of Spanish Salers and other breeds used for comparison included in this study

The existence of distinct genetic groups using multilocus genotypes was tested using a Bayesian model-based clustering method in STRUCTURE 2.3.4 (Pritchard et al., Reference Pritchard, Stephens and Donnelly2000). The probability of an admixture model was tested for clusters (K) ranging from 1 to 21. Models were tested using 20 independent Markov chain Monte Carlo (MCMC) simulations, each consisting of 1×10⁵ iterations after a burn-in of 5×10⁵ iterations. The optimal value of K was selected using the approach ΔK of Evanno et al. (Reference Evanno, Regnaut and Goudet2005) and the web interface Structure Harvester (Earl and VonHoldt, Reference Earl and VonHoldt2012). An animal was attributed to a given cluster when the proportion of its genotype in the cluster (qK) was higher than an arbitrary cutoff value of 80%, the same threshold employed in previous studies (Vigouroux et al., Reference Vigouroux, Glaubitz, Matsuoka, Goodman, Sanchez and Doebley2008). A structure graphical bar plot of membership coefficients for populations and individuals was generated using the Distruct program (Rosenberg, Reference Rosenberg2004). A correspondence analysis (CA) was used in conjunction with STRUCTURE 2.3.4. This multivariate method leads to a simultaneous representation of breeds and loci as a cloud of points in a metric space. Genetix 4.05.2 (Belkhir et al., Reference Belkhir, Borsa, Chikhi, Raufaste and Bonhomme2004) was used to represent the three-dimensional plot.
Results
Genetic characterization of Spanish Salers breed
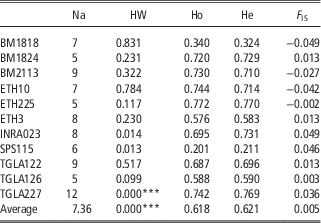
A total of 12 microsatellite loci (BM1818, BM1824, BM2113, ETH10, ETH225, ETH3, INRA023, SPS115, TGLA122, TGLA126, TGLA227 and TGLA53) were analyzed in 403 Spanish Salers individuals. All the loci were polymorphic and 81 alleles were detected. Number of alleles per locus ranged between five (BM1824, ETH225 and TGLA126) and 12 (TGLA227) with an average of 7.36 as shown in Table 2. Rare alleles, defined as those with frequencies below 5%, were observed and remarkable non-European alleles were found in some microsatellite markers. The African zebu BM2113-131 and BM2113-143 alleles described by MacHugh (Reference MacNeil, Cronin, Blackburn, Richards, Lockwood and Alexander1996) were observed with allelic frequencies of 0.488 and 0.064, respectively. TGLA53 genotype determination was doubtful due to three stutters per allele and the unbalanced size of alleles. To detect any possible SNP that could inhibit the binding of the primers for the amplification of this microsatellite locus, 122 bases upstream and 92 bases downstream of the flanking regions were sequenced. No SNPs were detected so finally TGLA53 was excluded from the study.
Statistical parameters of Spanish Salers sample based on 11 microsatellite loci

Na=number of alleles at the locus; HW=Hardy–Weinberg equilibrium probability (Bonferroni’s correction P<0.0045); Ho=observed heterozygosity; He=expected heterozygosity; F IS=inbreeding coefficient.***P < 0.001.
HW equilibrium was respected in all markers when Bonferroni’s correction was applied, except for the locus TGLA227 (Table 2). The expected heterozygosity across all markers varied from 0.211 (SPS115) to 0.770 (ETH225), where the average expected heterozygosity was 0.621. TGLA227 showed deficit of heterozygotes but was not significant (F IS=0.036, P>0.05), whereas BM1818, BM2113, ETH10 and ETH225 showed non-significant heterozygote excess. When all loci were combined, Salers inbreeding coefficient did not differ statistically from 0 (F IS=0.005), indicating not significant excess or deficit of heterozygotes (P>0.0045). The absence of significant deviations from HW equilibrium shows that the Spanish Salers do not seem to be affected by the low number of founder individuals and its fast growing population.
Founder effect analysis
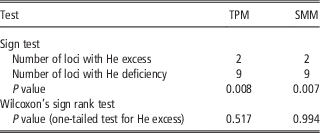
BOTTLENECK software was used to study a possible founder effect in Spanish Salers (Table 3). Sign test and Wilcoxon’s sign rank test were performed under SMM. TPM of mutation was also applied as most microsatellite data sets fit the TPM better than other mutation models (Di Rienzo et al., Reference Di Rienzo, Peterson, Garza, Valdes, Slatkin and Freimer1994). Sign test showed heterozygosity excess in two loci under SMM (P=0.007) and TPM (P=0.008), although these results were not significant when Bonferroni’s correction for multiple comparisons was applied (P<0.0045). The one-tailed Wilcoxon’s sign rank test revealed no significant deviation from mutation-drift equilibrium. The mode-shift indicator test was also utilized as a second method to detect potential founder effect. Graphical representation using allelic class and proportion of alleles showed a normal L-shaped distribution where alleles with low frequencies were the most abundant (Supplementary Figure S1). The performed tests verify that Spanish Salers individuals do not show founder effect although it has been recently introduced into the Iberian Peninsula. This is probably due to a satisfactory crossing procedure with the incorporation of new Salers reproducers to this population, as revealed by the observed inbreeding coefficient (F IS=0.005).
Different tests for founder effect analysis in Salers cattle

TPM=two-phase model; SMM=stepwise mutation model; He=heterozygosity.
Genetic variation and relationship among breeds
Allele frequencies from European breeds were taken from Van de Goor et al. (Reference Van de Goor, Koskinen and van Haeringen2011) and used for the calculation of diversity parameters as described in the ‘Material and methods’ section. French Salers allele frequencies were not available for the same panel of microsatellite markers used in this study. However, diversity parameters published (observed heterozygosity, expected heterozygosity, number of allele per locus, F ST and R ST) from Amigues et al. (Reference Amigues, Boitard, Bertrand, Sancristobal and Rocha2011) were used to compare our Spanish population and French Salers. The mean number of alleles per locus for Spanish Salers was 7.36 (Table 1), considerably higher than the value for all breeds, being only lower than Holstein, Friesian and Limousin values (data not shown). The allelic richness was computed, as an estimate of the number of alleles per locus corrected by sample size, that allows a better comparison among breeds (Supplementary Table S1). This value was also higher in Spanish Salers (5.129) than the mean value calculated for all European breeds (4.985). In addition, other French breeds also showed higher allelic richness than this mean value.
African zebu alleles were found in French breeds as in our Spanish Salers sample. BM2113-131 allele, highly present in Spanish Salers (0.488), was also present in Limousin (0.222), Blonde d’Aquitaine (0.124) and Charolais (0.054). BM2113-143 allele was higher in French Blonde d’Aquitaine (0.167) than in Spanish Salers (0.064), whereas it was lower in Limousin (0.036). In contrast, these alleles were not found in other breeds, except Waldviertler breed that showed a high frequency (0.611) in BM2113-131. The results presented above could be of interest to support previous hypotheses (Cymbron et al., Reference Cymbron, Loftus, Malheiro and Bradley2005) about the spread of agropastoralism across France.
Average expected heterozygosity varied in European breeds from 0.576 in Heck to 0.736 in Limousin cattle (Supplementary Table S2). Spanish Salers heterozygosity (0.621) was lower than the mean value for all breeds (0.661), Limousin (0.736) and Blonde d’Aquitaine (0.729) but it was close to Charolais (0.622). Value obtained for French Salers by Amigues et al. (Reference Amigues, Boitard, Bertrand, Sancristobal and Rocha2011) was 0.73, higher than Spanish Salers even though they analyzed a lower number of individuals.
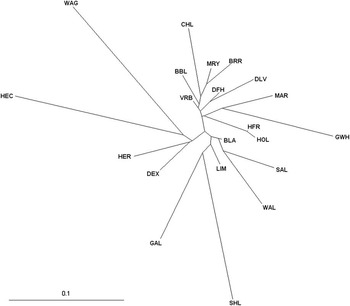
Data of European cattle breeds from Van de Goor et al. (2011) and our Spanish Salers data were used to test genetic substructure. The global deficit of heterozygotes across all populations (F IT) amounted to 10.9%. The estimated mean values for F ST (0.106) were similar to the absolute values determined by R ST (0.105) indicating that 10.5 % of the total genetic variation corresponds to differences among the breeds and 89.5% arose from differences among individuals (Supplementary Table S3). Differences in Reynolds genetic distances for each pair of breeds were mostly significant (P<0.001) which means that the breeds can be considered genetically independent (Supplementary Table S4). Salers breed have shown to be genetically more similar to Blonde d’Aquitaine (R ST=0.061) than to other French breeds (Limousin, R ST=0.084; Charolais, R ST=0.142). Figure 1 shows the graphic representation of the NJ phylogenetic tree constructed with Reynolds distances. Calculated R 2 was 0.933, being close to 1.0 which means that the statistical significance represented in the tree was a good summary of the genetic relationships shown in the distance matrix as described by Kalinowski (2009). The NJ tree displayed a branch where Spanish Salers grouped with French breeds (Blonde d’Aquitaine and Limousin) and Waldviertler breed. Charolais was the only French breed that was not included in this branch as it showed to be closer to Belgian Blue and other Dutch breeds.
Neighbor-joining tree based on the Reynolds genetic distances between Salers and other breeds.

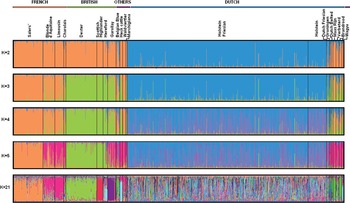
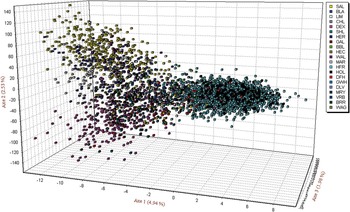
Clustering analysis using a Bayesian approach (STRUCTURE 2.3.1) was performed with an increasing number of inferred clusters (K=1 to 21). Salers breed does not show a partitioning of genetic variability according to geographical origin. All Salers individuals showed a membership that was equally distributed among the Salers cluster, with the exception of few animals from a particular herd of this Spanish population. For all breeds, the potential structure is displayed in the Figure 2. Structure’s posterior probabilities of K, as a log-likelihood given K clusters and the corresponding ΔK statistic (Evanno et al., Reference Evanno, Regnaut and Goudet2005), showed maximal ΔK occurred at K=2 (Supplementary Figure S2) and 95.9% of animals were attributed to one of the two clusters using a cutoff value of 80% ancestry for assignment. These clusters were inferred only on the basis of allele frequency differences. Furthermore, a second structure analysis was conducted to study the model clustering using a smaller sample for Friesian Holstein and Holstein breeds whose initial large samples could have disturbed the global analysis. In this case, ΔK was also observed at K=2 and with the cutoff value of 80% ancestry for assignment, 89.6% of animals were attributed to one of the two clusters: 1130 individuals to a cluster where French breeds were grouped and 666 individuals to the other cluster. CA plot was performed including all animals (Figure 3). A total 9.45% of variance was accounted by the first three dimensions. Axis 1 separates French and British islands breeds (positive) from Holstein and Friesian (negative), while Axis 2 separates French breeds (positive) and British breeds (negative).
Population partitioning suggested by STRUCTURE based on the 11 microsatellites. Each individual animal is represented by a single vertical line divided into K colors, where K is the number of clusters assumed, and colored segment represents the individual’s estimated proportion of membership to a particular cluster. Black lines separate individual populations whose names are indicated above the diagram.

Plot of multivariate correspondence analysis calculated over all individuals for 21 populations.

Discussion
The Salers breed has been widely introduced to many countries showing a high population increase due to its good productive characteristics and excellent adaptive capacity. This study is the first genetic characterization and the first founder effect analysis of Spanish Salers as a foreign breed in the Iberian Peninsula that establishes phylogenic relationships with European breeds. We studied microsatellite loci as they are highly polymorphic, although those markers have also shown some difficulties for allele size calling (Sanz et al., Reference Sanz, Martin-Burriel, Cons, Reta, Poblador, Rodellar and Zaragoza2014). Thus, new advances in high-throughput sequencing and excellent repeatability in SNP markers (Tsuchihashi and Dracopoli, Reference Tsuchihashi and Dracopoli2002) have originated consistent alternatives for genetic characterization in cattle (Gautier et al., Reference Gautier, Laloe and Moazami-Goudarzi2010). Even so, this study has been accomplished using microsatellite markers as they are still the standard in many breeding programs and wide bibliography has allowed us comparison with other breeds.
Genetic characterization of Spanish Salers breed
The genotyping was performed by the analysis of 12 loci microsatellites, but the TGLA53 microsatellite locus did not render results. The region of attachment of primers was sequenced to study if some SNP in primer sequence target could have inhibited the PCR amplification. However, no SNPs were detected interfering the binding of the primers. So, an explanation based on the DNA sequence of the flanking regions was not obtained. The marker was excluded from analysis due to the low and uncertain efficiency of genotype determination as previously described by other authors (Putnova et al., Reference Putnova, Vrtkova, Srubarova and Stehlik2011; Sanz et al., Reference Sanz, Martin-Burriel, Cons, Reta, Poblador, Rodellar and Zaragoza2014).
We only found heterozygote deficit in TGLA227 marker. Heterozygote deficit might be explained by inbreeding due to a small number of reproducers, genetic drift and (or) population substructures as described by Maudet et al. (Reference Maudet, Luikart and Taberlet2002). Thus, HW equilibrium was studied by cattle herd. TGLA227 heterozygote deficit was only found in one herd. This herd could have maintained certain reproductive isolation that could explain the genetic pattern encountered, although it was not extended to the total Spanish Salers sample.
Despite the difficulties in comparing literature results, as they have been obtained with different marker sets, the wide literature on genetic variability of cattle breeds shows that heterozygosity estimates vary from 0.600 to 0.750 (Dalvit et al., Reference Dalvit, De Marchi, Dal Zotto, Zanetti, Meuwissen and Cassandro2008). In Spanish Salers, average heterozygosity was 0.621, moderate in comparison with the values reported for other European breeds. Spanish Salers value was higher than value showed by Cymbron et al. (Reference Cymbron, Loftus, Malheiro and Bradley2005) in French Salers (0.55) and consistent to the value reported by Cañon et al. (Reference Canon, Alexandrino, Bessa, Carleos, Carretero, Dunner, Ferran, Garcia, Jordana, Laloe, Pereira, Sanchez and Moazami-Goudarzi2001) (0.631). Amigues et al. (Reference Amigues, Boitard, Bertrand, Sancristobal and Rocha2011) showed higher value (0.67), although these studies were analyzed with other markers and in smaller French samples. This author showed an average number of alleles per locus of 5.6, while our study had higher value (7.36) but sample size should also be considered.
Several publications have reported the presence of zebu and African-type microsatellite alleles in Iberian cattle breeds (Beja-Pereira et al., Reference Beja-Pereira, Alexandrino, Bessa, Carretero, Dunner, Ferrand, Jordana, Laloe, Moazami-Goudarzi, Sanchez and Canon2003; Ginja et al., Reference Ginja, Telo da Gama and Penedo2009). Our study confirms the presence of African zebu-diagnostic alleles in Spanish Salers, alleles also observed in southern French breeds from Van de Goor et al. (Reference Van de Goor, Koskinen and van Haeringen2011). These African-type alleles are consistent with an African heritage also shown in mitochondrial DNA studies. T1 haplogroup, almost fixed in African cattle, has also been found in southern European breeds (Portugal, Spain, Greece and Italy) (Cymbron et al., Reference Cymbron, Freeman, Isabel Malheiro, Vigne and Bradley1999; Beja-Pereira et al., Reference Beja-Pereira, Caramelli, Lalueza-Fox, Vernesi, Ferrand, Casoli, Goyache, Royo, Conti, Lari, Martini, Ouragh, Magid, Atash, Zsolnai, Boscato, Triantaphylidis, Ploumi, Sineo, Mallegni, Taberlet, Erhardt, Sampietro, Bertranpetit, Barbujani, Luikart and Bertorelle2006; Lopez-Oceja et al., Reference Lopez-Oceja, Muro-Verde, Gamarra, Cardoso and de Pancorbo2015) and in French Limousin (Achilli et al., Reference Achilli, Bonfiglio, Olivieri, Malusa, Pala, Hooshiar Kashani, Perego, Ajmone-Marsan, Liotta, Semino, Bandelt, Ferretti and Torroni2009). This could suggest that North African cattle may have left a genetic signature in southern Europe based on the hypothesis of Neolithic dispersal through the Mediterranean route (Zilhao, Reference Zilhao1993) and historical migrations (Cymbron et al., Reference Cymbron, Freeman, Isabel Malheiro, Vigne and Bradley1999). In agreement with those hypotheses, the presence of zebu BM2113-143 allele in Spanish Salers and French breeds as well as the high frequency of zebu BM2113-131 allele could be explained by the same zebu gene flow from the Mediterranean area. In fact, SNP data is in agreement with the postulated migration route by which the Neolithic culture expanded toward France as southwestern French breeds appear closely related to the Mediterranean colonization route (Gautier et al., Reference Gautier, Laloe and Moazami-Goudarzi2010). In addition, NJ dendrogram of Figure 1 shows Reynolds genetic distances from Salers, Blonde d’Aquitaine and Limousin breeds where they group together probably due to their high frequency in African zebu allele BM2113-131.
Founder effect analysis
Salers breed has been recently introduced to Spain in 1985. The number of individuals coming from France was very low, so a potential genetic founder effect cannot be discarded. As showed in Table 3, the founder effect was investigated using the SMM as it assumes that a mutation results in a change in one repeat unit either by insertion or deletion. TPM was also considered because it allows mostly one-step mutations, but also a small percentage (5% to 10%) of multi-step changes. Sign test that suffers from low statistical power (Piry et al., Reference Piry, Luikart and Cornuet1999) revealed significant deviation under SMM and TPM models (uncorrected). However, after Bonferroni’s correction (P<0.0045), none of the models showed significant deviation. Using the Wilcoxon’s rank test, a non-parametric test with relatively high power, the probability values were not significant under both models, thus rejects in both cases a founder effect. The mode-shift indicator test was also utilized as an additional method to detect a potential founder effect. This test discriminates populations with bottleneck or founder effect from stable populations as the populations without founder effect being near mutation-drift equilibrium, are expected to have a large proportion of alleles with low frequency. Normal L-shaped graphical representation where most abundant alleles had low frequencies (0.01 to 0.1) was observed, suggesting that studied population is under mutation-drift equilibrium (Supplementary Figure S1).
A reduction of gene diversity (He, or HW heterozygosity) (Böhme et al., Reference Böhme, Schneeweiss, Fritz, Schlegel and Berendok2007) could be expected owing to a founder effect, and also a reduction on the allele numbers (Na) (Piry et al., Reference Piry, Luikart and Cornuet1999). Gene diversity (He) observed in Spanish Salers (0.621) was slightly lower than French Salers (0.67) from Amigues et al. (Reference Amigues, Boitard, Bertrand, Sancristobal and Rocha2011), but allele number per locus was higher for Spanish Salers (7.36) than for French population (5.6). Therefore, the gene diversity results did not support a founder effect according to Spanish Salers. This is reinforced by the fit to HW equilibrium observed in Spanish Salers, except for one particular herd (P=0.0011).
Although Salers has been recently introduced to Spain, constant incorporation of new reproducers from France could have increased the effective population. Furthermore, this breeding management could have avoided negative effects from the reduced founder population and a possible inbreeding. Thus, high genetic diversity in Spanish Salers highlights the resources of this population, which looks toward future breeding and selection programs.
Genetic variation and relationship among breeds
High heterozygosity was observed in French breeds (Limousin 0.736; Blonde d’Aquitaine 0.729 and Charolais 0.622) compared with Salers, whose heterozygosity estimate was reasonable compared with the values reported in American Salers by MacNeil et al. (Reference MacHugh2007) and much higher than observed by Cymbron et al. (Reference Cymbron, Loftus, Malheiro and Bradley2005) in French Salers.
Despite long population histories in their native countries and unique morphological traits, lack of controlled breeding in the second part of the 20th century resulted in some dispersion of related breeds. However, our results revealed that Salers appear to be more related to Blonde d’Aquitaine as previously described in biochemical polymorphisms (Grosclaude et al., Reference Grosclaude, Aupetit, Lefebvre and Meriaux1990). Interestingly, Amigues et al. (Reference Amigues, Boitard, Bertrand, Sancristobal and Rocha2011) showed comparable genetic differentiation in French Salers and Blonde d’Aquitaine (R ST=0.07) and French Salers and Limousin (R ST=0.07) based on microsatellite data. Deficit of heterozygotes was also similar to Amigues et al. (Reference Amigues, Boitard, Bertrand, Sancristobal and Rocha2011) (F IT=0.091), when we computed it only across same breeds (Spanish Salers, Blonde d’Aquitaine, Limousin and Holstein) (F IT=0.095). Therefore, previous genetic differentiation and deficit of heterozygotes do not seem to be very different from our results. However, Charolais was unpredictably separated from this French group (Figure 1), but such results are not entirely unanticipated. Wiener et al. (Reference Wiener, Burton and Williams2004) found relationship between breeds that they do not primarily cluster according to geographical origin and Gautier et al. (Reference Gautier, Laloe and Moazami-Goudarzi2010) displayed that Charolais branched with a less reliable node with breeds from southwestern France (Salers and Blonde d’Aquitaine). Scottish breeds (Highland and Galloway) do not show strong affinities with other breeds from the British Isles (Dexter and Hereford). In Hereford, it may reflect historical genetic input from northern Europe, which is known to have occurred before the establishment of the Hereford herd in 1846 (Heath Agnew, Reference Heath Agnew1983). The Wagyu branch is in accordance with expected tracing the breed’s origin to cattle from Japan. Meanwhile, Heck cattle is also shown apart from other European breeds as it is known that Heck cattle was the result of the first attempt to breed back domestic cattle to the ancestral aurochs (Bos primigenius).
A Bayesian MCMC approach, represented in Figure 2, was used to examine the distinctiveness of Salers and other breeds. STRUCTURE software genetic clusters and Evanno method showed a maximal ΔK at K=2, indicating 2 as the most likely number of ancestral populations for the 21 breeds analyzed (Supplementary Figure S2). A clear distinction was identified between French breeds and British Isles breeds at K=3, corresponding to their different geographical distributions. At K=3, French breeds and Waldviertler breed were grouped together probably due to the African alleles described previously. In fact, a clear agreement of STRUCTURE clustering with the genetic distance analysis and consistent with major clusters of the NJ distance phenogram was observed in Figure 1. CA plot (Figure 3) was similarly in agreement with Bayesian structure method when K=3 was observed (Figure 2). French breeds appeared to cluster separately from British Isle breeds, whereas other Dutch breeds were dispersed on the center of the plot but close to a big cluster of Holstein Friesian. Populations were mostly separated in correspondence to their geographical origin, although some exceptions were observed. For instance, similar pattern from structure analysis was shown in Waldviertler breed that was closer to Salers and French breeds. Structure from Amigues et al. (Reference Amigues, Boitard, Bertrand, Sancristobal and Rocha2011) differentiated Salers, Blonde d’Aquitaine and Limousin at K=4. In contrast, our results showed that Blonde d’Aquitaine, Limousin and Charolais seems to be more related, as Charolais was only separated at K=10, whereas Blonde d’Aquitaine and Limousin still clustered together at K=21. At this level, British breeds are in different clusters showing high differentiation probably caused by their island isolation. Finally, dairy Friesian Holstein, Holstein and Dutch Friesian were assembled in the same cluster, whereas other Dutch breeds group together and Japanese Wagyu breed was singularly isolated. The large amount of Friesian Holstein and Holstein individuals in the present study could have disturbed clustering, therefore the sample size of these two breeds was reduced to n=100, respectively (average population size for all breeds). In this case, Evanno method also showed same ancestral K at 2.
In conclusion, the current study is the first detailed analysis of the genetic diversity of Salers breed in the Iberian Peninsula. An interesting finding is the high frequencies of African alleles not previously reported in French Salers. This study reinforces the understanding of the genetic characterization of Salers and its relationships with European breeds. Finally, we found that the heterozygosity of Spanish Salers reveals the absence of a founder effect in the expansion of the breed to Spain indicating that economically important traits are probably preserved.
Acknowledgments
The authors gratefully acknowledge the financial support received from the scholarships provided by the Direction of Agriculture and Livestock from the Department of Economic Development and Competitiveness (Basque Government). A grant from the University of the Basque Country UPV/EHU (ELDUNANOTEK UFI11/32). Technical and human support provided by SGIker (UPV/EHU, MICINN, GV/EJ, ESF) is also gratefully acknowledged. They are also grateful to the Spanish Salers Association for the samples provided and English revision done by Thomas Rivers.
Supplementary material
For supplementary material/s referred to in this article, please visit http://dx.doi.org/10.1017/S1751731116001063