


Introduction
Lentil (Lens culinaris Medik. subsp. culinaris), a cool season food legume cultivated around the world, is ranked fourth in global production among pulse crops (FAOSTAT, 2017). Canada accounted for 46% of the world's lentil production from 2013 to 2017 (FAOSTAT, 2017), mostly from the province of Saskatchewan (Canadian Grain Commission, 2018). Since its first report from the province of Manitoba 30 years ago (Morrall, Reference Morrall1988), anthracnose caused by the fungal pathogen Colletotrichum lentis (Damm) (Damm et al., Reference Damm, O'Connell, Groenewald and Crous2014), has become the most important foliar fungal disease of lentil in western Canada. The disease is considered of minor importance in other parts of the world, and has been reported from Bangladesh, Bulgaria, Brazil, Ethiopia, Morocco, Pakistan, Syria and USA (Bellar and Kebabeh, Reference Bellar and Kebabeh1983; Bayaa and Erskine, Reference Bayaa, Erskine, Alleen and Lenné1997; Morrall, Reference Morrall1997; Kaiser et al., Reference Kaiser, Mihov, Muehlbauer and Hannan1998).
Two pathogenic races of C. lentis were previously identified (Buchwaldt et al., Reference Buchwaldt, Anderson, Morrall, Gossen and Bernier2004) and re-designated as race 0 and race 1 (Banniza et al., Reference Banniza, Warale, Menat, Cohen-Skali, Armstrong-Cho and Bhadauria2018). Race 1 is a less virulent race to which partial resistance was found in a number of L. culinaris subsp. culinaris accessions (Buchwaldt et al., Reference Buchwaldt, Anderson, Morrall, Gossen and Bernier2004, Reference Buchwaldt, Dzananovic and Durkin2018). Resistance to this race was effectively transferred into elite lentil breeding lines and resulted in the release of a number of cultivars with partial resistance to race 1 in lentil production (Vandenberg et al., Reference Vandenberg, Kiehn, Vera, Gaudiel, Buchwaldt, Dueck, Wahab and Slinkard2002, Reference Vandenberg, Banniza, Warkentin, Ife, Barlow, McHale, Brolley, Gan, McDonald, Bandara and Dueck2006; Government of Saskatchewan, 2019). However, no effective resistance was identified among L. culinaris subsp. culinaris germplasm to the highly virulent race 0 (Buchwaldt et al., Reference Buchwaldt, Anderson, Morrall, Gossen and Bernier2004). More recently, Shaikh et al. (Reference Shaikh, Diederichsen, Harrington, Adam, Conner and Buchwaldt2013) evaluated 579 accessions from 20 countries of central and eastern Europe by self-pollinating plants and then making single plant selections of progenies. They reported 7, 1 and 15 L. culinaris subsp. culinaris landrace accessions with resistance to race 0, to both race 0 and race 1, and to race 1, respectively.
Wild species of lentil in the primary gene pool, L. culinaris, L. orientalis and L. tomentosus have little or low levels of resistance to race 0 (Tullu et al., Reference Tullu, Buchwaldt, Lulsdorf, Banniza, Barlow, Slinkard, Sarker, Tar'an, Warkentin and Vandenberg2006). Among the seven lentil taxa, Lens ervoides (Brign.) Grande of the tertiary gene pool (Wong et al., Reference Wong, Gujaria-Verma, Ramsay, Yuan, Caron, Diapari, Vandenberg and Bett2015) had the highest frequency of resistant accessions for both races of C. lentis (Tullu et al., Reference Tullu, Buchwaldt, Lulsdorf, Banniza, Barlow, Slinkard, Sarker, Tar'an, Warkentin and Vandenberg2006). Anthracnose resistance from L. ervoides accessions was successfully transferred to L. culinaris germplasm using embryo rescue techniques (Fiala et al., Reference Fiala, Tullu, Banniza, Séguin-Swartz and Vandenberg2009; Tullu et al., Reference Tullu, Bett, Banniza, Vail and Vandenberg2013) to develop two interspecific recombinant inbred line (RIL) populations (LR-59: L. culinaris subsp. culinaris ‘Eston’ × L. ervoides L01-827A; LR-26: L. culinaris subsp. culinaris ‘Eston’ × L. ervoides IG 72815). Fiala et al. (Reference Fiala, Tullu, Banniza, Séguin-Swartz and Vandenberg2009) identified the highly resistant RIL (LR-59-81) from the LR-59 population which is now used as a resistant check for disease screening for both races of C. lentis.
The current study was initiated to evaluate the previously reported promising sources of resistance to C. lentis race 0 in L. culinaris subsp. culinaris landrace accessions (Shaikh et al., Reference Shaikh, Diederichsen, Harrington, Adam, Conner and Buchwaldt2013) in relation to the resistance identified in LR-59-81. The hypothesis was that the identified L. culinaris subsp. culinaris landrace accessions possess a source of resistance to C. lentis race 0 that is comparable to the resistance of line LR-59-81, the interspecific resistant check for C. lentis race 0.
Materials and methods
Plant materials
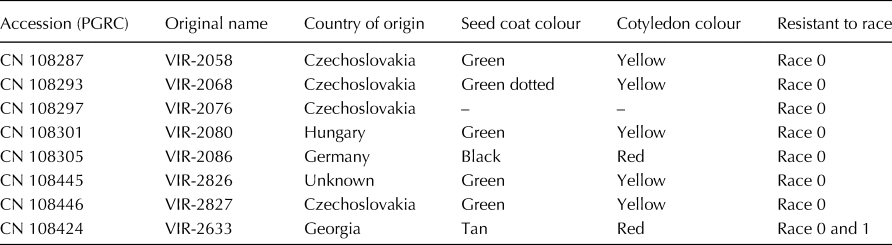
The lentil accessions used for the current study were selected based on Shaikh et al. (Reference Shaikh, Diederichsen, Harrington, Adam, Conner and Buchwaldt2013). Seeds for eight L. culinaris subsp. culinaris accessions were obtained from Plant Gene Resources of Canada (PGRC), Saskatoon (Table 1). Seven were previously reported to be resistant to race 0 and accession VIR-2633 was reported to have resistance to races 0 and 1 of C. lentis (Shaikh et al., Reference Shaikh, Diederichsen, Harrington, Adam, Conner and Buchwaldt2013). For all eight accessions, 35 arbitrarily selected seeds, which will be referred to as ‘sublines’ in this paper, were planted individually in 1 gallon pots in a growth chamber. The sublines were grown to generate seeds for a replicated pathogenicity test. Seeds were harvested from each plant separately and each subline was treated as an independent entry. For each of the eight accessions, 31 sublines were used for disease evaluation in individual experiments. L. culinaris subsp. culinaris cultivars ‘Eston’ (susceptible to both races) and ‘CDC Robin’ (susceptible to race 0, partially resistant to race 1), as well as interspecific recombinant inbred line LR-59-81 derived from the cross L. culinaris subsp. culinaris cultivar Eston × L. ervoides L01-827A (high levels of resistance to both races) were used as checks (Fiala et al., Reference Fiala, Tullu, Banniza, Séguin-Swartz and Vandenberg2009; Vail et al., Reference Vail, Strelioff, Tullu and Vandenberg2012).
List of L. culinaris subsp. culinaris accessions evaluated in the current study (adapted from Shaikh et al. Reference Shaikh, Diederichsen, Harrington, Adam, Conner and Buchwaldt2013)
Thirty-one sublines of each accession, in 10 replicates were used for each experiment and the experiments were conducted separately per accession. Two seeds of each subline were sown in each cell of 38-cell cone trays (26.8 cm × 53.5 cm) filled with Sun Gro Horticulture Sunshine Mix LA4 (Sun Gro Horticulture, Bellevue, USA) and perlite (Specialty Vermiculite Canada, Winnipeg, MB) at a 3:1 ratio. Ten replicate trays per accession were arranged in a randomized complete block design and the three checks were included in each tray. The experiments were conducted under controlled conditions in a growth chamber (Conviron, Model GR178; Winnipeg, MB) and in a greenhouse at the University of Saskatchewan. The day/night temperature of 21/18 and 23/22°C, and photoperiod of 16 and 17 h were maintained throughout the experiment using artificial light sources for growth chamber and greenhouse, respectively. After germination, the developing seedlings were thinned to one seedling/cell and a soluble mixture of N, P and K (20:20:20) at 2 g/l water was applied once per week.
Fungal inoculum production, inoculation and disease assessment
C. lentis isolates CT-30 (race 0) and CT-21 (race 1) (Banniza et al., Reference Banniza, Warale, Menat, Cohen-Skali, Armstrong-Cho and Bhadauria2018) were used for inoculations in separate experiments. Conidia were revitalized on 50% oatmeal agar plates (30 g oatmeal [Quick Oats, Quaker Oats Co., Chicago, IL, USA], 8.8 g agar [Difco, BD®, Sparks Glencoe, MD, USA], 1 litre H2O) and incubated for 7–10 d at room temperature. Plates were then flooded with sterile deionized water and conidia were harvested by scraping the colonies with the edge of a sterile glass microscope slide. The suspension was collected and filtered through one layer of Mira-cloth into a clean Erlenmeyer flask. The concentration of the conidia suspension was adjusted to 5 × 10⁴ conidia/ml using a haemocytometer. The surfactant Tween 20 (polyoxyethylene sorbitan monolaurate) was added at the rate of 1–2 drops per 1000 ml of suspension and the suspension was shaken well before inoculation.
Four weeks after seeding, plants were inoculated with the spore suspension at 3 ml per plant using an airbrush. The inoculation for one accession (VIR-2633) was conducted in a growth chamber and for seven accessions (VIR-2058, VIR-2068, VIR-2076, VIR-2080, VIR-2086, VIR-2826 and VIR-2827) in the greenhouse. For VIR-2633, sublines were inoculated with C. lentis CT-30 and CT-21 in separate experiments in a growth chamber. Twelve sublines of accession VIR-2633 that showed race 1 resistance after growth chamber inoculation were inoculated with both races for further confirmation in the greenhouse. Immediately after inoculation, plants were incubated at 90–100% relative humidity for 48 h in incubation chambers in the growth chamber, and for 24 h in incubation chambers in the greenhouse. They were subsequently covered with clear plastic bags or sleeves, before being moved to regular growth chamber or greenhouse benches. In the growth chamber experiments, leaf wetness was maintained by misting water inside the bag until the final scoring. In the greenhouse, benches were equipped with 30 s misting every 90 min. Individual plants were scored for C. lentis disease severity at 8–10 d post-inoculation (dpi), using a 0–10 rating scale with 10% increments in anthracnose severity. Data were converted to percentage/proportion disease severity using the class midpoints for data analysis.
Data analysis
Statistical analyses were conducted using SAS software (SAS 9.4, SAS Institute, Cary, North Carolina, 2011). Disease scores of each accession (31 sublines entry in 10 replicates) were analysed separately. Normality and variance homogeneity of the residuals were tested using a Shapiro–Wilk normality test and Levene's test for homogeneity, respectively. The data did not conform to the assumptions of a Gaussian distribution. As a result, a generalized linear mixed model with a beta distribution function was fitted to the data using PROC GLIMMIX with the LOGIT link function (SAS 9.4). The genotypes were treated as a fixed factor and replicates as a random factor. Means of the disease reactions were compared for post hoc comparison using Tukey's honestly significant difference at α = 0.05.
Results
Eight L. culinaris subsp. culinaris landrace accessions identified previously as promising sources of resistance to C. lentis (Shaikh et al., Reference Shaikh, Diederichsen, Harrington, Adam, Conner and Buchwaldt2013) were evaluated to determine their reaction to C. lentis, especially against the virulent race of the disease (Table 1). In greenhouse experiments, the susceptible checks ‘Eston’ and ‘CDC Robin’ had similar mean disease severity ranging from 93 to 95% in all experiments (Fig. 1). Whereas the race 0 resistant check LR-59-81 had a disease severity of 14–36%, which was significantly lower than that of susceptible checks ‘Eston’ and ‘CDC Robin’ in all experiments (P < 0.05). Among the 217 sublines derived from VIR-2058, VIR-2068, VIR-2076, VIR-2080, VIR-2086, VIR-2826 and VIR-2827 (31 sublines per accession), all sublines were significantly more susceptible to C. lentis race 0 isolate CT-30 than the resistant check LR-59-81 (Fig. 1). Disease severity for the majority of the sublines was similar to those of the susceptible checks ‘Eston’ and ‘CDC Robin’ (P > 0.05). The overall mean disease severity of the accessions VIR-2058, VIR-2068, VIR-2076, VIR-2080, VIR-2086, VIR-2826 and VIR-2827 ranged from 88 to 93% and no disease severity scores of less than 80% were observed for any of the sublines of those accessions (Fig. 2). Accession VIR-2826 had an overall mean disease severity of 90%, but two of its sublines had mean disease severity scores of 65 and 77%, which was significantly lower than that of the susceptible checks ‘Eston’ and ‘CDC Robin’.
Anthracnose severity for seven L. culinaris subsp. culinaris landrace accessions and checks evaluated under greenhouse conditions in response to infection with C. lentis isolate CT-30 (race 0). Purple data points on the panel represent mean anthracnose severity values of 31 sublines evaluated for each landrace accession in comparison with susceptible checks CDC Robin and Eston, and resistant check LR-59-81. Each data point is the estimate based on 10 replications per subline and per check. Anthracnose severity was rated using a 0–10 scale with 10% increments in disease severity.

Overall mean anthracnose severity score of seven L. culinaris subsp. culinaris landrace accessions and checks infected with C. lentis isolate CT-30 (race 0). The data are the means of 10 replications of 31 sublines evaluated for each landrace accession and for 10 replications for each, susceptible checks CDC Robin and Eston, and resistant check LR-59-81. Error bars indicate ±standard error of the mean. Anthracnose severity was rated using a 0–10 scale with 10% increments in disease severity.

Inoculations of accession VIR-2633, previously identified as a potential source of resistance to both races of C. lentis race 0 isolate CT-30 in growth chamber experiments, revealed the levels of anthracnose severity ranging from 58 to 84%, with an overall mean of 72%. The susceptible checks ‘Eston’ and ‘CDC Robin’ had a mean disease severity of 94 and 88%, respectively (Fig. 3). The resistant check LR-59-81 had a mean anthracnose severity of 29%, which was significantly lower than that of all sublines of VIR-2633 (P < 0.05). The subline CN108424-15 had the lowest mean anthracnose severity (58%), significantly lower than that of the susceptible checks ‘Eston’ and ‘CDC Robin’ (P < 0.05) in the growth chamber, but under greenhouse conditions, where scores were higher overall, anthracnose severity was similar to that of the susceptible checks ‘Eston’ and ‘CDC Robin’ (data not shown).
Percent anthracnose severity of 31 sublines of L. culinaris subsp. culinaris landrace accession VIR-2633 evaluated under growth chamber conditions for disease reaction to race 0 and race 1. Error bars indicate ±standard error of the mean. Anthracnose severity was rated using a 0–10 scale with 10% increments in disease severity.

Screening of VIR-2633 with the race 1 isolate CT-21 in the growth chamber revealed varying levels of resistance, with disease scores ranging from 5% (small lesion at stem base) to 95% (dead plant) and an overall mean of 49%. The resistant checks LR-59-81 and ‘CDC Robin’ had mean scores of 13 and 21%, respectively. Of the 31 VIR-2633 sublines tested, 12 had scores equal to or lower than the two resistant checks and were considered resistant. When re-tested in the greenhouse, these 12 sublines had mean disease severity scores ranging from 11 to 33%, which was not significantly different from the resistant checks LR-59-81 (28%) and ‘CDC Robin’ (23%), but lower compared to the 95% score for the susceptible check ‘Eston’ (Fig. 4). When re-tested with race 0 in the greenhouse they had a minimum average disease severity score of 72%, which was not different from the susceptible checks ‘CDC Robin’ and ‘Eston’, but was significantly higher than that of the resistant check LR-59-81 with a mean of 38%. This result indicated there was no resistance to race 0 in accession VIR-2633, but 12 sublines of the accession had scores equal to or lower than the two resistant checks and were considered resistant to race 1.
Percent anthracnose severity of 12 sublines of L. culinaris subsp. culinaris landrace accession VIR-2633 resistant to race 1 evaluated under greenhouse conditions for both race 0 and race 1 reactions for further confirmation. The 12 sublines were selected after growth chamber inoculation for race 1. Error bars indicate ±standard error of the mean. Disease was rated using a 0–10 scale with 10% incremental increases in disease severity.

Discussion
Identification of new sources of resistance from landraces and subsequent introduction into an elite cultivated background can be efficient, and is easily implemented in breeding programmes with the goal of developing a variety with desired genes/alleles. For C. lentis race 0, the sources of resistance in the cultivated species and its primary genepool remain limited (Buchwaldt et al., Reference Buchwaldt, Anderson, Morrall, Gossen and Bernier2004; Tullu et al., Reference Tullu, Buchwaldt, Lulsdorf, Banniza, Barlow, Slinkard, Sarker, Tar'an, Warkentin and Vandenberg2006). In the genus Lens the most effective resistance to both races were identified in L. ervoides and L. lamottei Czefr. (Tullu et al., Reference Tullu, Buchwaldt, Lulsdorf, Banniza, Barlow, Slinkard, Sarker, Tar'an, Warkentin and Vandenberg2006). However, interspecific hybridization with species in genetically distant gene pools is complicated by pre- and post-fertilization barriers, such as reduced pollen fertility, chromosomal aberrations and embryo abortion (Abbo and Ladizinsky, Reference Abbo and Ladizinsky1991, Reference Abbo and Ladizinsky1994; Gupta and Sharma, Reference Gupta and Sharma2007). Fiala et al. (Reference Fiala, Tullu, Banniza, Séguin-Swartz and Vandenberg2009) and Tullu et al. (Reference Tullu, Bett, Banniza, Vail and Vandenberg2013) used ovule and embryo rescue techniques to transfer the resistance from the L. ervoides accessions into L. culinaris subsp. culinaris germplasm. The resultant interspecific hybrid RIL lines had variable levels of fertility in subsequent segregating populations.
The interspecific RIL LR-59-81 (Fiala et al., Reference Fiala, Tullu, Banniza, Séguin-Swartz and Vandenberg2009) has become a commonly used resistant check in all anthracnose disease screening nurseries and indoor assays at the Crop Development Centre (CDC), University of Saskatchewan. This RIL has shown consistently higher levels of resistance to both races in greenhouse and field evaluations, even under high disease pressure (Fiala et al., Reference Fiala, Tullu, Banniza, Séguin-Swartz and Vandenberg2009; Vail, Reference Vail2010), and the resistance is not dependent on plant age (Vail, Reference Vail2010). Moreover, the response of LR-59-81 to the inoculation of 144 ascospore-derived C. lentis populations (race 0 × race 1) revealed lower levels of stem lesions and shoot die-back to all isolates of that population (Banniza et al., Reference Banniza, Warale, Menat, Cohen-Skali, Armstrong-Cho and Bhadauria2018).
Evaluations of anthracnose severity under controlled conditions in the current study confirmed the lack of high levels of resistance to race 0 in L. culinaris subsp. culinaris accessions in comparison with the resistance level of LR-59-81. We found a few sublines that had improved resistance when compared to the susceptible check ‘Eston’. This partially agrees with the findings of Shaikh et al. (Reference Shaikh, Diederichsen, Harrington, Adam, Conner and Buchwaldt2013). They reported that, after a cycle of selfing and single plant selection, all the lentil accessions evaluated in the study had resistance to race 0 in comparison with the susceptible check ‘Eston’. However, the level of resistance in those accessions was significantly lower compared to the level of resistance of the interspecific RIL LR-59-81. A possible explanation for the discrepancy could be that landrace accessions are heterogeneous either due to segregation at resistance loci or are a mixture of different genotypes. The success of finding the desired level of resistance in such situations mainly relies on the frequency of targeted alleles in the accession. In VIR-2633, identified as a potential source of resistance to both races, 38.7% of the tested sublines were resistant to race 1, while none of them showed resistance to race 0. Another possible reason could be differences in race 0 isolates used for the two studies. It is possible that the race 0 isolate used in the current study was more virulent, potentially indicating a higher aggressiveness on L. culinaris subsp. culinaris accessions in comparison with the resistant check. Similar results were reported by Vail (Reference Vail2010), who evaluated the resistance to both races for accession VIR-421 under field conditions, which had previously been reported to be resistant to race 0 (Buchwaldt and Diederichsen, Reference Buchwaldt and Diederichsen2004). Banniza et al. (Reference Banniza, Warale, Menat, Cohen-Skali, Armstrong-Cho and Bhadauria2018) also found only modest improvement in resistance of VIR-421 compared to ‘Eston’, and that it significantly lower resistance compared to LR-59-81 when tested against an ascospore-derived population of C. lentis from a cross of CT-30 (race 0) × CT-21 (race 1).
Based on these results, it was confirmed that sources of high levels of resistance to race 0 of C. lentis appear to be restricted to wild Lens species, especially accessions of L. ervoides as reported by Tullu et al. (Reference Tullu, Buchwaldt, Lulsdorf, Banniza, Barlow, Slinkard, Sarker, Tar'an, Warkentin and Vandenberg2006). Exploiting the resistance in the tertiary gene pool species can be confounded by linkage drag (Tanksley and Nelson, Reference Tanksley and Nelson1996). The use of marker-assisted selection (Collard and Mackill, Reference Collard and Mackill2008) may improve resistance breeding strategies for transferring race 0 resistance genes from L. ervoides without the associated linkage drag. This may require deeper knowledge of genomic information considering that L. culinaris and L. ervoides have a chromosomal translocation between chromosomes 1 and 5 (Gujaria-Verma et al., Reference Gujaria-Verma, Vail, Carrasquilla-Garcia, Penmetsa, Cook, Farmer, Vandenbeg and Bett2014; Bhadauria et al., Reference Bhadauria, Ramsay, Bett and Banniza2017). The transfer of the desired genes/alleles between the two species is possible only if the genes/alleles that control the resistance are not near the translocation breakpoint. The identification of quantitative trait loci in the intraspecific L. ervoides population LR-66 (Bhadauria et al., Reference Bhadauria, Ramsay, Bett and Banniza2017) is the first step towards identifying resistance loci relative to that breakpoint.
Acknowledgements
The authors thank K. Pathirannehelage and S. Boechler for technical assistance. We wish to acknowledge funding from the Natural Sciences and Engineering Research Council of Canada (NSERC), the Saskatchewan Pulse Growers, and Plant Gene Resources of Canada, Saskatoon, for provision of the seeds for the study.



