Implications
In poultry diets, calcium (Ca) and phosphorus (P) are the two most abundant minerals, however, they exist in a complex multifactorial relationship. The current study investigated the complex interaction between calcium and phosphorus on bird performance and skeletal health using a geometric framework model. The outcomes of the study provide new insight in Ca and P interactions and help determine which macro mineral broilers prioritise. This can readily be applied to the poultry industry, enabling further improvements in poultry nutrition.
Introduction
Nutritional homeostasis is a complex relationship between multiple and changing nutrients. Evolutionary processes have ensured that animals are able to deal with these complexities and can regulate their nutrient intake to satisfy a range of nutritional requirements when presented with an array of possible nutrient sources (Simpson and Raubenheimer, Reference Simpson and Raubenheimer2011). However, these complex interactions and changing feeding behaviour are difficult to assess experimentally (Simpson and Raubenheimer, Reference Simpson and Raubenheimer2011). While mechanistic experimentation is required to understand the fundamentals of nutritional biochemistry, a broader conceptual framework that can support more detailed exploration is useful. In this regard a geometric approach has been successfully exploited in a range of species and ecological contexts. The geometric framework is a visual representation of an animal’s nutrient space which explores the complex interactive effects of multiple nutrients. The nutrient space is built from two or more axes, each axis representing a food component or nutrient. Food substances are represented as co-ordinates in the nutrient space, defining the available nutrients of the food (Raubenheimer and Simpson, Reference Raubenheimer and Simpson2006; Simpson and Raubenheimer, Reference Simpson and Raubenheimer2011). Ideally, a single food would be nutritionally balanced and would meet all of the animals’ nutrient requirements. However, this ideal nutritional scenario rarely presents in praxis. Therefore in order for animals to meet their nutritional requirements a range of foods must be consumed. This approach allows animals to regulate their intake of nutritionally imbalanced yet complementary foods to fulfil their nutritional requirements. Commercially, broilers are fed a single mixed ration that is formulated to meet all of the nutritional requirements of the bird to support optimum growth and performance. However, this single mixed ration is formulated for the average bird, which may or may not meet the nutritional requirements of the entire flock. In this context, an individual bird may elect to either over- or under-consume certain nutrients in order to satisfy the demand for a particular nutrient. This is known as the rule of compromise and the extent to which this influences animal behaviour is dependent on the capacity of the animal to deal with nutrient excess or deficit.
In poultry nutrition the interaction between calcium (Ca) and phosphorus (P) represents a complex relationship, which is not only broadly multifactorial but is also particularly influenced by vitamin D and phytase (Waldenstedt, Reference Waldenstedt2006; Selle et al., Reference Selle, Cowieson and Ravindran2009; Wilkinson et al., Reference Wilkinson, Selle, Bedford and Cowieson2011). Ca and P are essential for biological processes and skeletal integrity (Rath et al., Reference Rath, Huff, Huff and Balog2000; Selle et al., Reference Selle, Cowieson and Ravindran2009; Veum, Reference Veum2010). Commercial poultry diets are typically corn- and/or wheat-soya based, and contain relatively high levels of phytate-P, which has limited availability for poultry (Cowieson et al., Reference Cowieson, Acamovic and Bedford2004; Selle and Ravindran, Reference Selle and Ravindran2007; Selle et al., Reference Selle, Cowieson and Ravindran2009 and Reference Selle, Ravindran, Cowieson and Bedford2011). Phytate carries a strong negative charge, and has a great affinity for certain divalent cations (Angel et al., Reference Angel, Tamim, Applegate, Dhandu and Ellestad2002). Due to the high inclusion levels of Ca in the diet, Ca2+ is the dominant cation in the diet and chelates with phytate, forming Ca-phytate complexes (Selle et al., Reference Selle, Cowieson and Ravindran2009). The formation of Ca-phytate complexes reduces the bioavailability of both Ca and P. Limestone (calcium carbonate (CaCO3)) is the most common source of Ca in poultry diet and due to its high acid binding capacity CaCO3 increases the gastrointestinal pH. This pH increase is favourable to Ca-phytate and Phytate-Ca-protein complex formations, resulting in a decrease in P and amino acid digestibility (Selle et al., Reference Selle, Ravindran, Cowieson and Bedford2011; Wilkinson et al., Reference Wilkinson, Selle, Bedford and Cowieson2011). Poultry are known to possess specific appetites for certain nutrients such as Ca (Wood-Gush and Kare, Reference Wood-Gush and Kare1966; Hughes and Wood-Gush, Reference Hughes and Wood-Gush1971; Joshua and Mueller, Reference Joshua and Mueller1979) and P (Holcombe et al., Reference Holcombe, Roland and Harms1976). Yet it remains unknown whether it is Ca or non-phytate phosphorus (nPP) that is prioritised by broilers. Thus, the purpose of the experiment reported herein was to investigate whether Ca or nPP is prioritised by broilers and to explore the effects on performance and skeletal health by feeding a range of diets systematically imbalanced in Ca and nPP.
Material and methods
All birds were housed at the Poultry Research Foundation at The University of Sydney, Camden Campus. All experimental procedures conducted had approval from The University of Sydney Animal Ethics Committee and were in accordance with the Australian Code for the care and use of animals for scientific purpose (National Health and Medical Research Council, 2004).
Animals and housing
A total of 600 Ross 308-day-old male broilers were obtained from a commercial hatchery (Baiada Poultry Pty Ltd, Marsden Park, NSW, Australia) and allocated randomly to one of 15 dietary treatments in a randomised blocked design. Each dietary treatment was replicated five times with eight birds per replicate cage. Birds were provided with feed and water ad libitum throughout the study. Birds were housed in metabolism cages, with the room temperature maintained at 31°C for the first 5 days then reduced by 0.5°C per day until day 21. Birds were subject to a 23 : 1 h (light : dark) lighting regime for the first 5 days then 18 : 6 h (light : dark) for the duration of the study.
Dietary treatments and experimental procedures
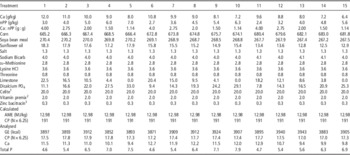
All birds were reared on a commercial broiler starter crumb for the first 7 days, which provided 11.8 MJ/kg AME, 228 g/kg CP, 8.8 g/kg Ca and 4.4 g/kg nPP (Vella Stock Feeds, Plumpton, NSW, Australia). At day 7, all birds were weighed, wing tagged and placed onto experimental diets. Treatment diets were corn-soya based and fed as a mash (Table 1). Dietary treatments were formulated to one of three total densities of Ca+nPP; high (15 g/kg), medium (13.5 g/kg) and low (12 g/kg). At each density a range of five Ca : nPP ratios (4 : 1, 2.75 : 1, 2.1 : 1, 1.5 : 1 and 1.14 : 1) were fed. Individual BWs and pen feed intake were measured weekly. On day 28, birds were euthanised by injection of sodium pentobarbitone (Lethabarb, Virbac, Australia Pty Ltd, Milperra, NSW Australia) into the jugular vein. Terminal BW of each bird was recorded and the right leg of each bird was removed and stored at −20°C until further analysis.
Ingredient and nutrient specifications (as fed g/kg) of the experimental diets fed to Ross 308 broilers (days 7 to 28)

Ca=calcium; nPP=non-phytate phosphorus; P=phosphorus.
1 Filchem Australia Pty Ltd, Castle Hill, NSW, Australia.
2 Supplied per kg of diet: retinol, 3600 μg; cholecalciferol, 125 μg; α-tocopherol, 50 mg; menadione, 3 mg; thiamine, 3 mg; riboflavin, 9 mg; pyridoxine, 5 mg; cobalamin 25 μg; niacin, 50 mg; pantothenic acid, 18 mg; folic acid, 2 mg; biotin, 200 μg; Cu, 20 mg; Fe, 40 mg; Mn, 110 mg; Co, 250 μg; I, 1 mg; Mo, 2 mg; Zn, 90 mg; Se, 300 μg; ethoxyquin, 125 mg.
3 Albac, G 150 (Philbro Animal Health Pty Ltd, Girraween, NSW, Australia).
Behavioural observations
The latency to lie (LTL) test was applied to focal birds on day 27 as per the methods of Berg and Sanotra (Reference Berg and Sanotra2003). Briefly, birds were removed from their home pen and taken to an area outside the rearing compartment. Birds were individually placed in a standing position into plastic tubs (33 (h)×35 (w)×51.5 cm (l)) filled with ~3 cm of tepid water (between 30°C and 33°C). Water temperature was monitored during the LTL testing with a thermometer that was taped inside the plastic tubs. When the water temperature fell below 30°C hot tap water was added to increase the temperature back to between 30°C and 33°C. Water in the tubs was changed at regular intervals, approximately after every six uses. Timing commenced once the birds were placed in a standing position and was stopped at the first attempt to sit. If no attempt to sit was made by the bird the test was stopped at 5 min. After the completion of the procedure the birds were returned to their home pen.
Chemical analysis
Tibia ash was determined as described by Garcia and Dale (Reference Garcia and Dale2006). The right tibia was dissected out from each bird. Samples were labelled, weighed and dried to a constant weight. Samples were then placed into a muffle furnace and ashed for 12 h at 600°C. Diets and ileal digesta were analysed for digestibility metrics and are reported in Wilkinson et al. (2014).
Statistical analysis
All data was analysed using the mixed model lme function from the nlme package in R version 2.15 (R Development Core Team, 2011). Fixed effects were dietary Ca and nPP and block was included as a random effect. Treatments are represented as dots overlaid on the contour plots. Interrogation of the data was performed using a quadratic polynomial function and the terms Ca and P presented on the contour plots are composites of linear and quadratic terms. Differences were considered significant at P<0.05. Behavioural LTL data were analysed using Cox’s proportional hazard survival analysis.
Surface plots were generated using a grid of model predictions based on the Ca and nPP data set, the standard errors for the predictions were used to refine the area plotted. Intake arrays for Ca and nPP for each treatment were calculated by multiplying the analysed dietary value by feed intake before being plotted.
Results
Bird performance
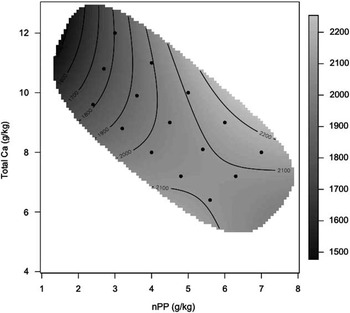
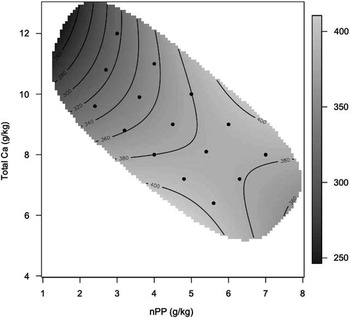
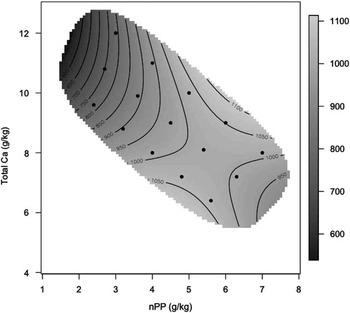
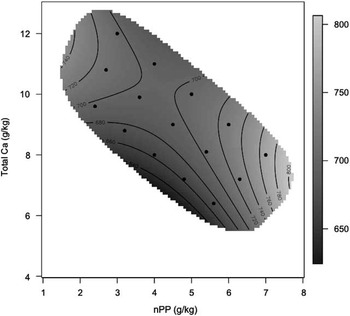
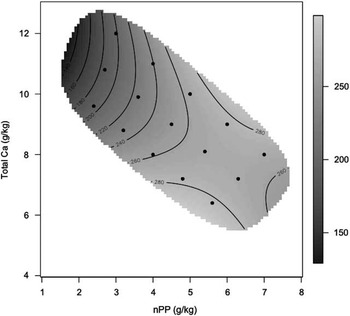
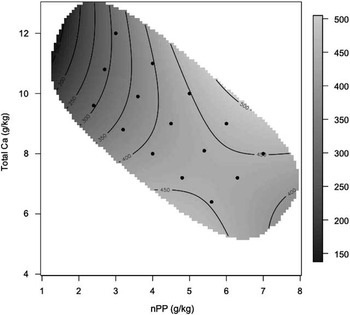
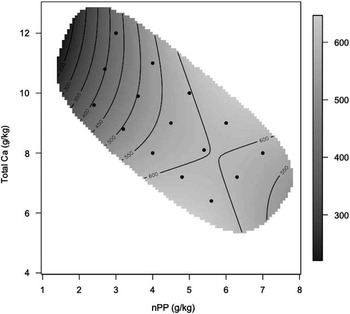
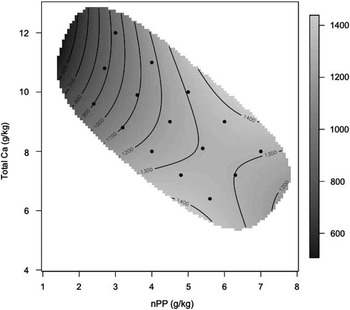
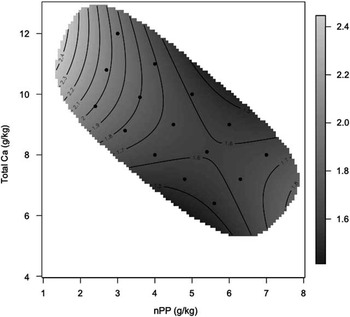
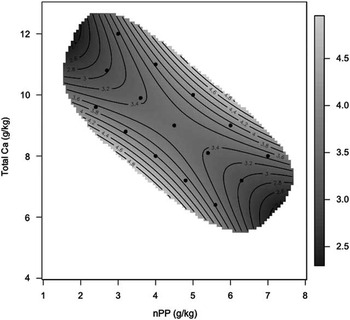
The effect of feed intake over the experimental period 7 to 28 days is presented in Figure 1. Feed intake was highest in birds receiving diets that contained high levels of nPP and intermediate levels of Ca. Lowest feed intakes were observed in birds receiving diets with high Ca and low nPP, resulting in a significant Ca×nPP interaction (P=0.03). During days 7 to 14 (Figure 2) and 22 to 28 (Figure 3), the highest feed intake was observed in birds receiving diets that had high levels of nPP and intermediate levels of Ca, resulting in a significant Ca×nPP interaction (P<0.05). During days 15 to 21 (Figure 4) feed intake was seen to increase with increasing levels of nPP at inclusion levels higher than 4.5 g/kg (P<0.01). Feed intake was strongly inhibited by diets with low nPP, however, the addition of dietary Ca increased feed intake (P=0.005) up to a max 10 g/kg. BW gain (Figures 5 to 8) over the experimental period was observed to follow a similar pattern to feed intake. BW gain increased rapidly between 1.5 and 3 g/kg of nPP at high dietary Ca levels. Dietary nPP levels higher than 4.5 g/kg with low levels of dietary Ca showed no further increase in BW gain, resulting in a significant Ca×nPP interaction (P<0.01). Feed conversion efficiency for birds over the total experimental period was shown to be poorest at low nPP and high Ca inclusion (Figure 9). At low nPP increasing dietary Ca from 8 to 12 g/kg tended to increase feed conversion ratio where no such effect was evident at higher nPP concentrations, resulting in a Ca×nPP interaction (P<0.01).
Graphical representation of the interactive effect of dietary Ca and nPP on feed intake (g/kg) from days 7 to 28 (P-values; nPP, 0.001; Ca, 0.1167; Ca×nPP, 0.0311; s.e.m. 24.351).

Graphical representation of the interactive effect of dietary Ca and nPP on feed intake (g/kg) from days 7 to 14 (P-values; nPP,<0.0001; Ca, 0.0016; Ca×nPP, 0.0381; Pooled s.e.m. 5.761).

Graphical representation of the interactive effect of dietary Ca and nPP on feed intake (g/kg) from days 22 to 28 (P-values; nPP,<0.001; Ca, 0.0457; Ca×nPP, 0.0079; Pooled s.e.m. 18.299).

Graphical representation of the interactive effect of dietary Ca and nPP on feed intake (g/kg) from days 15 to 21 (P-values; nPP, 0.0012; Ca, 0.0514; Ca×nPP, 0.3553; Pooled s.e.m. 13.553).

Graphical representation of the interactive effect of dietary Ca and nPP on broiler BW gain (g/kg) from days 7 to 14 (P-values; nPP,<0.001, Ca, 0.0032; Ca×nPP, 0.0057, Pooled s.e.m. 4.761).

Graphical representation of the interactive effect of dietary Ca and nPP on broiler BW gain (g/kg) from days 15 to 21 (P-values; nPP,<0.001; Ca, 0.0493; Ca×nPP, 0.0036; Pooled s.e.m. 8.195).

Graphical representation of the interactive effect of dietary Ca and nPP on broiler BW gain (g/kg) from days 22 to 28 (P-values; nPP,<0.001; Ca, 0.0300; Ca×nPP, 0.0506; Pooled s.e.m. 12.729).

Graphical representation of the interactive effect of dietary Ca and nPP on broiler BW gain (g/kg) from days 7 to 28 (P-values; nPP,<0.001; Ca, 0.0037; Ca×nPP, 0.0016; Pooled s.e.m. 19.107).

Graphical representation of the interactive effect of dietary Ca and nPP on feed conversion efficiency in broiler from days 7 to 28 (P-values; nPP,<0.001 Ca, 0.0215; Ca×nPP, 0.0026; Pooled s.e.m. 0.027).

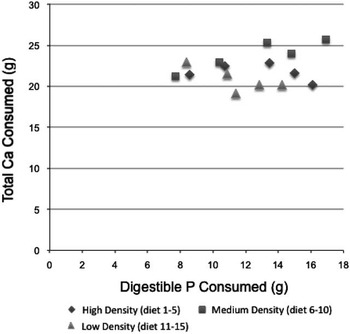
The intake arrays for Ca and nPP are presented in Figure 10. For all diet densities, the birds appeared to prioritise Ca and did not endeavour to reach an nPP intake target. The exception was the lowest Ca : nPP ratio, where birds seemed to decrease their Ca intake. The intake arrays show that broilers regulate their Ca intake more closely than nPP intake. This demonstrates that birds are more willing to over consume nPP to defend a Ca target than over consuming Ca to defend an nPP intake.
Intake arrays for (on a formulated basis) total Ca and nPP from d7–28 in broilers. Top array is for the high density diets (Diets 1–5; Table 1), middle array corresponds to the medium density diets (Diets 6–10; Table 1) and the bottom array is for the low density diets (Diets 11–15; Table 1).

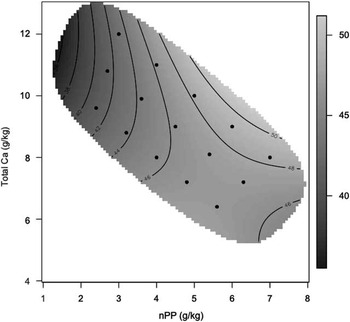
Tibia ash was greatest in birds that received diets containing high levels of nPP and low levels of total Ca. However, a threshold level of nPP at 4.5 g/kg was observed, beyond which, little change in tibia ash percentage was found, however, increasing dietary Ca tended to increase tibia ash, resulting in a significant Ca×nPP interaction (Figure 11).
Graphical representation of the interactive effect of dietary Ca and nPP on tibia ash (% DM) in broiler from days 7 to 28 (P-values; nPP,<0.001; Ca, 0.031; Ca×nPP, 0.009; Pooled s.e.m. 0.333).

Behavioural observations
The effect of dietary Ca and nPP on LTL times are presented in Figure 12. Birds that received diets with high nPP and low Ca along with birds receiving low nPP and high Ca had shorter standing times, resulting in a significant Ca×nPP interaction (P<0.01). Birds that received dietary treatments containing a 2.1 : 1 ratio of Ca : nPP showed the longest standing times.
Graphical representation of the interactive effect of dietary Ca and nPP on broiler latency to lie (minutes to sit) times at day 27 (P-values; nPP, 0.3531; Ca, 0.5620; Ca×nPP, 0.004; Pooled s.e.m. 0.202).

Discussion
In order to maximise bird performance, low Ca is optimal for P and amino acid digestibility, however, low dietary Ca can impair skeletal health. On the other hand, the high levels of Ca needed for optimal skeletal health, become detrimental to nutrient digestibility and therefore broiler performance (Tamim and Angel, Reference Tamim and Angel2003; Tamim et al., Reference Tamim, Angel and Christman2004).
The findings of the present study show that nPP is more influential on performance metrics than total Ca. With increasing inclusion of nPP in diets, feed intake and BW gain rapidly increased. Previous studies with low nPP (2 g/kg) and high Ca concentrations (9 g/kg) reported reduced growth performance (Plumstead et al., Reference Plumstead, Leytem, Maguire, Spears, Kwanyuen and Brake2008; Rousseau et al., Reference Rousseau, Létourneau-Montminy, Même, Magnin, Nys and Narcy2012), which is consistent with the findings reported in the present paper. Rama Rao et al. (Reference Rama Rao, Raju, Reddy and Pavani2006) reported similar effects where increasing dietary Ca concentration from 6 to 9 g/kg between 22 to 42 days was deleterious for growth and bone mineralisation when dietary nPP was not increased concurrently. These results, however, contradict the findings of Dhandu and Angel (Reference Dhandu and Angel2003) where no significant effect on growth performance was observed when varying nPP from 1.5 to 3.1 g/kg while maintaining a fixed dietary Ca concentration of 6.9 g/kg in 32- to 42-day-old broilers. Yan et al. (Reference Yan, Kersey and Waldroup2001) reported similar findings with varying nPP concentrations having no effect of growth performance with a fixed Ca concentration. Differences between the results of other studies and those of the present study may be a consequence of birds in Dhandu and Angel (Reference Dhandu and Angel2003) and Yan et al. (Reference Yan, Kersey and Waldroup2001) being fed diets that met their Ca and nPP requirements before the dietary treatments were given and as a result were less prone to a nPP deficiency. Both of the studies conducted by Dhandu and Angel (Reference Dhandu and Angel2003) and Yan et al. (Reference Yan, Kersey and Waldroup2001) also focused on broilers older than those used in this experiment, a developmental stage where broilers are less sensitive to nPP (Nelson et al., Reference Nelson, Harris, Kirby and Johnson1990), which may explain the difference in results obtained.
The intake arrays (Figure 10) suggest that broilers are reluctant or even unable to over-consume Ca in order to reach an nPP intake target, but are more willing to over consume nPP to reach a Ca intake target. If birds prioritised nPP over Ca the intake array would be vertical across the nPP intake target. However, if birds prioritised Ca over nPP then the intake arrays would be horizontal on the Ca intake target. It is known that the Ca : nPP ratio in poultry diets plays an important role in both Ca and P absorption, especially if the diet has minimal inclusion levels both elements (Li et al., Reference Li, Ledoux, Veum, Raboy and Ertl2000). Birds fed low Ca diets appeared to be eating to a Ca intake target, and were willing to over consume nPP to try and reach this target, and were seen to have higher feed intake. Shafey (Reference Shafey1993) found when dietary nPP intake increases (such as may be associated with birds attempting to achieve a Ca intake target) the availability of Ca in the intestinal lumen decreases, stimulating hormonal secretion of parathyroid hormone which increases bone resorption, consequently reducing bone ash. However, the results of the present study did not suggest that birds eat to achieve an nPP intake target. It may be that in order to defend the nPP intake target birds had to over consume dietary Ca but were unable to do this, due to the closely regulated Ca metabolism feedback mechanisms (Veum, Reference Veum2010). McDonald and Solvyns (Reference McDonald and Solvyns1964) stated a threshold tolerance level of Ca for broiler between 13 to 17 g/kg, with Ca inclusion higher than this depressing feed intake and weight gain. This could explain why birds are unable to defend an nPP intake target, despite the dominance of nPP on bird performance.
Comparing tibia ash and LTL surface plots, birds that received diets with a total ratio of 4 : 1 Ca : nPP generally had the lowest tibia ash percentages (diet 1, 43%; diet 6, 41% and diet 11, 41%). Birds receiving these dietary treatments also had lower standing times in the LTL test (diets 1, 6, 11~3 min). These data suggests that birds that received these dietary treatments have impaired mobility and locomotion, that may be associated with poorer bone mineralisation. Interestingly, birds which received diets with a total ratio of 1.14 : 1 Ca : nPP, were observed to have some of the highest tibia ash percentages (diet 5, 48%; diet 10, 47% and diet 15, 46%) but conversely were observed to have shorter standing times in the LTL test (diets 5, 10, 15~3 min). This suggests that poor mobility and locomotion may be, at times, associated with factors other than bone mineralisation and that sub-optimal Ca and nPP balance may compromise mobility via a range of mechanisms.
Studies by Nester and Emmerson (Reference Nestor and Emmerson1990) found that birds with a higher BW have a higher tibia ash percentage and this is consistent with the findings of this study. The same authors attributed higher tibia ash with increased activity of the birds walking to the feeder. Lanyon (Reference Lanyon1993) has shown similar findings in turkeys, with physical loading being essential in the maintenance of cortical bone. The findings of Nester and Emmerson (Reference Nestor and Emmerson1990) and Lanyon (Reference Lanyon1993) are consistent with Wolff’s law, that states bones in a healthy animal will adapt to the loads under which it is placed. If loading on a particular bone increases, the bone will remodel itself over time to become stronger. The results of the present study are also in consistent with Wolff’s law, however, the reasons that birds receiving dietary treatments with a total ratio of 1.14 : 1 (diets 5, 10 and 15) having higher tibia ash percentages yet shorter standing times in the LTL, is not clear. Further investigation into the aetiology is required, as infectious and degenerative causes of leg weakness such as bacterial chondronecrosis with osteomyelitis (femoral head necrosis) and/or tibial dyschondroplasia (TD) could be a causative factor. Tibial dyschondroplasia is a common lesion seen in broiler leg bones (Bradshaw et al., Reference Bradshaw, Kirkden and Broom2002). It is characterised by an abnormal cartilage mass in the metaphyseal region below the growth plate (Pompeu et al., Reference Pompeu, Barbosa, Martins, Baião, Lara, Rocha and Miranda2012). The pathogenesis of TD is not well understood, however, nutrition may influence the incidence (Bradshaw et al., Reference Bradshaw, Kirkden and Broom2002). Studies by Kestin et al. (Reference Kestin, Adams and Gregory1994) and Vestergaard and Sanotra (Reference Vestergaard and Sanotra1999) found that birds with TD had higher lameness scores and defect gaits. Leg abnormalities cause birds pain and discomfort (Danbury et al., Reference Danbury, Weeks, Chambers, Waterman-Pearson and Kestin2000) and this may provide another explanation as to why birds displayed reduced LTL times.
With the increased prevalence of leg disorders and the difference in muscle distribution, considerable attention has been given to the morphological and composition of the leg bones of broilers (Yalcin et al., Reference Yalcin, Özkan, Coskuner, Bilgen, Delen, Kurtulmus and Tanyalcin2001). Bone breaking strength, bone density, mineral content and bone ash have been used as indicators of bone status and skeletal health (Shim et al., Reference Shim, Karnuah, Mitchell, Anthony, Pesti and Aggrey2012). Bone mineralisation, commonly determined from tibia ash percentage, is an accepted measure for poultry and is assumed to be highly correlated with the overall structural strength of the skeleton. Bone mineralisation, however, is only one aspect in determining bone strength; the volume of bone tissue and micro-architectural organisation also influence bone strength and skeletal health (Rath et al., Reference Rath, Huff, Huff and Balog2000; Shim et al., Reference Shim, Karnuah, Mitchell, Anthony, Pesti and Aggrey2012). The results of this study may support these notions, and may explain why birds with a ratio of 1.14 : 1 Ca : nPP had high tibia ash yet still exhibited signs of impaired mobility. Bone density may be a more accurate measure as it accounts for the mass of material per unit volume of bone in the matrix, including both organic and inorganic material and how porous the matrix is (Rath et al., Reference Rath, Huff, Huff and Balog2000; Shim et al., Reference Shim, Karnuah, Mitchell, Anthony, Pesti and Aggrey2012).
In this study it can be concluded for broiler performance metrics that nPP was more influential than total Ca. Dietary Ca was shown to have a modest influence on performance metrics at high nPP concentration (>4 g/kg). The application of the geometric framework as an investigative tool for the interactions between Ca and nPP revealed the priority the birds place on the macro minerals. Although nPP was more influential on bird performance birds are not willing or are perhaps unable to reach an nPP intake target through overconsumption of Ca, however, they will readily over consume nPP to reach a Ca intake target. The use of the geometric framework can be applied to other aspects of poultry nutrition to further our understanding of Ca and nPP interactions and the effect of this interaction on nutrient digestibility.
Acknowledgements
The authors would like to thank Rural Industries Research and Development Corporation (Chicken Meat) for providing financial support for this work. The Australian Poultry Cooperative Research Centre for scholarship funding for Ms Bradbury. Professor Steve Simpson (Faculty of Biological Science, University of Sydney) is thanked for his introduction to the geometric framework.