





1 Introduction
High-repetition-rate and high-stability short-pulse lasers are widely used in industrial processing, inertial fusion energy (IFE), optoelectronic material modification and microscopic imaging[ Reference Spellauge, Doñate-Buendía, Barcikowski, Gokce and Huber 1 – Reference Qi, Yao, Du, Zhang, Zhou, Fu, Li, Mi, Chen, Wang, Luo, He, Nan, Zhang, Sun, Xia, Cai, Du, Xie, Chen and Yang 5 ]. Transient stimulated Brillouin scattering (SBS) pulse compression technology has been proven to obtain short-pulse lasers of less than 100 ps[ Reference Rodin, Cerneckyte, Mackonis and Petrulenas 6 , Reference Cao, Wang, Dang, Yue, He, Yu, Yu and Lu 7 ]. Due to its advantages such as low generation threshold and high scattering intensity[ Reference Erokhin, Kovalev and Faizullov 8 , Reference Pohl and Kaiser 9 ], it can easily achieve extremely high compression ratios[ Reference Yoshida, Fujita, Nakatsuka, Ueda and Fujinoki 10 – Reference Kmetik, Fiedorowicz, Andreev, Witte, Daido, Fujita, Nakatsuka and Yamanaka 12 ]. Currently, experimental results approaching the theoretical compression limit have been reported[ Reference Kmetik, Yoshida, Fujita, Nakatsuka and Yamanaka 13 , Reference Liu, Fan, Jin, Luo, Li, Li, Li, Wang and Lu 14 ]. However, as the repetition rate and pump intensity of lasers continue to increase, the thermal and intensity load capacity of transient SBS are challenged. Under the combination of transient effects and thermal breakdown enhancement effects, the energy reflectivity and stability of Stokes light are severely degraded[ Reference Liu, Wang, Bai, Wang, Jin, Wang, Yuan, Lin and Lu 15 – Reference Cao, Wang, Yue, Meng, Li, Yu, Bai and Lu 19 ]. Researchers have proposed some practical methods to try to alleviate heat accumulation in the focal region, such as ultrafiltration technology targeting impurity molecules[ Reference Kang, Fan, Huang, Zhang, Ge, Li, Yan and Zhang 20 ], rotating off-centered lens technology[ Reference Wang, Cha, Kong, Wang and Lu 21 ] and high-viscosity media[ Reference Chen, Tan, Jin, Chen, Bai, Wang, Wang and Lu 22 – Reference Wang, Cha, Kong, Wang and Lu 24 ]. However, these methods have only achieved valuable improvements in high-repetition-rate steady-state SBS, and the results of their application in transient SBS are still unknown. The key reason for the degradation of the output characteristics of high-repetition-rate transient SBS is that the high-repetition-rate pump light always excites the acoustic field for energy transfer in a focused state. The extremely high pump intensity and temperature at the focal point directly destroy the chemical bonds between Brillouin medium molecules, generating a photoionization effect that produces a large amount of plasma and a large number of electrons. These substances will absorb a large number of pump photons, causing the internal temperature of the medium to continue to rise. This cycle will continue until thermal equilibrium is reached. Meanwhile, the transient effect causes a sharp increase in the number of transmitted pump photons during the acoustic field establishment process. The combined effect of these two factors, leading to increased system losses and decreased stability, has a devastating impact on the scattering process.
In 2003, Guo et al. [ Reference Guo, Lu, Cheng, Zhou and Yin 25 ] first proposed the ‘self-feedback seed model’ of SBS, namely self-pumped Brillouin scattering (SPBS). This method does not require a focusing structure: the pump light transmitted in parallel will be collinearly reflected in a certain proportion after passing through the medium cell. Stokes photons in the Brillouin linewidth range of the pump light spectrum will interact with pump photons and excited phonons, which is equivalent to injecting a fixed intensity of Stokes seed light in the reverse direction. In 2011, Dement’ev et al. [ Reference Dement'ev, Diomin, Murauskas and Slavinskis 26 ] achieved an experiment on SPBS pulse compression based on the interaction between feedback light and forward pump light, and the results showed that its energy stability was significantly better than that of traditional SBS. Zhu et al. [ Reference Zhu, Lu, Wang and Zhang 27 ] and Wang et al. [ Reference Wang, Zhu, Lu and Zhang 28 ] successively achieved output energy exceeding the joule level under high-reflectivity conditions based on SPBS. Among these, Zhu et al. [ Reference Zhu, Lu, Wang and Zhang 27 ] used pump light with a pulse width of 3 ns and, under the condition of an injected pump energy of 4.16 J (peak power of 1.39 GW), obtained the shortest compressed laser output of about 310 ps, with a compression ratio of about 9.7 times. Wang et al. [ Reference Wang, Zhu, Lu and Zhang 28 ] used a pump light with a pulse width of 5 ns and an injected pump energy of 5.36 J (peak power of 1.07 GW) to obtain a compressed laser output of about 360 ps, with a compression ratio of about 13.9 times. The above results demonstrate the unique advantages of SPBS technology in improving output energy and stability. However, all the results reported so far have been verified in low-repetition-rate (1–10 Hz) steady-state SBS (pump pulse width approximately tens of nanoseconds), and require the pump light energy to reach the level of hundreds of millijoules, which is technically difficult.
In this study, we establish a theoretical model of transient SPBS based on pump intensity decay. The evolution of the normalized proportion η of the initial Stokes component in the pump light spectrum is simulated. We design a high-repetition-rate transient SPBS pulse compression system and experimentally investigate the relationship between the SPBS output characteristics and the pump pulse parameters and other key influencing factors. The results demonstrate that transient SPBS achieved a compression ratio exceeding two times that of SBS with an injection energy of only 30 mJ, and its peak pump power was more than 20 times lower than that reported in previous work. By comparing the results with those of SBS under the same conditions, the absolute advantage of transient SPBS in terms of energy reflectivity and stability is clearly demonstrated. Ultimately, a short-pulse laser with a peak power exceeding 100 MW@300 Hz is obtained with less than 5% system loss and an energy relative standard deviation (RSD) of 1.42%. We hope that this research will provide valuable assistance for the application of transient SPBS in high-repetition-rate, high-reliability laser systems.
2 Theory
Brillouin scattering is essentially a third-order nonlinear effect with threshold characteristics. The pump field, Stokes field and phonon field must satisfy the laws of conservation of momentum and energy. When a Brillouin elastic medium is irradiated by pump light, it will generate an initial phonon field and seed light. When the amplitude of the sound field is weak, the scattering intensity and efficiency are very low, and it is in the spontaneous Brillouin scattering stage. As the pump intensity increases, when the ratio of seed light intensity to pump light intensity is greater than 10−12, the stimulated scattering stage begins[ Reference Boyd and Rzazewski 29 ]. Scattering efficiency and intensity increase exponentially with increasing pump intensity. The most efficient energy transfer can only be achieved when the difference between the frequency of pump light and the frequency of Stokes light equals the phonon frequency (Brillouin shift). To achieve higher scattering efficiency, the traditional SBS process employs focusing structures to increase pump intensity, thereby enhancing the initial intensity of the Stokes seed light. However, under a high repetition rate and strong pumping, thermally induced breakdown enhancement effects are likely to occur in the focal region.
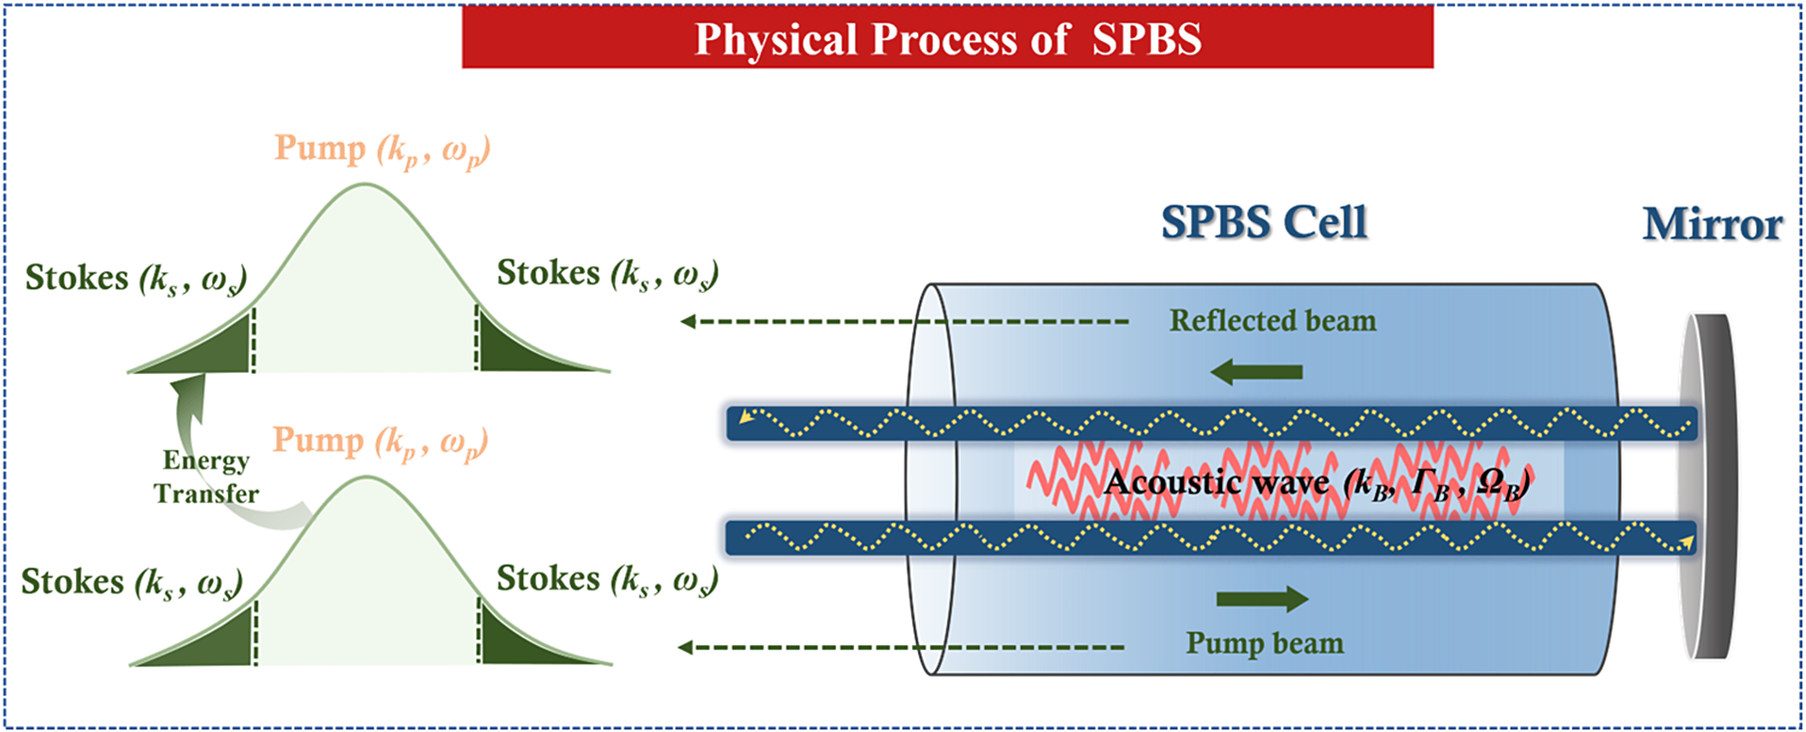
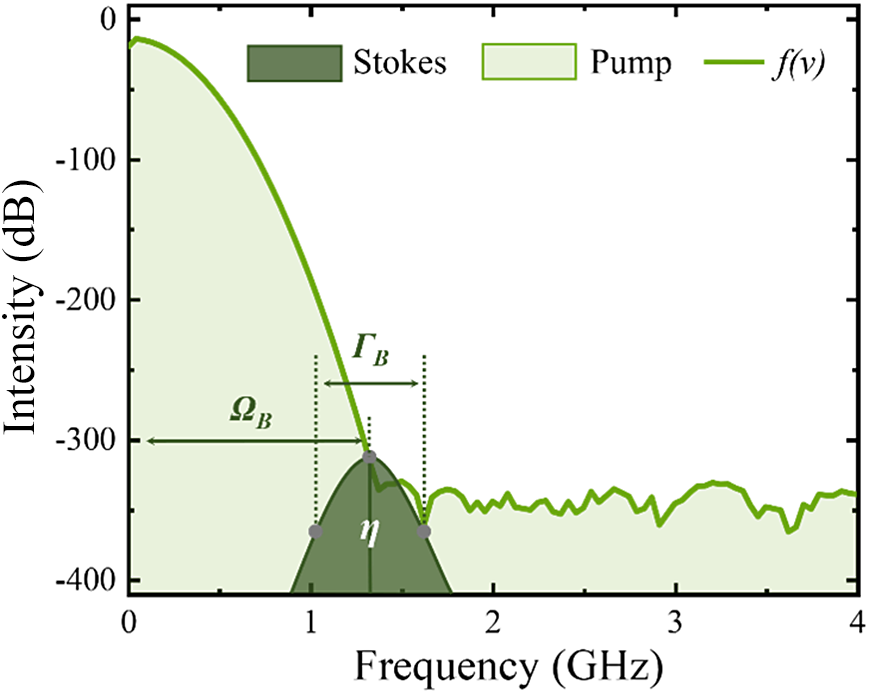
SBS originates from acoustic phonon vibrations, the phonon frequency is relatively low and the Brillouin frequency shift of the common liquid Brillouin medium is only 1–2 GHz. When the pump pulse width is short enough, theoretically the normalized intensity ratio of the Stokes component within the Brillouin linewidth in the spectrum to the main frequency can reach the threshold intensity ratio (10–12) of stimulated scattering. Therefore, even in a non-focused structure, the pump light can still compensate for the gain attenuation caused by the reduction in pump intensity by relying on the interaction with the Stokes light component in its own spectrum, thus achieving the pulse width compression process. We propose a pulse compression technique based on transient SPBS, the physical mechanism and process of which are shown in Figure 1. The spectrum of a short-pulse pump light with a main frequency of ω p contains a certain proportion of Stokes components with a frequency of ω s . The pump light enters the Brillouin medium cell in parallel, exciting the electrostriction effect to generate an acoustic phonon field with a main frequency (Brillouin frequency shift) of Ω B and a gain linewidth (Brillouin linewidth) of Γ B . Subsequently, the pump light is reflected by a 0° mirror behind the medium cell, and the leading edge of the waveform will meet and interact with its subsequent part in the Brillouin medium cell in a completely collinear state. If the normalized intensity ratio of the initial Stokes light component exceeds 10−12, the Stokes component in the reflected pump beam can extract the energy of the incident pump light, thus achieving pulse width compression. The frequency distribution f(v) of the pump light and the normalized intensity ratio η of the initial Stokes component are shown in Figure 2. The value of η is calculated by Equation (1):

Schematic diagram of the SPBS principle.

Figure 1 Long description
The diagram is divided into two main sections. On the left, two stacked spectral plots show the Energy Transfer between a Pump beam and Stokes waves. Each plot features a central light green curve labeled Pump k sub p comma omega sub p and dark green shaded tails labeled Stokes k sub s comma omega sub s. A curved arrow indicates energy moving from the top Pump curve to the bottom Pump curve. On the right, a cylindrical S P B S Cell is shown. A Pump beam enters from the left, travels through the cell, and hits a Mirror on the far right. The beam is then reflected back as a Reflected beam. Inside the cell, two horizontal blue channels contain yellow wavy lines representing light waves. Between these channels, a red jagged line represents an Acoustic wave k sub B comma Gamma sub B comma Omega sub B. Green arrows indicate the direction of the Pump beam moving right and the Reflected beam moving left. Dashed lines connect the Stokes waves from the spectra to the beams exiting the left side of the cell.
Schematic diagram of the pump spectrum and η.

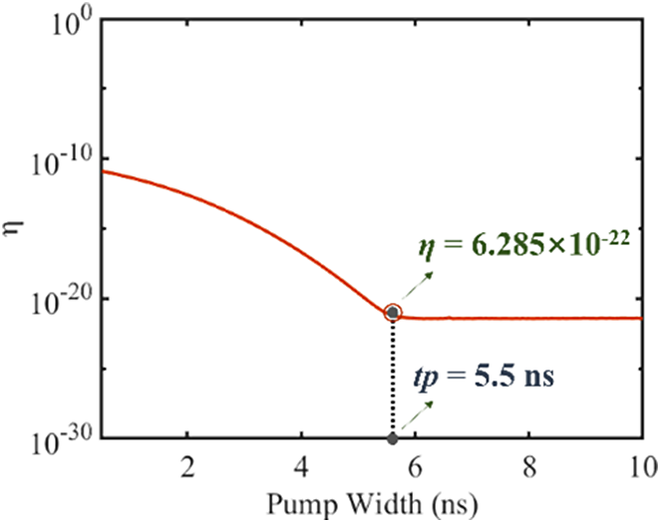
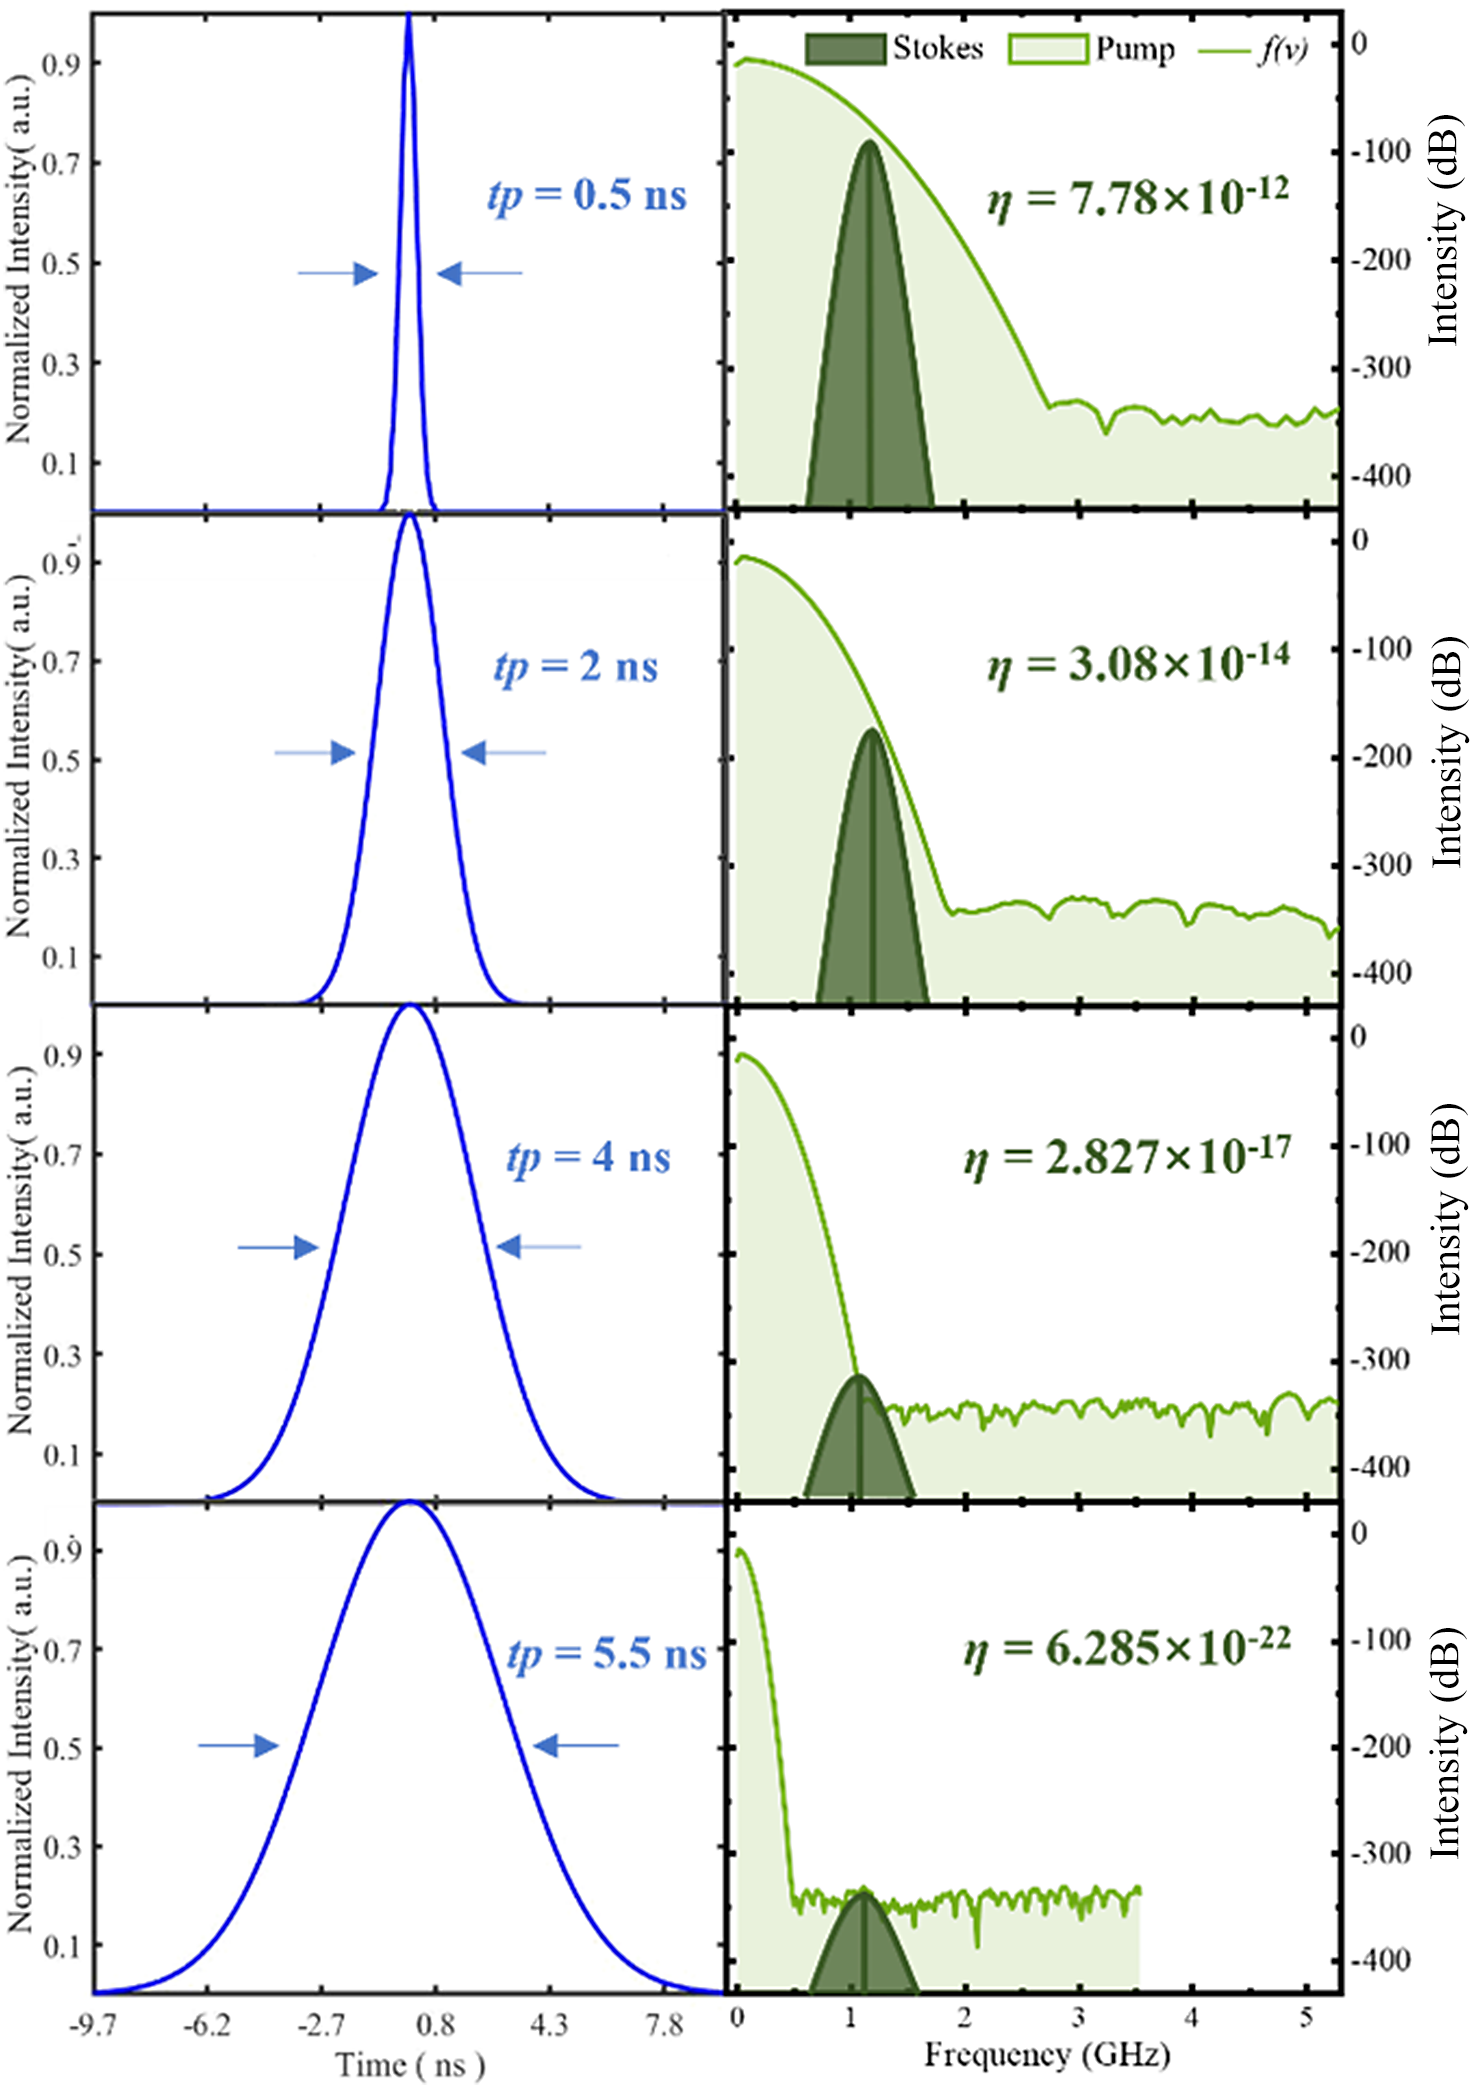
Firstly, the relationship between η and the pump pulse width is simulated, as shown in Figure 3. As the pump pulse width increases, η continuously decreases. When the pump pulse width increases to 5.5 ns, η decreases to 6.285 × 10⁻²² and then remains unchanged. Figure 4 illustrates the time-domain waveforms and corresponding changes in η for different pump pulse widths. The results show that when the pump pulse width is 5.5 ns, the effective frequency range of its spectrum no longer contains the Stokes component, and the η at this time is entirely provided by the thermal noise generated by the zero-point effect of the medium molecules. Therefore, it no longer changes with variations in pump pulse width. Meanwhile, when the pump pulse width is 0.5 ns, η reaches 7.78 × 10⁻¹², which indicates that transient SPBS can theoretically achieve effective pulse compression.
Variation of η with pump pulse width.

Time-domain waveforms of different pump pulse widths and the variation of η in the corresponding spectrum.

Figure 4 Long description
The multiplot consists of four rows. Each row contains a blue line graph on the left and a green shaded area graph on the right.
Left Column: Time-domain waveforms. The x-axis is Time in n s ranging from negative 9.7 to 7.8. The y-axis is Normalized Intensity in a u from 0 to 1.0. As the rows move from top to bottom, the blue pulse width increases.
* Row 1: t p equals 0.5 n s. A very narrow, sharp peak.
* Row 2: t p equals 2 n s. The peak broadens.
* Row 3: t p equals 4 n s. The peak broadens further.
* Row 4: t p equals 5.5 n s. The widest peak, spanning most of the x-axis.
Right Column: Frequency-domain spectra. The x-axis is Frequency in G H z from 0 to 5. The left y-axis is Normalized Intensity in a u and the right y-axis is in d B from 0 to negative 400. Each plot shows a light green Pump area, a dark green Stokes peak, and a green line for f of v. As the pump pulse width increases from top to bottom, the value of eta decreases significantly.
* Row 1: eta equals 7.78 times 10 to the negative 12 power. The Stokes peak is high.
* Row 2: eta equals 3.08 times 10 to the negative 14 power. The Stokes peak height decreases.
* Row 3: eta equals 2.827 times 10 to the negative 17 power. The Stokes peak is much lower.
* Row 4: eta equals 6.285 times 10 to the negative 22 power. The Stokes peak is at its lowest point, nearly reaching the noise floor.
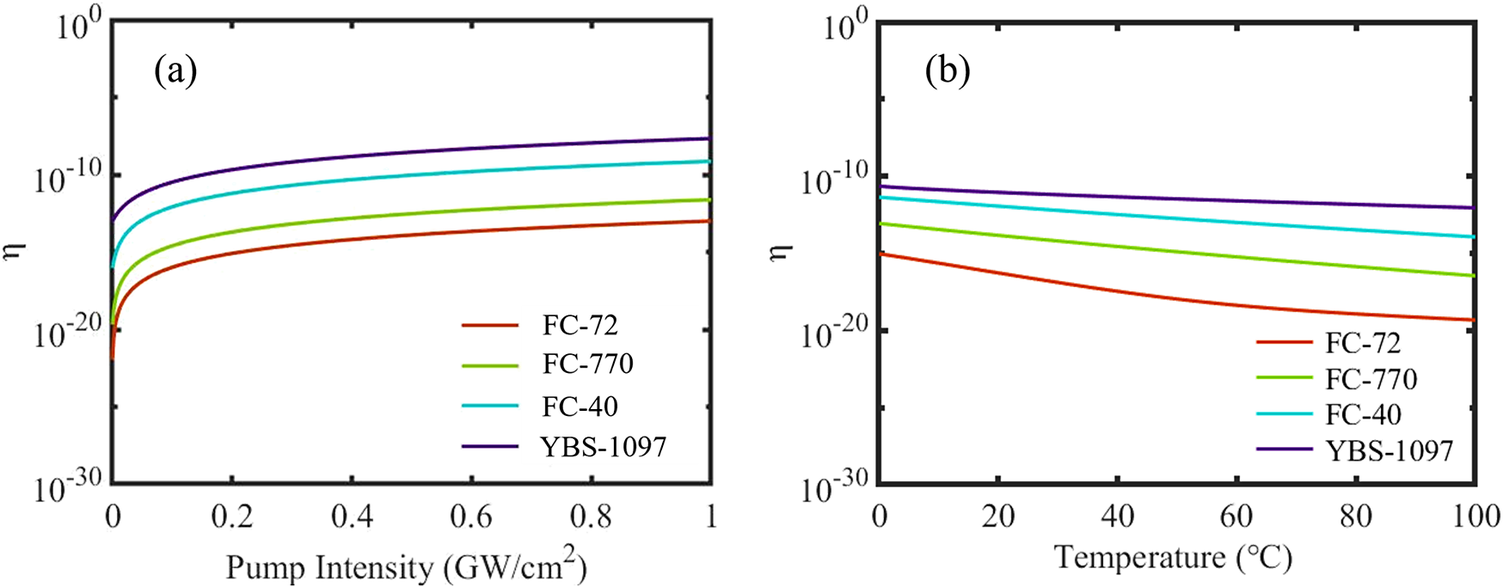
Furthermore, the variation of η with pump intensity in different Brillouin media is simulated, with a diameter of pump spot of 3 mm, as shown in Figure 5(a). Simulation results show that in the initial stage of increased pump intensity, the phonon field starts to build up and strengthen from thermal noise, and η shows a rapid increasing trend. As the pump intensity continues to increase, when the sound field amplitude reaches saturation, the pump intensity is much greater than the sound field intensity, at which point η gradually tends to stabilize. This is because as the pump energy increases, the intensities of all modal components within the pump light spectrum rise; the specific distribution of this energy is described by a convolution process within the coupled-wave equations. In other words, the normalized intensity ratio referred to conceptually is also modulated by the pump intensity in practice. Considering the influence of heat accumulation at high repetition rates on the scattering process, the variation of η with temperature was investigated, as shown in Figure 5(b). As the temperature increases, η continuously decreases. This is because as the temperature increases, the kinematic viscosity decreases, and the Brillouin linewidth of the medium decreases accordingly. The optical properties of the Brillouin medium used are shown in Table 1.
Variation of η with pump intensity and temperature in different media: (a) pump intensity; (b) temperature.

Figure 5 Long description
A two-panel line graph. Both panels share a vertical Y axis labeled with the Greek letter eta, ranging from 10 super negative 30 to 10 super 0 on a logarithmic scale.
Panel a, on the left, plots eta against Pump Intensity in G W per centimeter-squared, ranging from 0 to 1. Four curves show a logarithmic increase, leveling off as intensity increases. From highest eta value to lowest, the media are Y B S-1097 (purple), F C-40 (cyan), F C-770 (light green), and F C-72 (red).
Panel b, on the right, plots eta against Temperature in degrees Celsius, ranging from 0 to 100. All four media show a linear decrease in eta as temperature rises. The vertical stacking of the media remains consistent with panel a, with Y B S-1097 at the top and F C-72 at the bottom.
Both panels include a legend in the bottom right corner identifying the four media by color.
Partial optical properties of the selected Brillouin media.

Table 1 Long description
The table consists of four columns and five rows including the header.
Column 1: Medium.
Column 2: Absorption coefficient alpha in units of cm super negative 1 at 300 Hz.
Column 3: Brillouin linewidth Gamma sub B in M H z.
Column 4: Brillouin frequency shift omega sub B in M H z.
Row 1: F C dash 72 has an absorption coefficient of 3.92 times 10 super negative 3, a linewidth of 270, and a frequency shift of 1100.
Row 2: F C dash 770 has an absorption coefficient of 3.65 times 10 super negative 3, a linewidth of 575, and a frequency shift of 1081.
Row 3: F C dash 40 has an absorption coefficient of 3 times 10 super negative 3, a linewidth of 1292, and a frequency shift of 1386.
Row 4: Y B S dash 1097 has an absorption coefficient of 1.5 times 10 super negative 3, a linewidth of 7235, and a frequency shift of 1585.
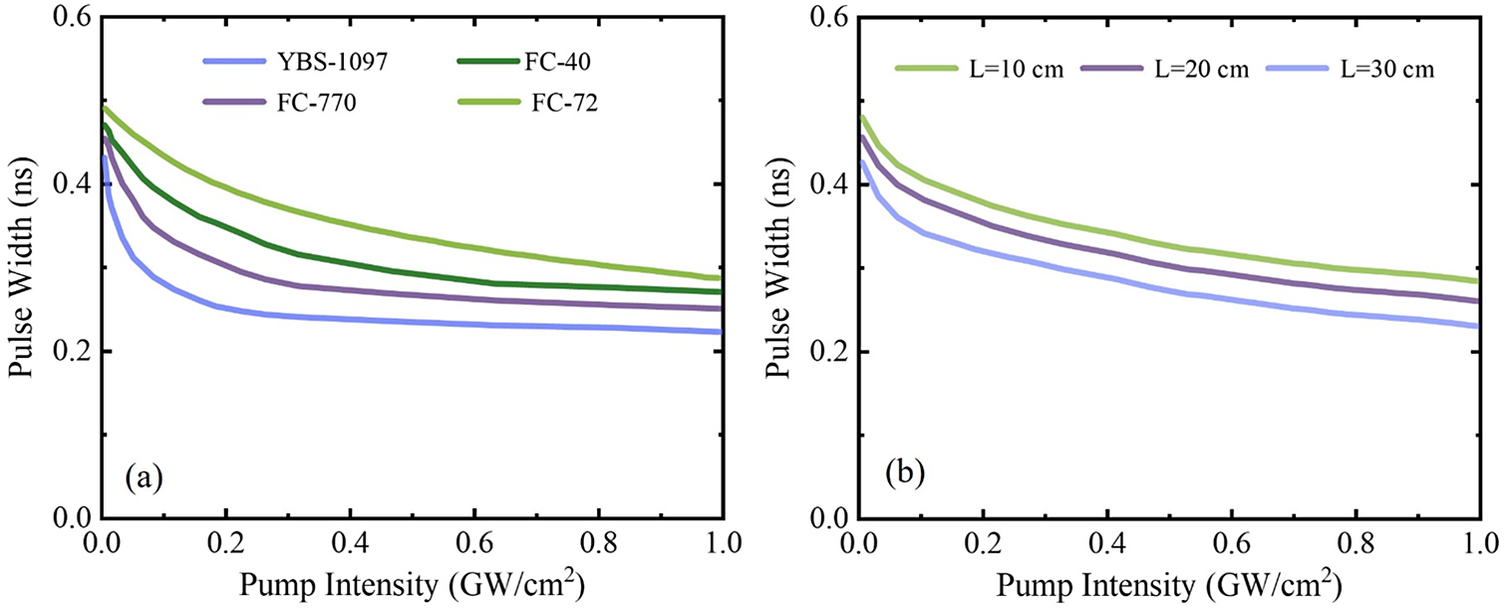
Based on previous simulation results, a pump pulse width of 0.5 ns and a maximum pump energy of 30 mJ are selected. The output pulse width of the transient SPBS is simulated as a function of pump intensity, as shown in Figure 6. The results show that pulse width compression occurred in all four selected Brillouin media, with the narrowest compressed pulse width, approximately 230 ps, obtained in YBS-1097, as shown in Figure 6(a). This is because of its larger Brillouin linewidth and faster sound field setup. Meanwhile, the greater the interaction length, the smaller the compression pulse width, which is consistent with the traditional SBS pattern, as shown in Figure 6(b). In summary, the simulation results demonstrate that the pump pulse width is the key factor determining η, and the transient SPBS with a pump pulse width of 0.5 ns has significant compression capacity. On the other hand, η is the core parameter that determines the compression characteristics of transient SPBS. The variation of η with temperature proves that the heat accumulation problem caused by the high repetition rate will restrict the output characteristics of transient SPBS.
Variation of output pulse width with pump intensity: (a) different media; (b) different interaction lengths.

Figure 6 Long description
The figure consists of two side-by-side line graphs. Both graphs share the same axes: the horizontal x-axis represents Pump Intensity in G W forward slash c m squared, ranging from 0.0 to 1.0. The vertical y-axis represents Pulse Width in n s, ranging from 0.0 to 0.6. All curves show a non-linear decrease in pulse width as pump intensity increases, with the steepest drop occurring between 0.0 and 0.2 G W forward slash c m squared before leveling off.
Panel a, labeled a in the bottom left, compares four media. From top to bottom, the curves are:
- F C dash 72 (light green): Starts near 0.5 n s and ends near 0.3 n s.
- F C dash 40 (dark green): Starts near 0.48 n s and ends near 0.28 n s.
- F C dash 770 (purple): Starts near 0.46 n s and ends near 0.25 n s.
- Y B S dash 1097 (blue): Starts near 0.42 n s and ends near 0.22 n s.
Panel b, labeled b in the bottom left, compares three interaction lengths L. From top to bottom, the curves are:
- L equals 10 c m (light green): Highest pulse width values.
- L equals 20 c m (purple): Intermediate pulse width values.
- L equals 30 c m (blue): Lowest pulse width values, starting near 0.42 n s and ending near 0.23 n s.
3 Experimental setup
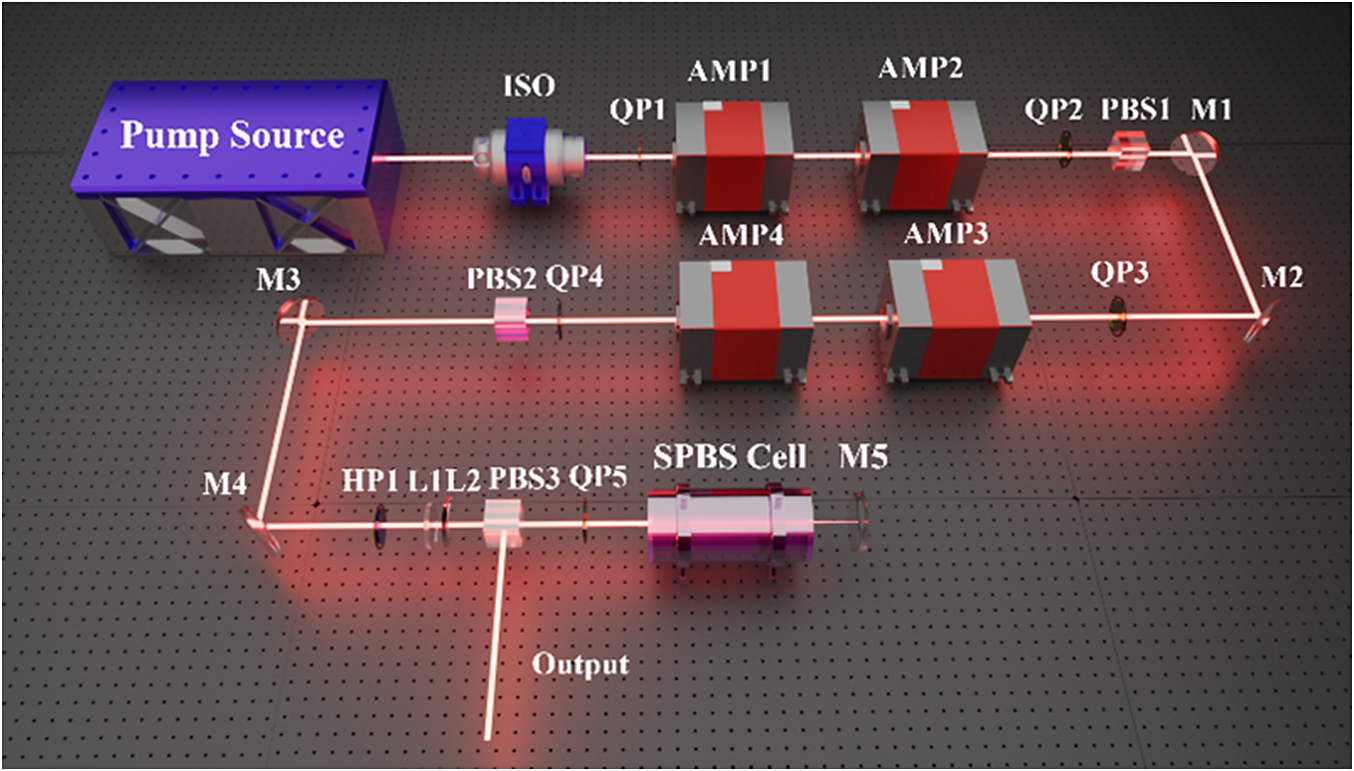
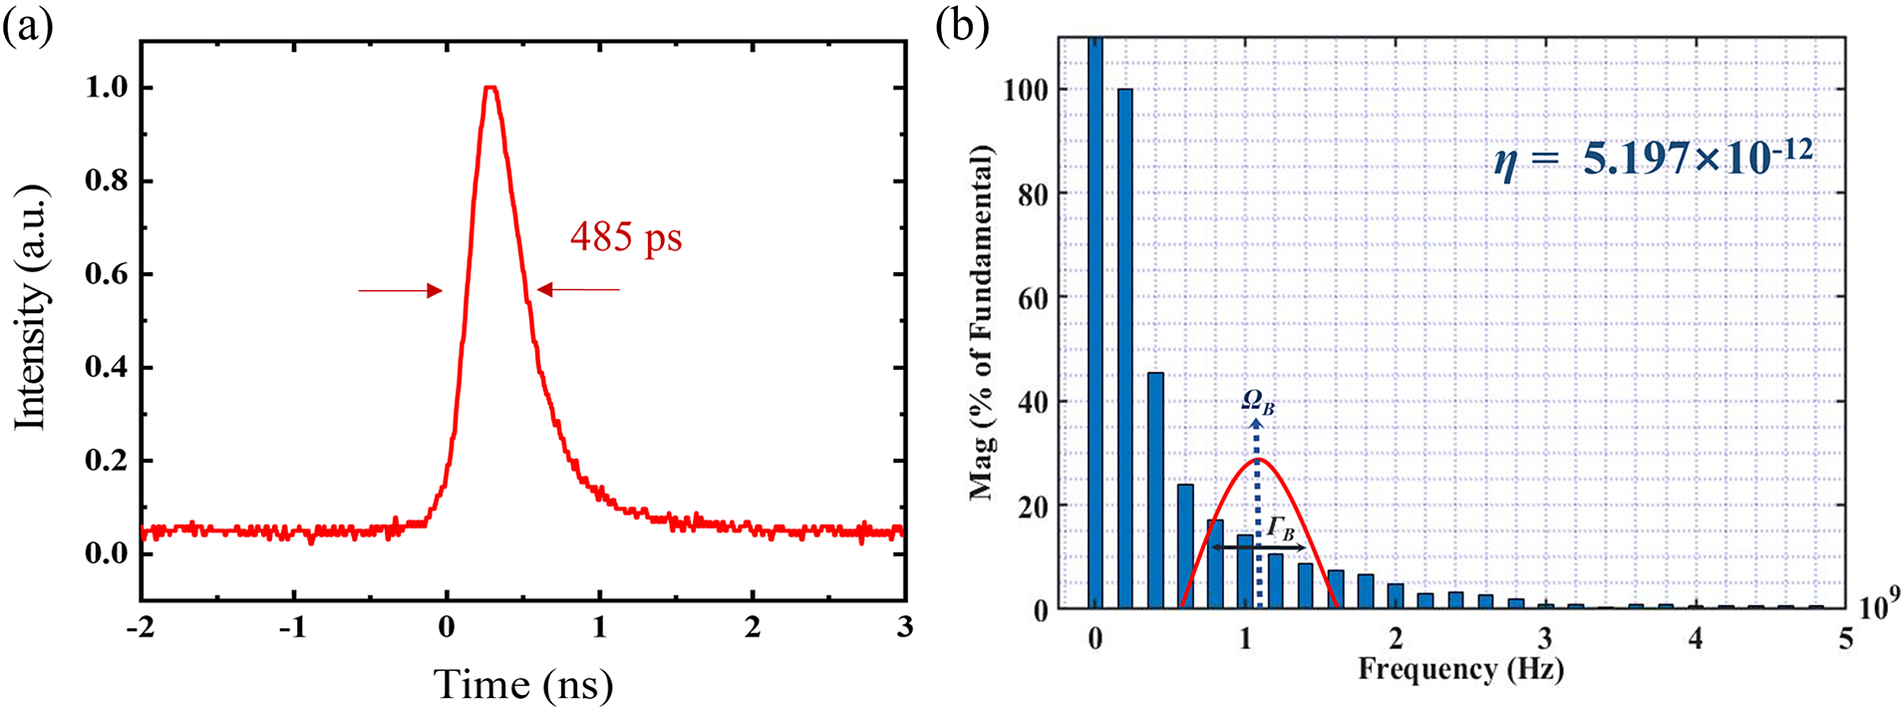
A schematic diagram of the optical path of the high-repetition-rate transient SPBS pulse compression system is shown in Figure 7. The seed source is self-built passively Q-switched microchip single longitudinal mode (SLM) laser with an adjustable repetition rate of 1–1000 Hz, pulse width of 480 ps and single pulse energy of 60 μJ. The time-domain waveform and corresponding spectrum are shown in Figure 8. The isolator (ISO) is placed between the seed source and the amplifier to prevent backscattered light during the SPBS process from damaging the seed source. After the pump light passes through amplifiers AMP1 and AMP2, the energy is amplified to 7 mJ. Two quarter-wave plates, QP1 and QP2, form a ‘twisted pendulum’ to improve the spatial distribution uniformity of energy extraction and compensate the deterioration effect of thermal depolarization on spot morphology. PBS1 is used to filter out the depolarization component to ensure the polarization degree of laser. The laser is amplified to 60 mJ by AMP3 and AMP4, then passes through the energy regulator composed of half-wave plate HP1 and PBS3 after thermal depolarization compensation and depolarization filtering, and enters the SPBS compression system through the quarter-wave plate QP5. We place high-reflection mirror M5 behind the medium cell, which is close to the rear window mirror of the medium cell to avoid the waste of effective length. During the experiment, the effective energy of the reflected pump light was varied by adjusting the reflectivity of mirror M5 to investigate its influence on the compression capability of SPBS. The collinear reflection of the incident pump light allows its leading edge to interact with the subsequent portion, and the compressed short-pulse light is output through PBS3.
Schematic diagram of the experimental optical path.

Figure 7 Long description
The optical path begins at the top-left with a blue rectangular Pump Source. A red laser beam exits to the right, passing through an I S O component. It then enters the first amplification stage, passing through Q P 1, A M P 1, and A M P 2. After A M P 2, the beam passes through Q P 2 and P B S 1 before hitting mirror M 1. Mirror M 1 reflects the beam downward to mirror M 2, which reflects it to the left. The beam then enters the second amplification stage, passing through Q P 3, A M P 3, and A M P 4. Continuing left, it passes through Q P 4 and P B S 2 before reaching mirror M 3. Mirror M 3 reflects the beam downward to mirror M 4, which reflects it back to the right. This final horizontal segment contains H P 1, lenses L 1 and L 2, and P B S 3. After P B S 3, the beam passes through Q P 5 and enters a large cylindrical S P B S Cell. A final mirror M 5 is positioned at the end of the cell. A secondary beam labeled Output exits downward from P B S 3.
Time-frequency characteristics of pump light: (a) time-domain waveform; (b) η of the spectrum.

Figure 8 Long description
The figure consists of two panels labeled a and b.
Panel a is a line graph showing a time-domain waveform. The x-axis represents Time in n s ranging from negative 2 to 3. The y-axis represents Intensity in a dot u dot ranging from 0.0 to 1.0. A single red pulse peaks at approximately 0.3 n s. Two horizontal red arrows point inward toward the pulse width, which is labeled as 485 p s.
Panel b is a bar chart showing the magnitude of the spectrum. The x-axis represents Frequency in H z ranging from 0 to 5 times 10 super 9. The y-axis represents Mag as a percentage of Fundamental ranging from 0 to 100. Blue vertical bars decrease in height as frequency increases. A red bell-shaped curve is superimposed over the bars between 0.5 and 1.5 on the x-axis. A vertical dashed blue arrow points to the peak of this curve, labeled Omega sub B. A horizontal double-headed black arrow indicates the width of the curve, labeled Gamma sub B. In the top right quadrant, an equation states eta equals 5.197 times 10 super negative 12.
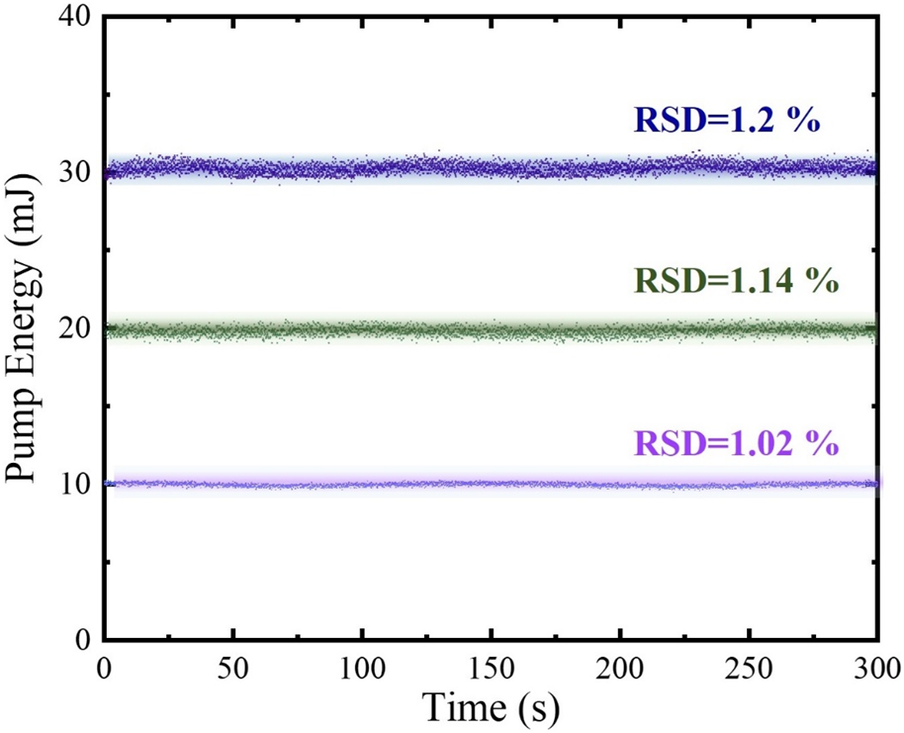
Since energy stability is one of the research focuses of this study, in order to eliminate the influence of energy fluctuations of the pump light on the experimental results, we measure the RSD of different pump energies at a repetition rate of 300 Hz, as shown in Figure 9. An increase in pump energy results in a slight rise in RSD, which may be due to the amplified spontaneous emission (ASE) effect caused by the increased pump power of the laser diode (LD) amplifier or a minor impact of temperature changes on its stability. The pump energy was continuously measured for more than 5 minutes (about 10,000 pulses) using an energy meter (Vega Pyroelectric PE-50-DIF-E, Ophir Optronics, Israel) to obtain the standard deviation reading. Then, a set of RSD1 values was calculated. The average value of five sets of measurements was taken as the final energy RSD. All RSDs presented in this paper follow this measurement method.
RSD of different pump energies.

4 Results
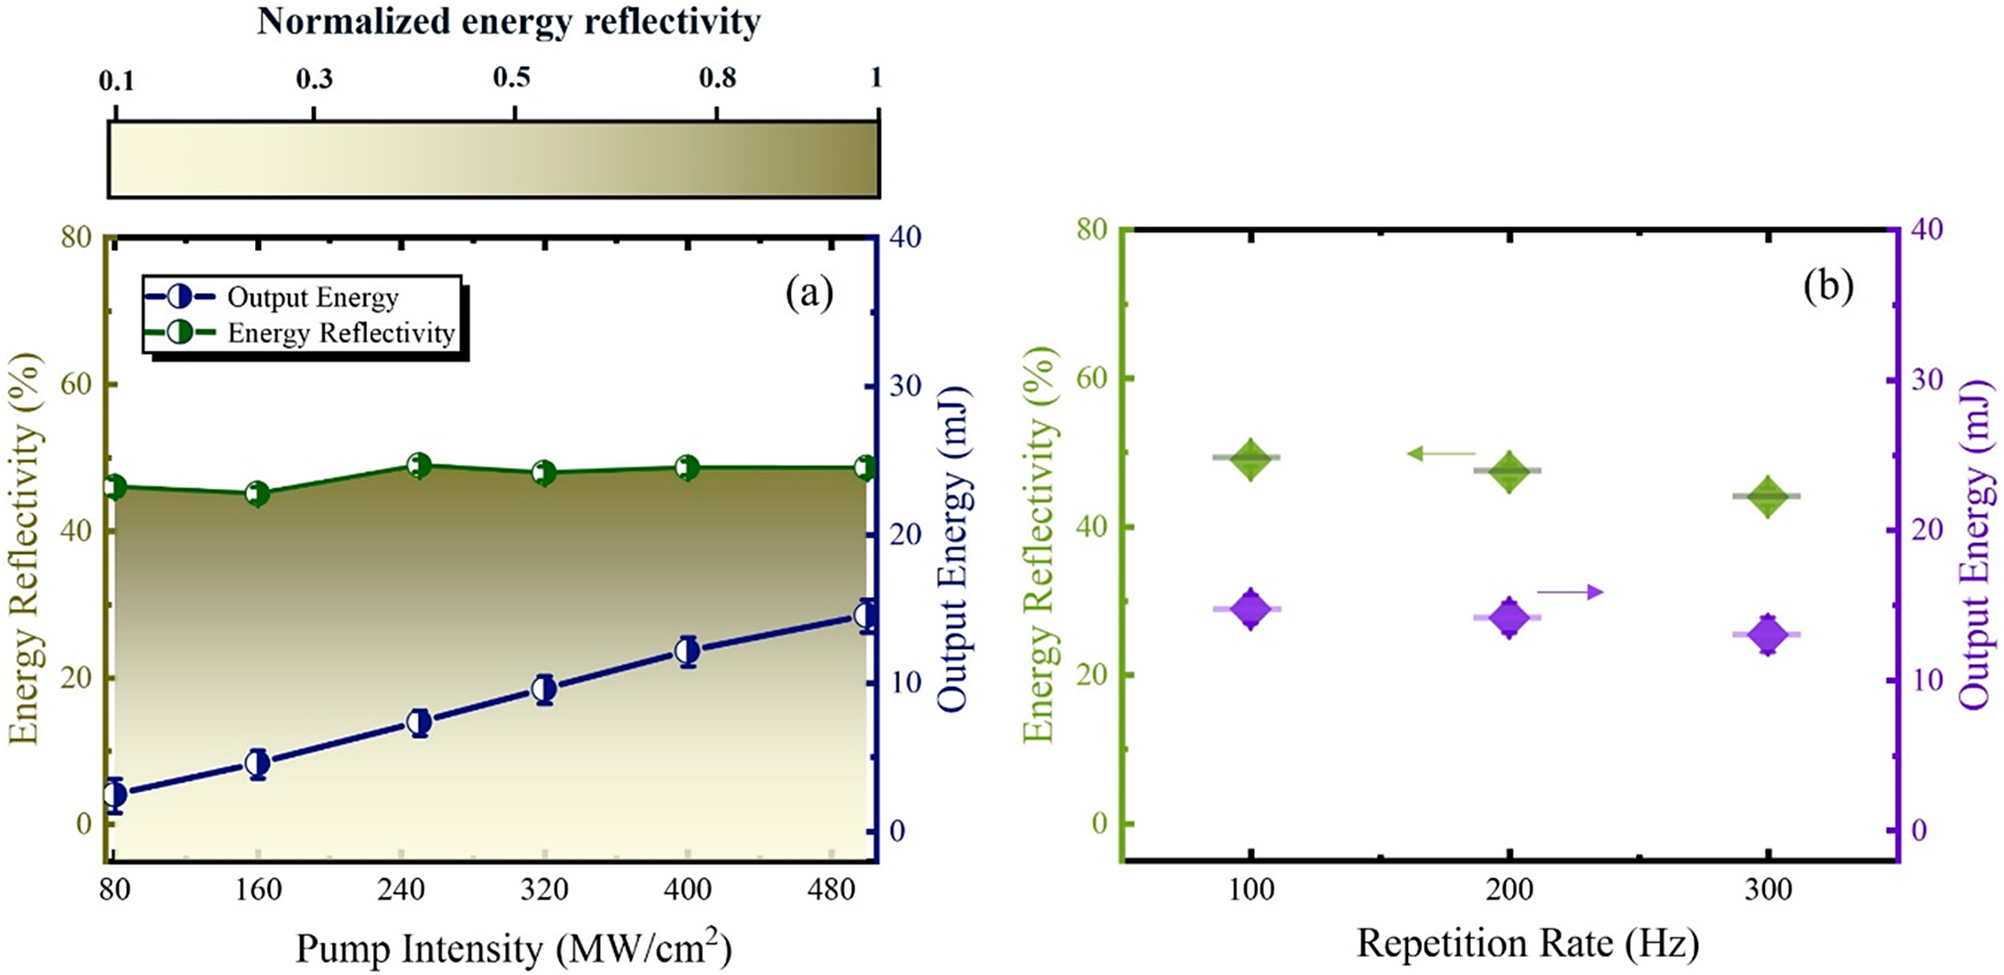
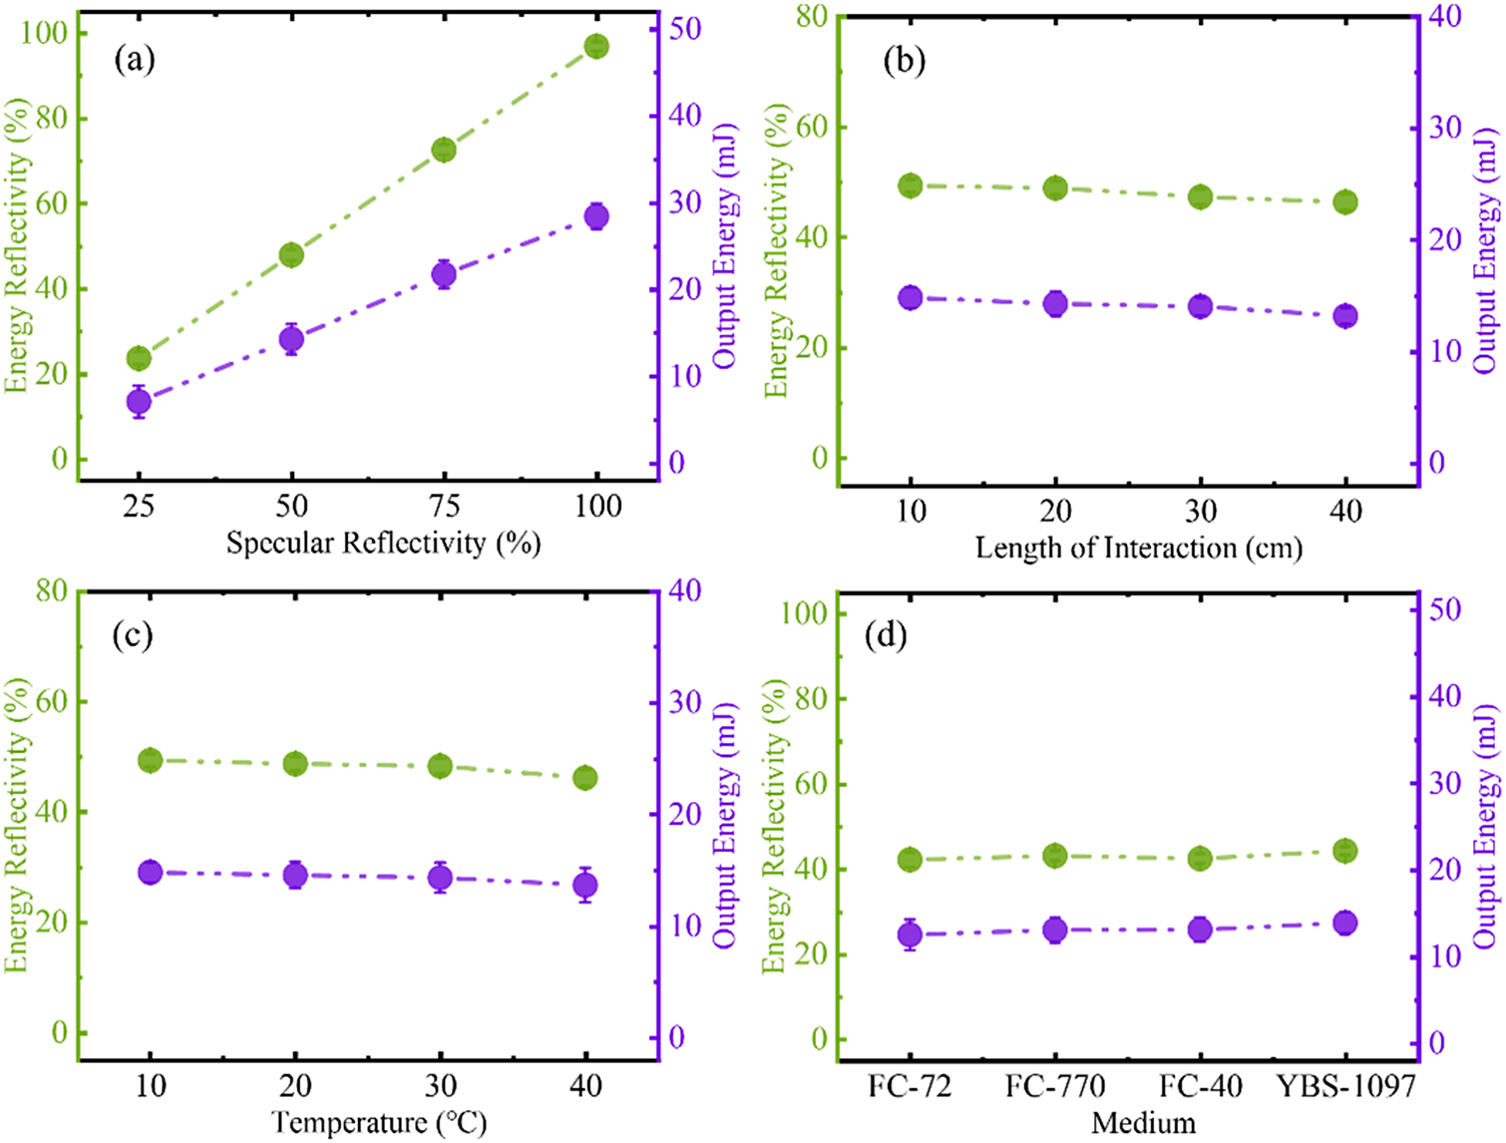
Firstly, when the reflectivity of M5 is 50%, the changes in energy reflectivity and output energy with pump intensity are measured at a repetition rate of 100 Hz, as shown in Figure 10(a). The results show that as the pump intensity increases, the energy reflectivity remains basically unchanged at about 48%. The output energy shows a linear growth trend, and the energy loss is due to the absorption of the medium and the reflection of the window mirror. As the repetition rate increases to 300 Hz, the energy reflectivity gradually decreases to 46%, which is due to the increase in medium absorption, as shown in Figure 10(b). Figure 11 illustrates the variation of energy reflectivity and output energy with different structural and medium parameters at a repetition rate of 300 Hz.
Variation of energy reflectivity and output energy with pump parameters: (a) pump intensity; (b) repetition rate.

Figure 10 Long description
Panel a is a line graph with a color-coded legend. The horizontal axis is Pump Intensity in M W forward slash c m squared, ranging from 80 to 480. The left vertical axis is Energy Reflectivity in percent, ranging from 0 to 80. The right vertical axis is Output Energy in m J, ranging from 0 to 40. A dark green line with half-filled circles represents Energy Reflectivity, which remains nearly constant at approximately 45 to 50 percent across the intensity range. A dark blue line with half-filled circles represents Output Energy, showing a linear increase from approximately 5 m J at 80 M W forward slash c m squared to nearly 15 m J at 480 M W forward slash c m squared. A color scale bar at the top indicates Normalized energy reflectivity from 0.1 to 1.
Panel b is a scatter plot. The horizontal axis is Repetition Rate in H z, with data points at 100, 200, and 300. The left vertical axis is Energy Reflectivity in percent and the right vertical axis is Output Energy in m J. Green diamond markers with a left-pointing arrow correspond to the left axis, showing a slight decrease from 50 percent at 100 H z to approximately 45 percent at 300 H z. Purple diamond markers with a right-pointing arrow correspond to the right axis, showing a slight decrease from approximately 15 m J at 100 H z to 13 m J at 300 H z.
Variation of energy reflectivity and output energy with structural and medium parameters: (a) specular reflectivity; (b) interaction length; (c) temperature; (d) medium.

Figure 11 Long description
The multi-panel figure consists of four graphs labeled a through d. Each graph features a primary green Y-axis on the left for Energy Reflectivity in percent and a secondary purple Y-axis on the right for Output Energy in m J.
Panel a. The X-axis is Specular Reflectivity in percent ranging from 25 to 100. Both Energy Reflectivity green dashed line with circles and Output Energy purple dashed line with circles show a strong linear increase. Energy Reflectivity rises from approximately 25 percent to nearly 100 percent, while Output Energy rises from 7 m J to approximately 28 m J.
Panel b. The X-axis is Length of Interaction in c m ranging from 10 to 40. Both metrics show a slight linear decrease. Energy Reflectivity starts near 50 percent and drops to about 45 percent. Output Energy starts near 15 m J and drops to about 13 m J.
Panel c. The X-axis is Temperature in degrees Celsius ranging from 10 to 40. Both metrics show a very slight downward trend. Energy Reflectivity remains near 50 percent and Output Energy remains near 15 m J.
Panel d. The X-axis represents different Medium types: F C dash 72, F C dash 770, F C dash 40, and Y B S dash 1097. Both metrics remain nearly constant across all media, with Energy Reflectivity at approximately 42 percent and Output Energy at approximately 13 m J.
The results show that the output energy and reflectivity are determined by the mirror reflectivity, as shown in Figure 11(a). Due to the influence of medium absorption, they decrease slightly with the increase of the interaction length and temperature, as shown in Figures 11(b) and 11(c). In YBS-1097, the medium with the lowest absorption coefficient, the energy reflectivity can reach approximately 48.5%, which is 4% higher than that in FC-72, as shown in Figure 11(d). The temperature of the medium is regulated by an external water-cooling system.
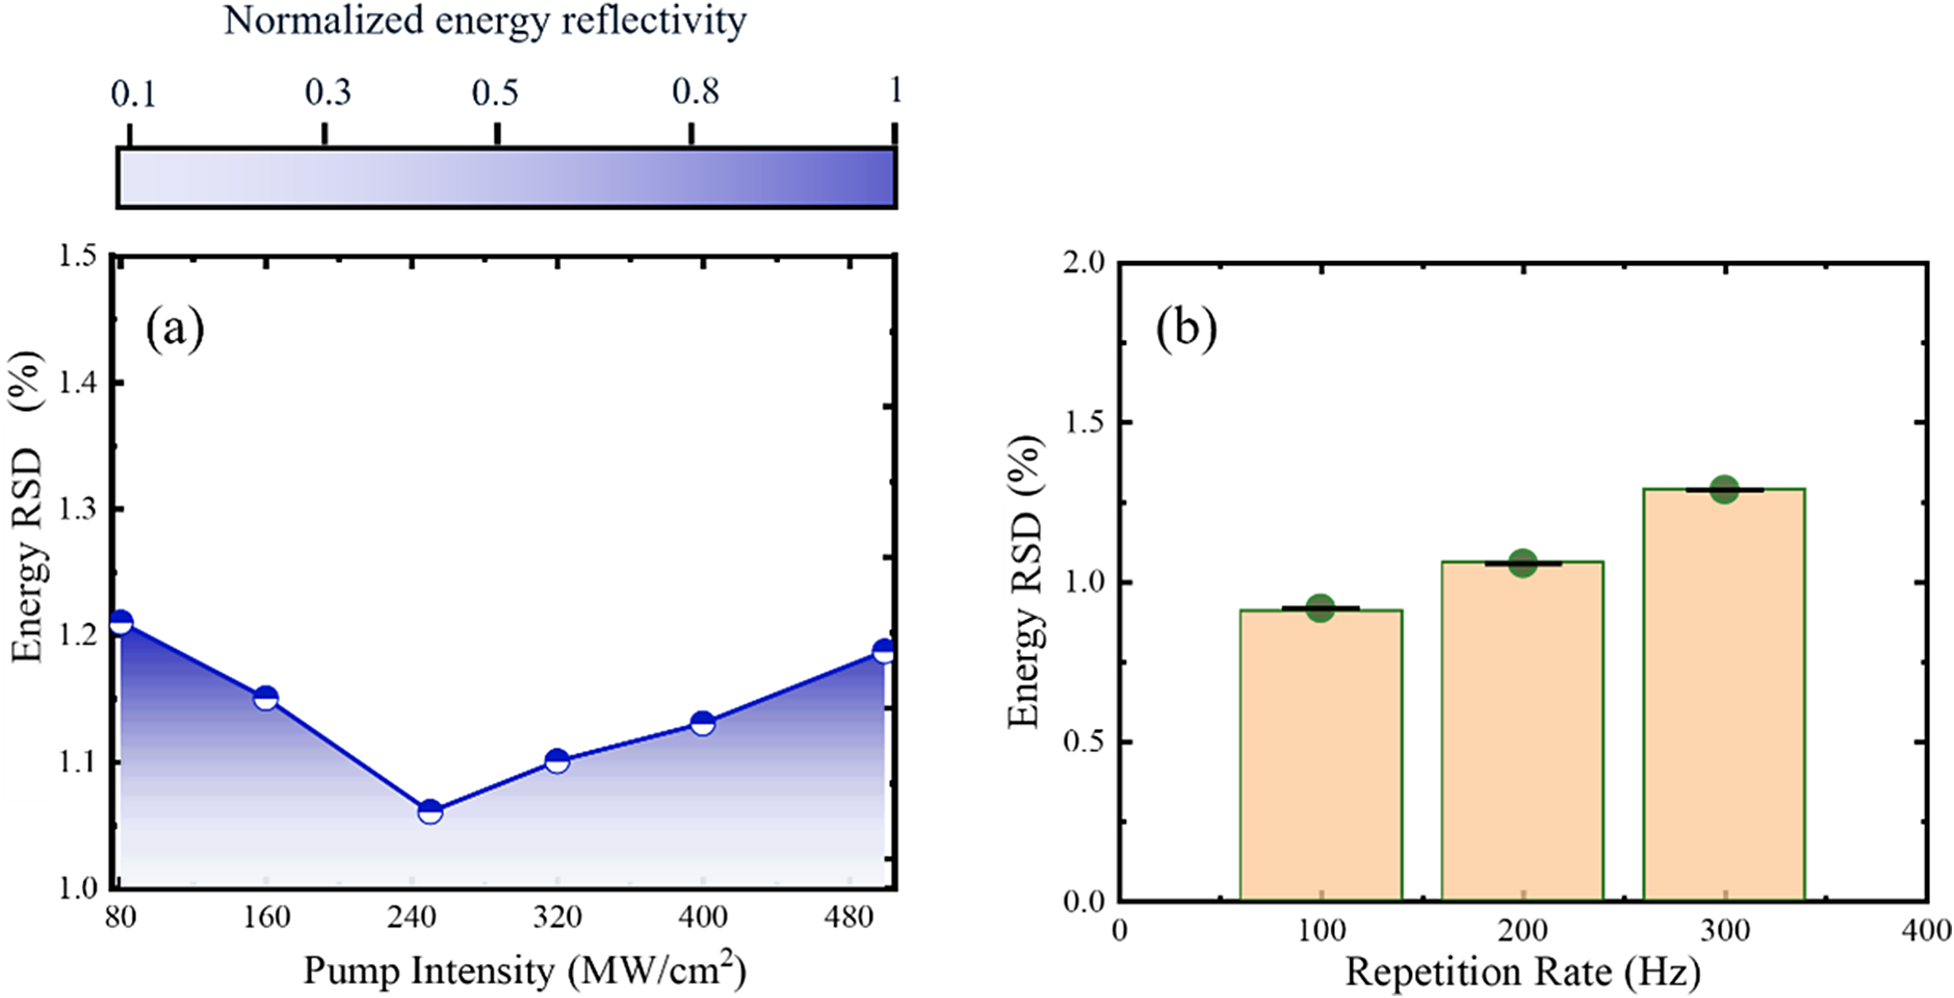
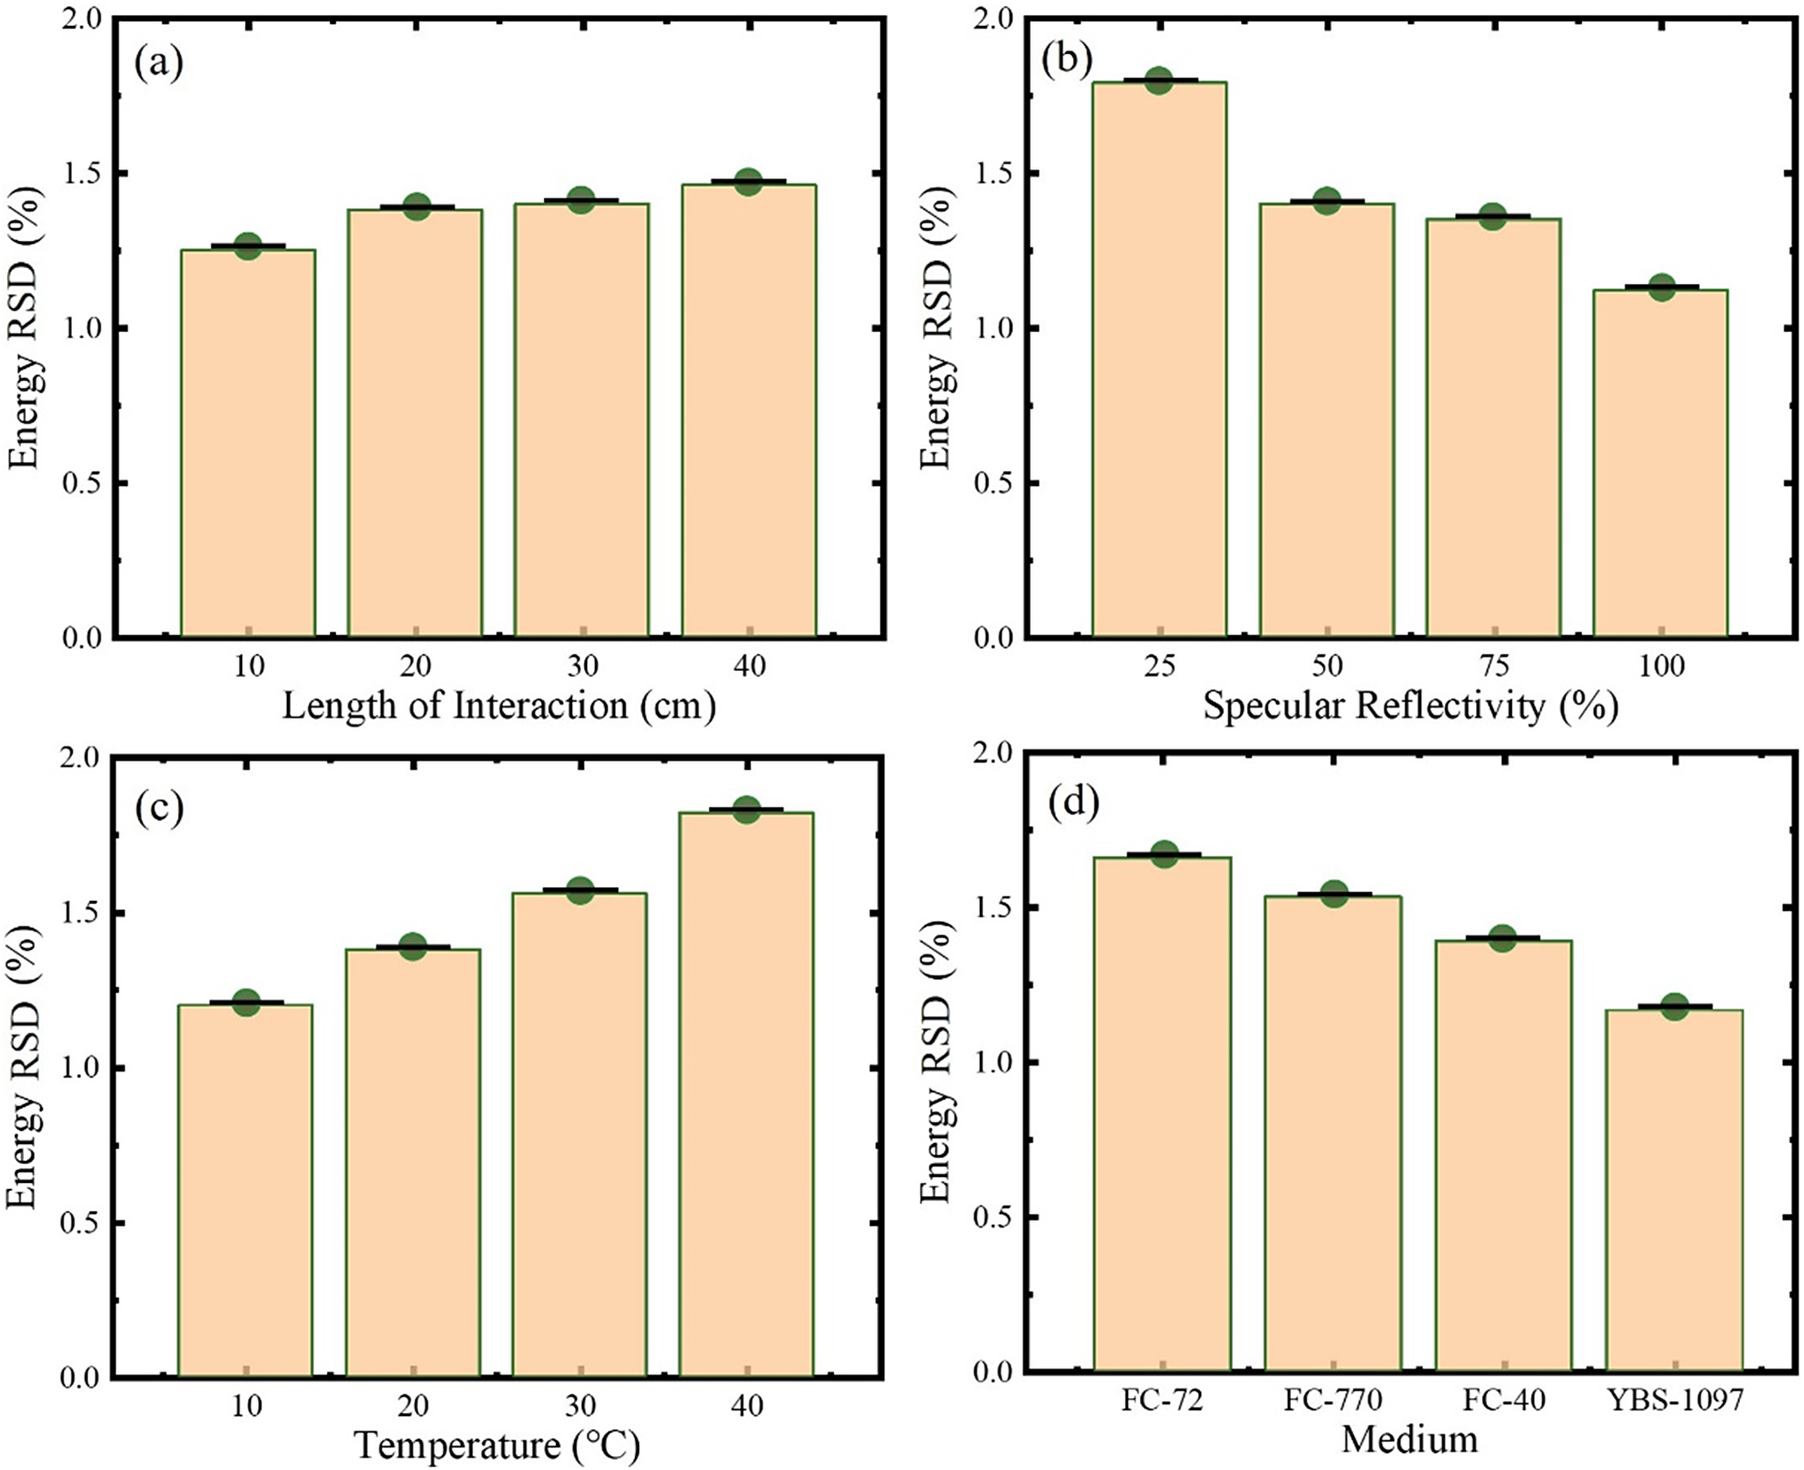
The variation of energy stability RSD with pump intensity and repetition rate is investigated, as shown in Figure 12. As the pump intensity increases, the RSD shows a trend of first decreasing and then increasing, with the pump intensity corresponding to the inflection point being approximately 240 MW/cm2. Within the low-intensity range, increasing the pump intensity can raise η, thereby improving the stability of the SPBS process. When the pump intensity is too high, the intensity of the SBS-Stokes seed light, which originates from thermal noise, increases and competes with the Stokes component in the pump light, causing the acoustic field stability to deteriorate and the RSD to increase, as shown in Figure 12(a). Meanwhile, as the repetition rate increases, the interference of thermal noise becomes more severe, and the RSD continues to rise, as shown in Figure 12(b). Figure 13 shows the variation of energy RSD under different structural and medium parameters. As the temperature increases, the RSD rises from 1.17% to 1.85%, which indicates the deteriorating effect of thermal accumulation on the scattering process, as shown in Figure 13(c). As the specular reflectivity and Brillouin linewidth increase, η rises accordingly. Before the effective intensity of the SBS-Stokes seed light is excited, the RSD shows a decreasing trend, as shown in Figures 13(b) and 13(d).
Variation of energy RSD with pump parameters: (a) pump intensity; (b) repetition rate.

Figure 12 Long description
Panel a is a line graph with a color-coded legend at the top for Normalized energy reflectivity ranging from 0.1 in white to 1 in dark blue. The y-axis is Energy R S D in percent ranging from 1.0 to 1.5. The x-axis is Pump Intensity in M W per centimeter-squared ranging from 80 to 480. A blue line with circular markers shows a V-shaped trend. It starts at 1.21 percent at 80 M W per centimeter-squared, decreases to a minimum of 1.06 percent at 240 M W per centimeter-squared, and then increases linearly to 1.19 percent at 480 M W per centimeter-squared. The area under the line is shaded with a blue gradient corresponding to the reflectivity scale.
Panel b is a bar chart. The y-axis is Energy R S D in percent ranging from 0.0 to 2.0. The x-axis is Repetition Rate in H z ranging from 0 to 400. Three light orange bars with green outlines and dark green circular markers at the top represent data at 100, 200, and 300 H z. The Energy R S D shows a linear increase with repetition rate, measuring approximately 0.9 percent at 100 H z, 1.1 percent at 200 H z, and 1.3 percent at 300 H z. Each bar includes a small black horizontal error bar at the peak.
Variation of energy RSD with structural and medium parameters: (a) interaction length; (b) specular reflectivity; (c) temperature; (d) medium.

Figure 13 Long description
A four-panel set of bar graphs. All panels share a Y-axis labeled Energy R S D in percent, ranging from 0.0 to 2.0.
Panel a, top-left. The X-axis is Length of Interaction in centimeters. Bars show a slight linear increase in R S D as length increases. Values are approximately 1.25 at 10, 1.38 at 20, 1.40 at 30, and 1.45 at 40.
Panel b, top-right. The X-axis is Specular Reflectivity in percent. Bars show a downward trend. Values start at approximately 1.8 at 25 percent reflectivity and decrease to 1.4 at 50, 1.35 at 75, and 1.1 at 100.
Panel c, bottom-left. The X-axis is Temperature in degrees Celsius. Bars show a steady increase. Values are approximately 1.2 at 10 degrees, 1.38 at 20 degrees, 1.55 at 30 degrees, and 1.82 at 40 degrees.
Panel d, bottom-right. The X-axis is Medium. Bars show a decreasing trend across four types. F C dash 72 is approximately 1.65, F C dash 770 is 1.55, F C dash 40 is 1.4, and Y B S dash 1097 is 1.18.
Each bar is light orange with a green outline, topped with a dark green circular data point and a black horizontal error bar.
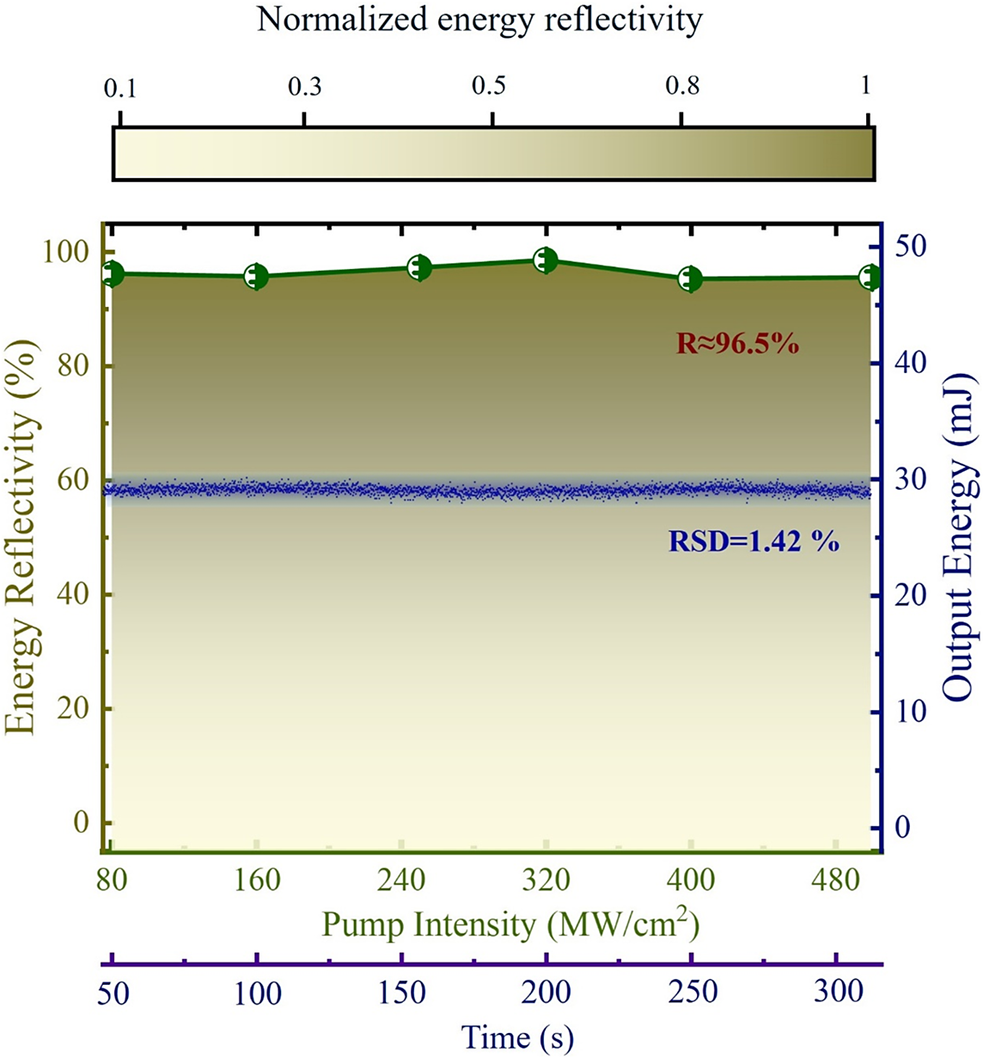
Ultimately, we select a high-reflectivity mirror with a reflectivity of 99.9% as the feedback source for the high-repetition-rate transient SPBS compression process. The effective interaction length of 10 cm and the temperature of YBS-1097 of 10°C are used. The laser output achieved an average energy reflectivity of approximately 95% and an RSD of 1.42%, as shown in Figure 14. The results show that in transient SPBS with low pump intensity, even with the enhancement effect of thermal accumulation, the optical breakdown is completely avoided and the energy stability is not significantly degraded. Meanwhile, due to the high feedback effect of the reflector, the transmission loss of SPBS is almost zero, and the system loss comes only from the medium absorption effect. The problem of low energy reflectivity caused by transient effects is also solved. However, as a pulse width compression technology, its compression capability is the core parameter that needs to be focused on.
Output energy reflectivity and RSD of high-repetition-rate transient SPBS.

Figure 14 Long description
At the top is a horizontal color scale bar for Normalized energy reflectivity ranging from 0.1 in white to 1 in dark gold. The main plot features two x-axes and two y-axes. The primary x-axis at the bottom represents Pump Intensity in M W forward slash cm squared ranging from 80 to 480. Below it is a secondary x-axis for Time in seconds ranging from 50 to 300. The left y-axis represents Energy Reflectivity in percent from 0 to 100. The right y-axis represents Output Energy in m J from 0 to 50.
Data trends include:
* A dark green line with circular markers at the top of the plot remains stable near 96.5 percent reflectivity. A text label in dark red reads R is approximately 96.5 percent.
* A dense horizontal band of blue dots is centered around 29 m J on the right y-axis. A text label in dark blue reads R S D equals 1.42 percent.
* The background of the plot area features a vertical gradient from white at the bottom to dark gold at the top, corresponding to the reflectivity scale.
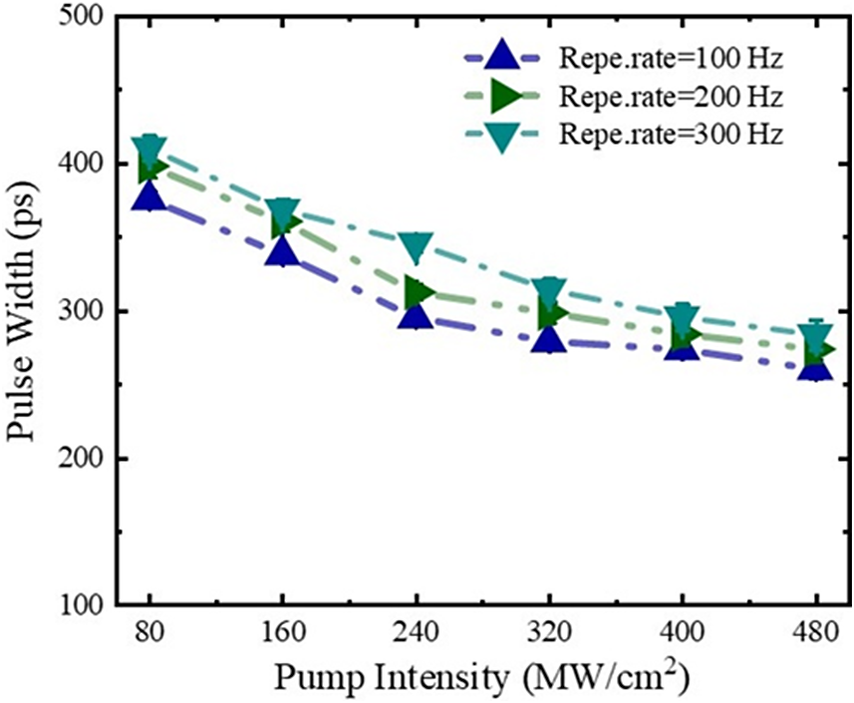
To verify the compression capacity of the high-repetition-rate transient SPBS, the evolution of the output pulse width with pump intensity at different repetition rates is investigated experimentally, as shown in Figure 15. As the pump intensity increases, the output pulse width shows a continuous decreasing trend, and it has not yet reached saturation within the existing pump intensity range. If the pump intensity is further increased, the compression pulse width can be further reduced, but the stability may deteriorate. As the repetition rate increases, the compression pulse width widens slightly, which is due to the decrease in kinematic viscosity of the medium in the interaction zone caused by heat accumulation. The compression pulse width is approximately 278 ps ± 3.5 ps with the pump intensity of 480 MW/cm2 and the repetition rate of 300 Hz.
Variation of compression pulse width with pump intensity at different repetition rates.

Figure 15 Long description
The horizontal X axis represents Pump Intensity in M W forward slash c m squared with values from 80 to 480. The vertical Y axis represents Pulse Width in p s with values from 100 to 500. Three data series are plotted with dashed lines and triangular markers.
* The top series, Repe dot rate equals 300 H z, uses downward pointing teal triangles. It starts at approximately 415 p s at 80 intensity and decreases to about 285 p s at 480 intensity.
* The middle series, Repe dot rate equals 200 H z, uses rightward pointing green triangles. It starts at approximately 400 p s at 80 intensity and decreases to about 275 p s at 480 intensity.
* The bottom series, Repe dot rate equals 100 H z, uses upward pointing dark blue triangles. It starts at approximately 375 p s at 80 intensity and decreases to about 260 p s at 480 intensity.
All three curves show a non-linear decay where the rate of decrease in pulse width slows down as pump intensity increases.
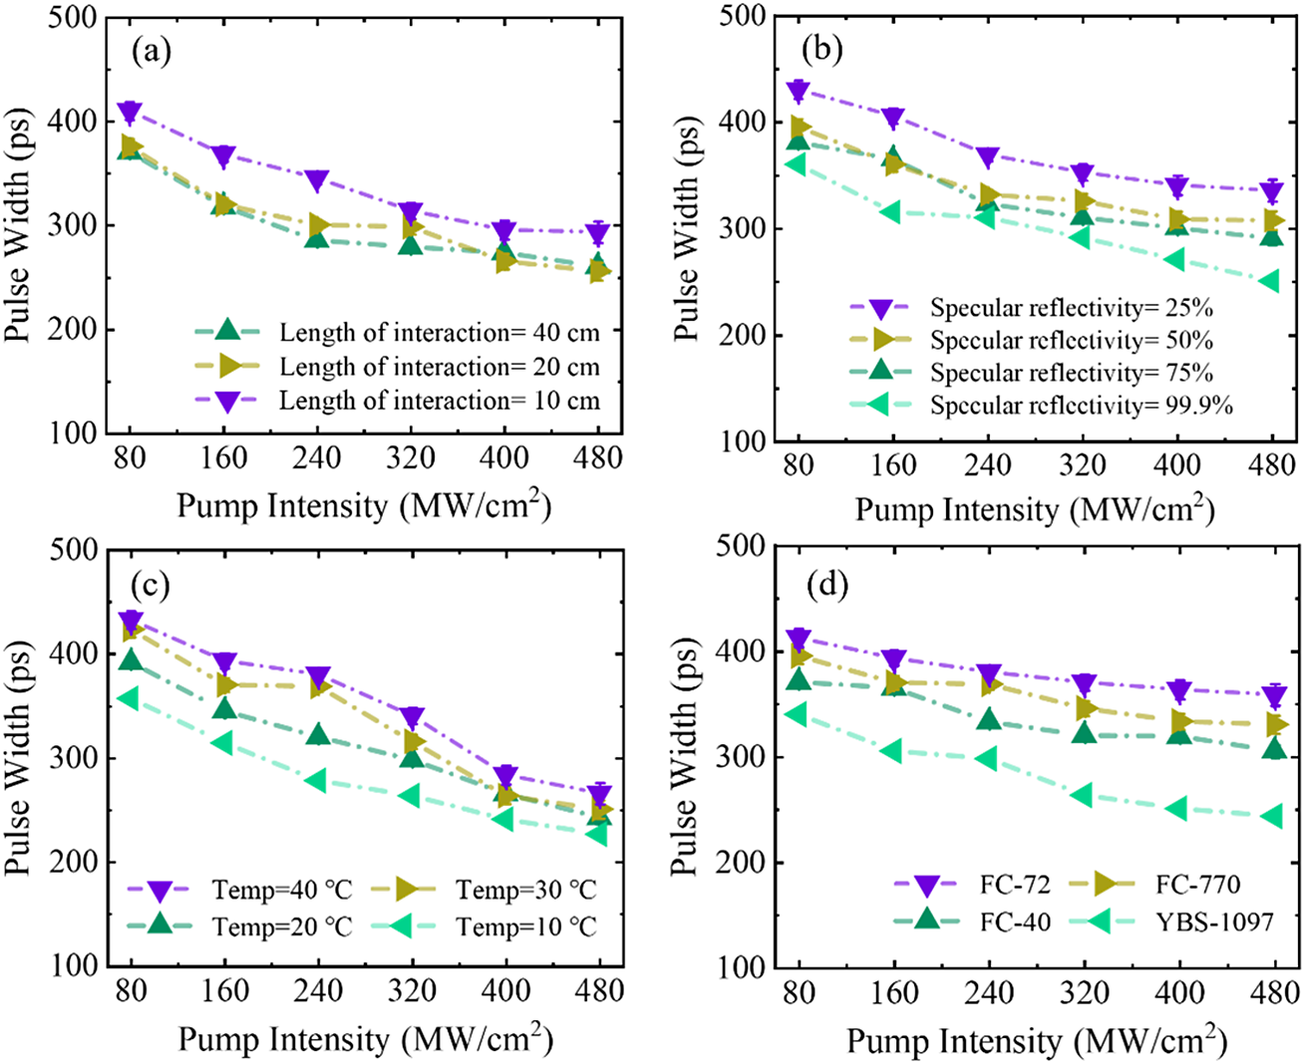
Figure 16 illustrates the variation of compression pulse width with different structural and medium parameters. As the interaction length and specular reflectivity increase, the compression pulse width decreases. When the interaction length exceeds 20 cm, the decrease in compression pulse width becomes insignificant. With an interaction length of 20 cm and a specular reflectivity of 99.9%, the minimum compression pulse width is approximately 248.6 ps, as shown in Figures 16(a) and 16(b). As the temperature decreases, the compression pulse width decreases accordingly, as shown in Figure 16(c). In YBS-1097, the compression pulse width decreases significantly, as shown in Figure 16(d). The results in Figures 15 and 16 show that transient SPBS can achieve effective pulse width compression, with a compression ratio of approximately 2, and has not reached saturation.
Variation of compression pulse width with structural and medium parameters: (a) interaction length; (b) specular reflectivity; (c) temperature; (d) medium.

Figure 16 Long description
The figure consists of four panels labeled a through d. All panels share a common x-axis representing Pump Intensity from 80 to 480 M W forward slash c m squared and a y-axis representing Pulse Width from 100 to 500 p s.
Panel a shows the effect of interaction length. Three curves for 10, 20, and 40 c m show a downward trend. The 10 c m length results in the highest pulse width, starting at approximately 410 p s and ending near 300 p s. The 20 and 40 c m curves are closely grouped, ending near 260 p s.
Panel b shows specular reflectivity at 25, 50, 75, and 99.9 percent. Pulse width decreases as reflectivity increases. The 25 percent reflectivity curve is the highest, while the 99.9 percent curve is the lowest, dropping from 360 p s to 250 p s.
Panel c shows temperature effects at 10, 20, 30, and 40 degrees Celsius. Higher temperatures correlate with higher pulse widths. The 40 degree curve starts at 430 p s and ends at 270 p s, while the 10 degree curve starts at 360 p s and ends at 230 p s.
Panel d compares four mediums: F C dash 72, F C dash 770, F C dash 40, and Y B S dash 1097. F C dash 72 maintains the highest pulse width across the intensity range, while Y B S dash 1097 shows the lowest pulse width and the steepest decline.
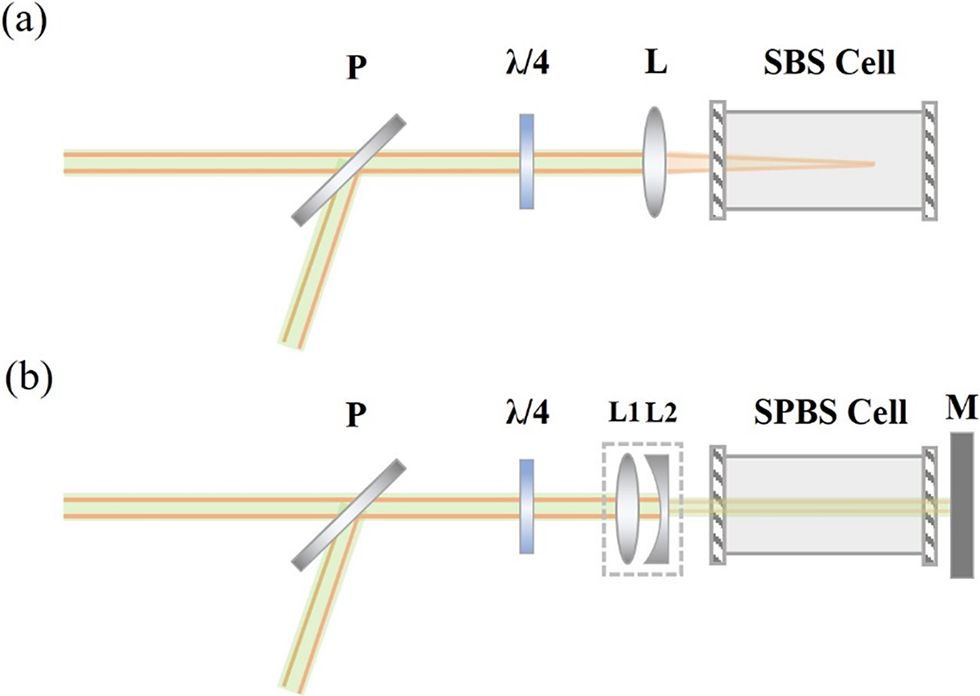
In order to emphasize the improving effect of transient SPBS on the degradation of energy characteristics caused by transient effects and thermally induced breakdown enhancement effects, we conduct a comparative study on the output characteristics of SBS and SPBS under the same experimental conditions; a schematic diagram of the compression system is shown in Figure 17. The SBS employs a focusing structure with a focal length of 200 mm for lens L and a size of focal spot of approximately 400 μm, as shown in Figure 17(a). The SPBS system employs a beam-shrinking structure with a magnification of 1.5, and adds a 0° high-reflectivity mirror M behind the medium cell to reflect the incident pump light, as shown in Figure 17(b). The waist of the pump beam is 3 mm, the length of the medium cell is 200 mm and the reflectivity of M is 99.5%. The repetition rate is 300 Hz, the pump energy is 5–25 mJ and the Brillouin medium selected is YBS-1097.
Schematic diagram of the compressed structure of SBS and SPBS: (a) SBS; (b) SPBS.

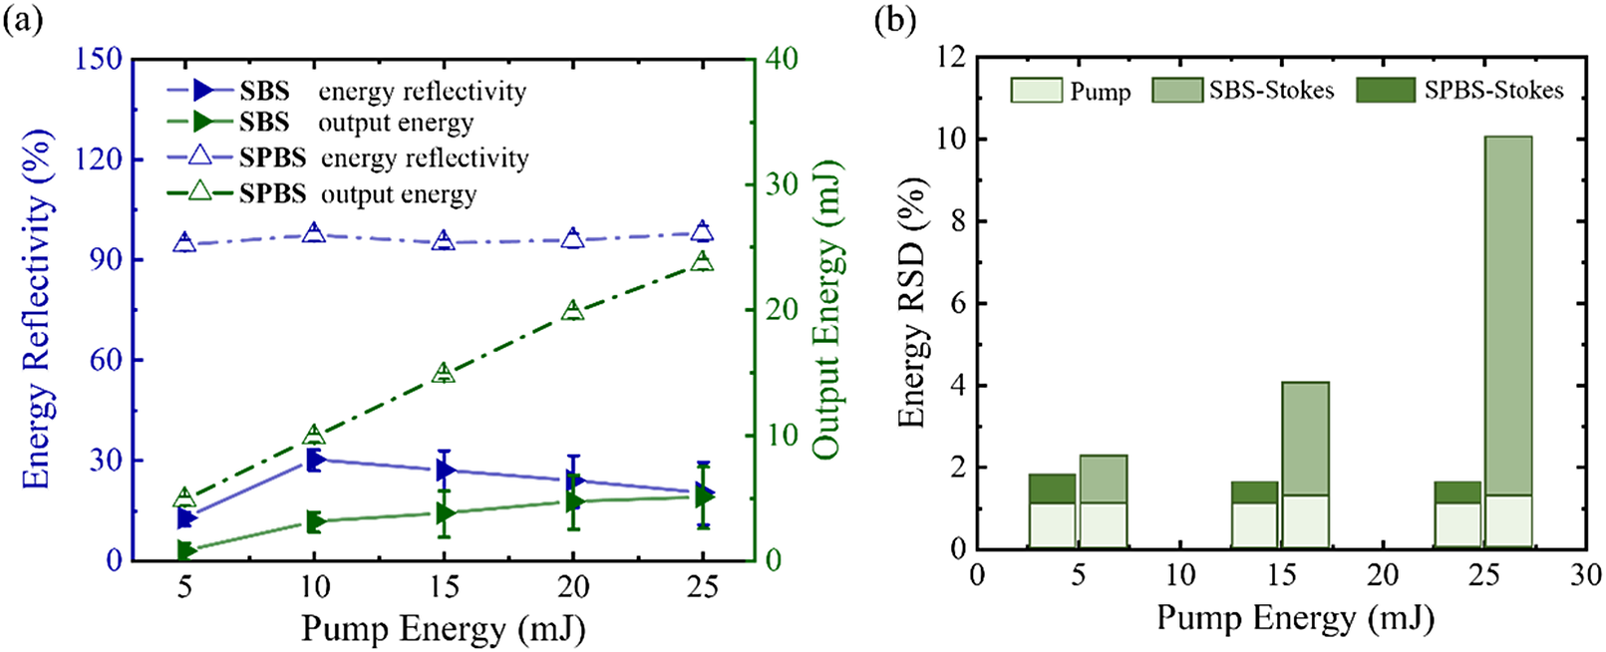
Figure 18 illustrates a comparison of the output energy (reflectivity) and stability of SBS and SPBS. Due to the special structural design of SPBS, it completely overcomes the effects of optical breakdown and transient effects, with energy reflectivity basically stable at 95% and a maximum output energy of 24.1 mJ. For SBS, due to the high system loss caused by transient effects and severe optical breakdown, the energy reflectivity is limited to below 35%, and the maximum output energy is only 6 mJ, as shown in Figure 18(a). Figure 18(b) shows a comparison of the energy stability of systems, including the energy RSD of the pump light itself. When the pump energy is 5 mJ, the degree of instability additionally introduced by the SBS and SPBS compression processes is basically the same. When the pump energy increases to 15 mJ, a slight breakdown effect appears in the SBS process, and the RSD increases. The pump intensity of SPBS is far from reaching the breakdown threshold, and due to the increase in pump energy, η increases, making the scattering process more stable. When the pump energy is 25 mJ, the breakdown effect in SBS is already very severe, and the energy RSD surges to 8.2%, while that in SPBS is only 1.42%. The results show that high-repetition-rate transient SPBS can achieve high output energy with minimal energy loss and introduces little additional instability relative to the pump light.
Comparison of output energy (reflectivity) and stability between SBS and SPBS: (a) output energy (reflectivity); (b) stability.

Figure 18 Long description
Panel a is a dual-axis line graph. The horizontal axis represents Pump Energy in m J from 5 to 25. The left vertical axis shows Energy Reflectivity in percent from 0 to 150. The right vertical axis shows Output Energy in m J from 0 to 40.
- S P B S energy reflectivity (open blue triangles) remains stable near 100 percent.
- S P B S output energy (open green triangles) shows a linear increase from 5 to 25 m J.
- S B S energy reflectivity (solid blue triangles) peaks at 10 m J and then gradually declines.
- S B S output energy (solid green triangles) shows a very slight increase but remains significantly lower than S P B S.
Panel b is a grouped bar chart showing Energy R S D in percent on the vertical axis against Pump Energy on the horizontal axis.
- At 5, 15, and 25 m J, three bars are shown: Pump, S B S-Stokes, and S P B S-Stokes.
- The Pump R S D remains constant and low near 1 percent.
- S P B S-Stokes R S D (dark green) remains consistently low, comparable to the pump.
- S B S-Stokes R S D (medium green) increases dramatically as pump energy rises, reaching approximately 10 percent at 25 m J pump energy.
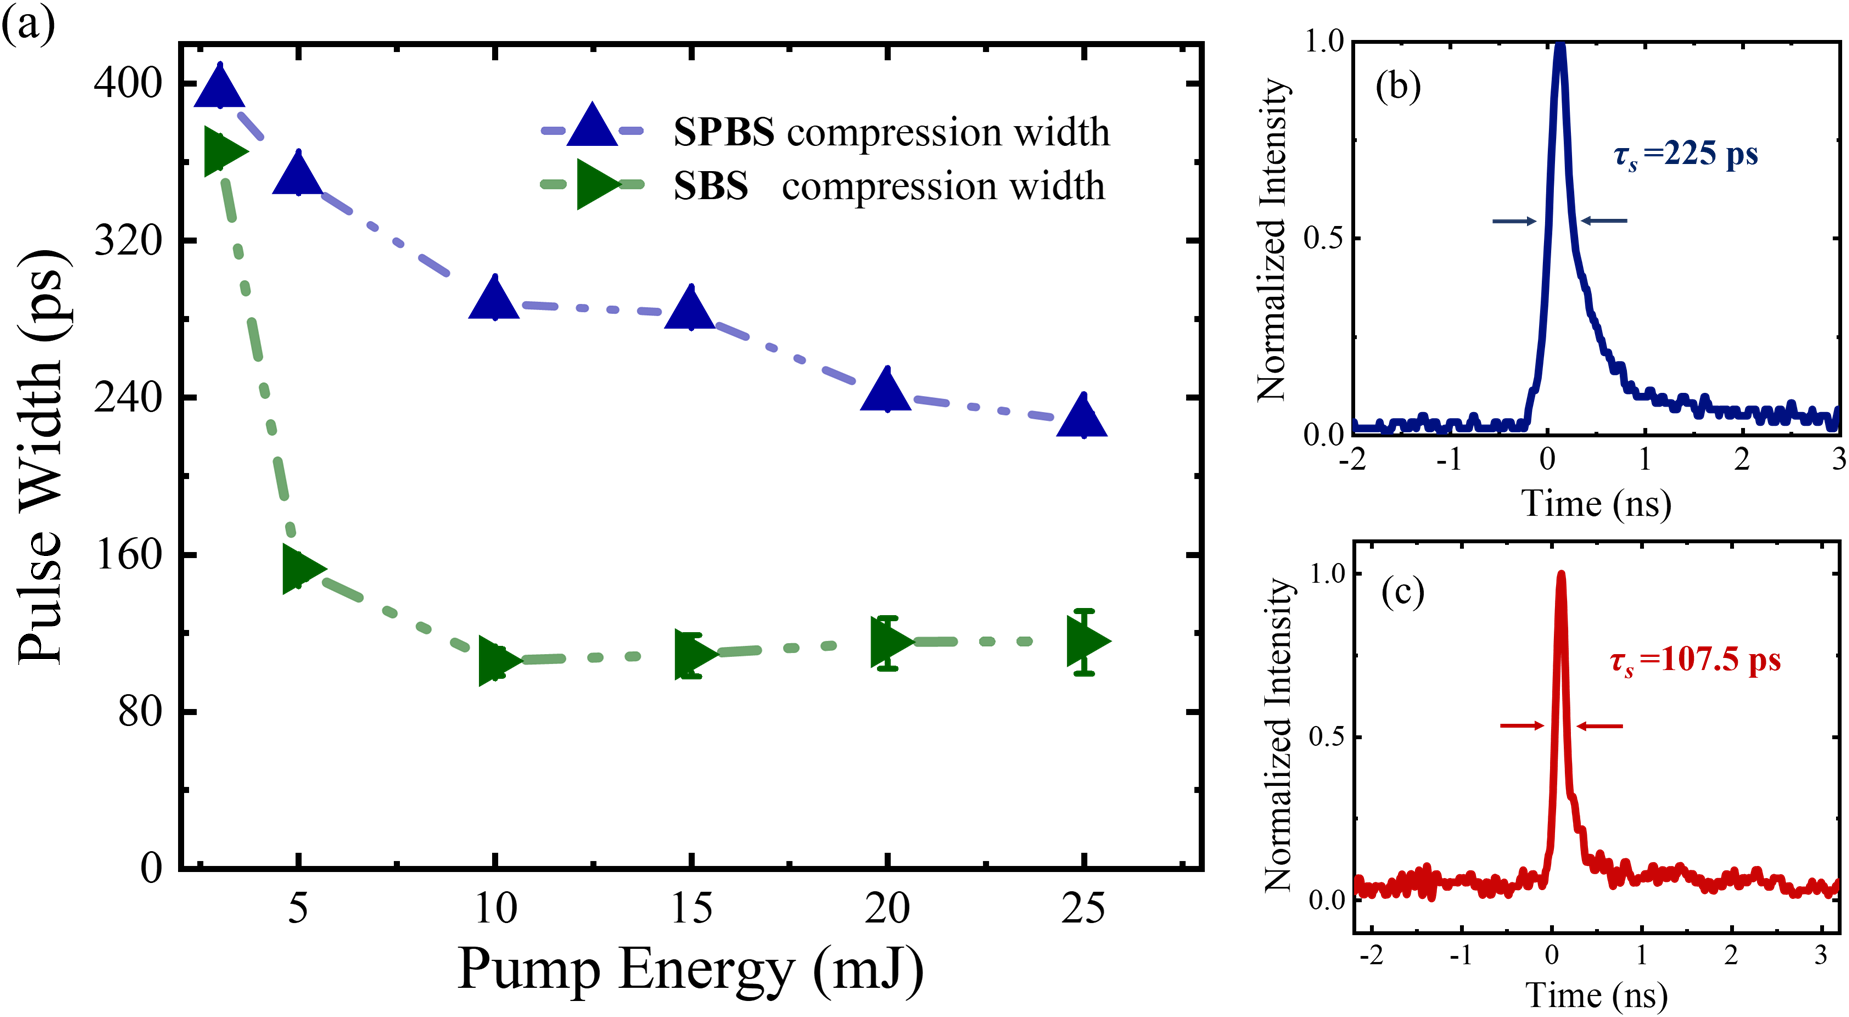
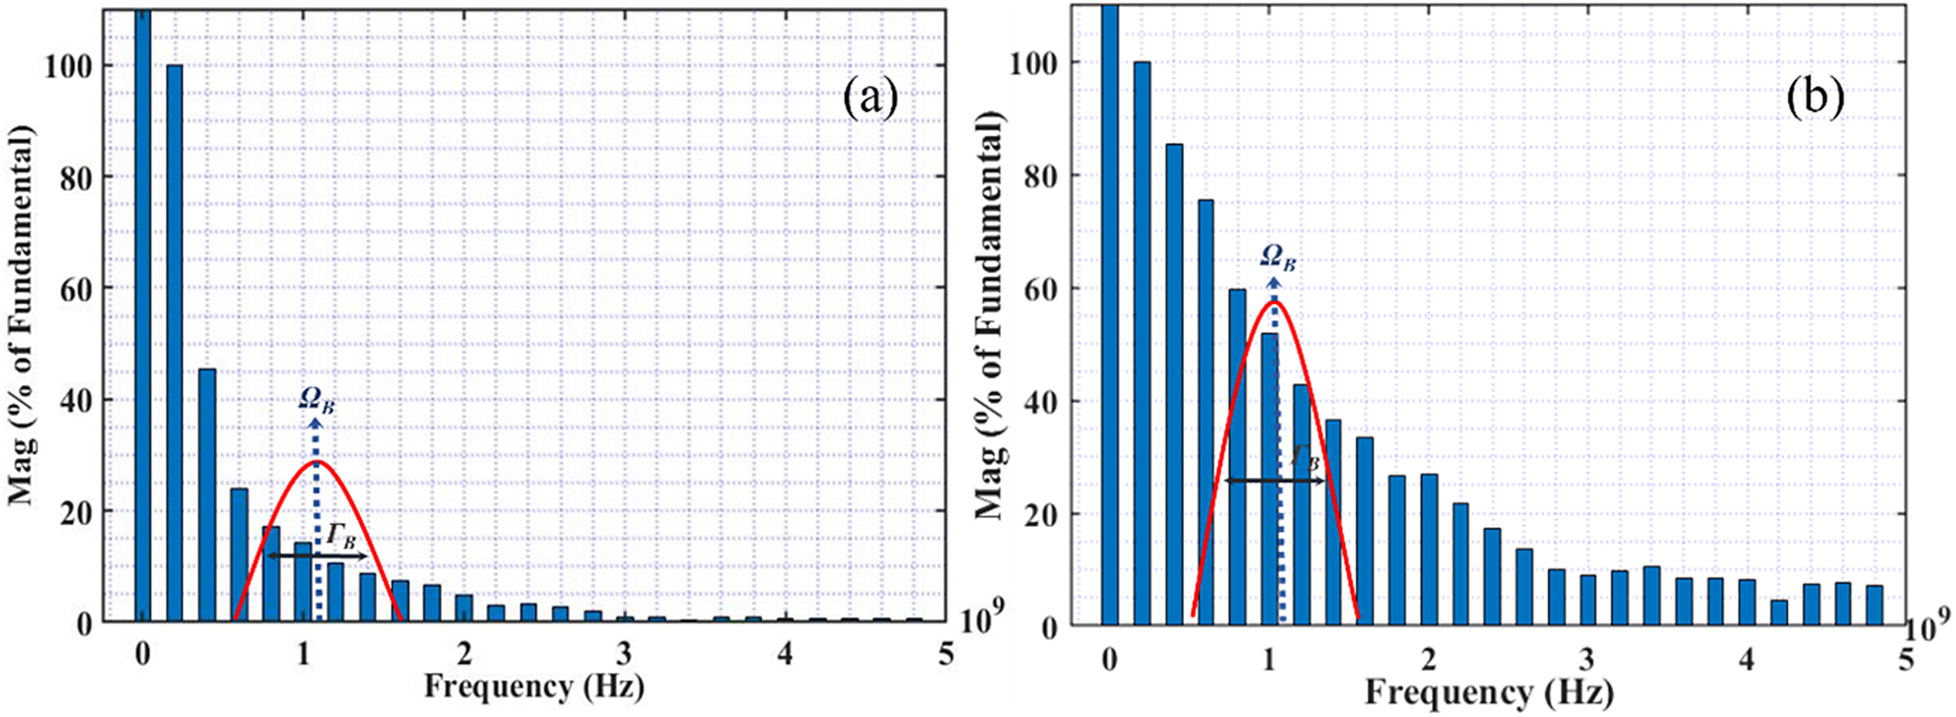
The saturation compression pulse width of SBS is about half that of SPBS, as shown in Figure 19. This is a direct result of the difference in their scattering intensities. The scattering intensity in the Rayleigh region of the SBS process is significantly higher than that of the SPBS process, resulting in a greater number of scattered photons per unit time, more significant contrast between the leading and trailing edges of the waveform and a narrower compressed pulse width. During the SPBS process, when the pump energy is increased to 25 mJ, the compression pulse width is approximately 225 ps, but compression saturation is not reached, as shown in Figure 19(b). Figure 20 illustrates the spectral distribution of the incident pump light and the reflected light; it can be observed that, within the Brillouin linewidth, the relative intensity of the modal components in the reflected light spectrum is significantly enhanced compared to that of the pump light. This phenomenon demonstrates that the Stokes component of reflected light has significant amplification. Theoretically, if the pump energy continues to increase, the normalized proportion of the initial Stokes component will gradually be occupied by the Stokes seed light originating from thermal noise and the output light from SPBS will coexist with the SBS-Stokes light. However, in actual structures, there is a fixed time delay between the two beams, which may cause waveform distortion. The results show that, due to limitations in scattering intensity, the compression capacity of SPBS is significantly lower than that of SBS.
Comparison of compressed pulse width and time-domain waveforms of SBS and SPBS: (a) compressed pulse width; (b) output time-domain waveform of SPBS; (c) output time-domain waveform of SBS.

Figure 19 Long description
Panel a is a line graph with the x-axis labeled Pump Energy in m J from 0 to 25 and the y-axis labeled Pulse Width in p s from 0 to 400. Two data series are shown. S P B S compression width, marked with blue triangles and a dash-dot line, starts at 400 p s at 2.5 m J and decreases to approximately 230 p s at 25 m J. S B S compression width, marked with green right-pointing triangles and a dashed line, drops sharply from 360 p s at 2.5 m J to approximately 110 p s at 10 m J, then plateaus.
Panel b is a waveform plot for S P B S with the x-axis labeled Time in n s from negative 2 to 3 and the y-axis labeled Normalized intensity from 0.0 to 1.0. A blue peak is centered near 0 n s with a measured width tau sub s equals 225 p s indicated by horizontal arrows.
Panel c is a waveform plot for S B S with identical axes to panel b. A red peak is centered near 0 n s with a narrower measured width tau sub s equals 107.5 p s indicated by horizontal arrows.
Spectra of pump light and reflected light: (a) pump light; (b) reflected light.

Figure 20 Long description
Two side-by-side bar charts labeled a and b. Both charts share identical axes. The horizontal x-axis represents Frequency in H z from 0 to 5, with a multiplier of 10 super 9 at the far right. The vertical y-axis represents Mag as a percentage of Fundamental from 0 to 100.
Panel a shows the pump light spectrum. The bars are highest at the far left, with the first bar exceeding 100 percent and subsequent bars decreasing rapidly in a decaying curve toward zero. Between frequency 0.5 and 1.5, a red bell-shaped curve is superimposed over the bars. A vertical blue dotted arrow points to the peak of this curve, labeled with the Greek letter Omega sub B. A horizontal double-headed black arrow indicates the width of the curve, labeled with the Greek letter Gamma sub B.
Panel b shows the reflected light spectrum. The decay of the bars from left to right is much slower compared to panel a, maintaining higher magnitudes across the frequency range. The same red bell-shaped curve is present between frequency 0.5 and 1.5, but it is taller and wider than in panel a. The peak is again marked by a vertical blue dotted arrow labeled Omega sub B, and the width is marked by a horizontal double-headed black arrow labeled Gamma sub B.
5 Conclusion
In summary, this study proposes a high-repetition-rate transient SPBS pulse compression technique, aiming to solve the problem of decreased energy reflectivity and stability caused by the combined transient effect and optical breakdown effect in the traditional SBS process. Through simulation and experimental studies, the physical mechanism of using self-feedback seed light to compensate for scattering gain is revealed. The important conclusion that transient SPBS can achieve effective compression under low laser flux is verified. The results show that when a high-reflectivity mirror is used as the feedback source, the system loss comes only from the absorption of the medium and the reflection of the window film. The thermal absorption enhancement effect introduced by the repetition rate increase will cause the loss to increase and the stability to decrease. Due to the extremely low pump intensity, no breakdown effect occurs in the SPBS process even with heat accumulation. Ultimately, a maximum output energy of 24.1 mJ@300 Hz is achieved with an average energy reflectivity of 95%, nearly doubling the peak laser power with extremely low energy loss, and realizing stable output of a high-repetition-rate short-pulse laser with an energy RSD of only 1.42%.
Acknowledgements
This work was supported by the National Key R&D Program of China (Grant No. 2024YFB3613600) and the Natural Science Foundation of Hebei Province (Grant Nos. F2023202082 and F2022202035).


 Open access

