


Introduction
Thaw lakes comprise >20% of the total area of the North Slope of Alaska, and up to about 40% in the coastal plain areas (Reference Sellmann, Brown, Lewellen, McKim and MerrySellmann and others, 1975a, b). Parts or all of many lakes freeze completely to the bottom each winter because the water depth is less than the maximum ice thickness (Reference Sellmann, Brown, Lewellen, McKim and MerrySellmann and others, 1975a, b; Reference Weeks, Fountain, Bryan and ElachiWeeks and others, 1978; Reference MellorMellor, 1982) An investigation of lake-ice growth during winter 1991/92 on the North Slope using spaceborne synthetic-aperture radar (SAR) data revealed that (1) almost 80% of the lakes near Barrow, on the coast, had frozen completely to the bottom by the end of winter, and 60% of the lakes froze completely during January alone, and (2) inland about 100 km south of Barrow, only 25% of the lakes had frozen completely to the bottom by the end of winter Reference Jeffries, Morris and ListenJeffries and others, 1996).
The growth and decay of the lake ice, and the water depth affect: (1) the ground thermal regime and whether a talik (thaw bulb) forms below a lake (Reference Sellmann, Brown, Lewellen, McKim and MerrySellmann and others, 1975a); (2) heat fluxes from the lakes and the regional energy balance (Reference Jeffries, Zhang, Frey and KozlenkoJeffries and others, 1999); (3) methane and CO2 efflux (Reference Phelps, Peterson and JeffriesPhelps and others, 1998); and (4) water storage and availability (Reference MellorMellor, 1982; Reference Jeffries, Morris and ListenJeffries and others, 1996). Global circulation model (GCM) simulations of climate change due to increased atmospheric greenhouse-gas concentrations predict that any warming will occur earlier, and be greater, in the Arctic than elsewhere (Reference Houghton, Jenkins and EphraumsHoughton and others, 1990, Reference Houghton, Meira Filho, Callander, Harris, Kattenberg and Maskell1996). The area and depth of existing lakes could be altered, new lakes might form, and the thickness of the ice cover might change. Such changes would have a significant impact on the land surface hydrology and the role of the lakes in physical and biological interactions and processes.
Understanding lake-ice growth and its sensitivity to climate change is vital to understanding the thaw-lake systems and predicting their response to climate change. Unfortunately, long-term, accurate records of lake-ice growth and decay do not exist for Alaska. Reference RyderRyder (1954) reported on early lake-ice studies in Alaska, and Reference BilelloBilello (1980) summarized lake-ice thickness measurements made by the U. S. Army Gold Regions Research and Engineering Laboratory at 23 locations throughout Alaska from 1961 to 1974. Adams (1981) summarized snow and lake-ice studies in northern Canada. In the absence of continuous long-term monitoring records, one alternative is the numerical simulation of lake-ice growth and its sensitivity to climatic change.
Based on the physics of lake-ice growth, the first and still the most comprehensive exact solution to model heat conduction with phase change is by Neumann (ca. 1860). The Neumann problem is generalized by Reference Carslaw and JaegerCarslaw and Jaeger (1959) and expanded in a number of variations dealing with heat conduction with freezing and thawing in cold regions (Reference LunardiniLunardini, 1988). A number of numerical energy-balance models have been developed to investigate lake-ice growth (e.g. Reference Liston and HallListon and Hall, 1995). These potentially provide the best means to couple a lake system to the atmosphere, but they are less well suited to investigations of the long-term variability of lake-ice growth and thickness, due to the lack of suitable data and forcing fields. These models are not coupled to the ground thermal regime (talik formation and permafrost dynamics). An alternative is to model lake-ice growth using available long-term data to drive the model dealing with heat conduction with phase change. In this paper, we present a finite-element heat-transfer model with phase change using the long-term air temperature and snow depth as model inputs to investigate interdecadal variations in lake-ice growth and thickness, and their sensitivity to climate change in northernmost Alaska. The original model is developed as a two-dimensional heat-transfer model with phase change in a lake-permafrost system. In this study, we use the two-dimensional model for a one-dimensional heat-transfer study.
Model Description
A physically based, non-steady heat-transfer model with phase change using a finite-element method is developed to investigate the heat and mass transfer between the atmosphere and permafrost, through the intervening seasonal snow cover, lake ice and lake water. This finite-element numerical model is based upon the original (Reference Guymon and HromadkaGuymon and Hromadka, 1977; Reference Guymon, Hromadka and BergGuymon and others, 1984) which was later modified by Reference Gosink and OsterkampGosink and Osterkamp (1990). Assuming there is no lateral heat flow, the heat-condition equation in the lake-permafrost system can be written as:
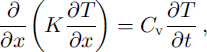
where t is the time in seconds, × is the position coordinate measured from the snow surface when snow is present and from the lake-water surface when snow is absent, in meters, T is temperature in °C, K is the thermal conductivity in W nT1 K–1, and Cv is the volumetric heat capacity in J m–3. The density of lake ice is assumed to be 916 kg m–3. It is assumed that the densities of ice and water are the same in permafrost (Reference Osterkamp and GosinkOsterkamp and Gosink, 1991).
It is assumed that there is no convective heat flow in the system. It is generally true that heat transfer in lake ice is dominated by conduction. Thaw lakes in northern Alaska are generally shallow, mostly 1–3 m deep (Reference Sellmann, Brown, Lewellen, McKim and MerrySellmann and others, 1975a, b; Reference MellorMellor, 1982; Reference Jeffries, Morris and ListenJeffries and others, 1996). Water under the lake ice in winter or lake water in summer is usually well mixed and close to isothermal. Therefore, convective heat transfer is relatively small or negligible.
This model is coupled with two moving boundaries: (i) air-snow interface as snow thickness changes; and (ii) the phase boundary between lake ice and lake water as lake ice grows and melts. The upper boundary is set at the air-snow interface when snow is present and at the air-water surface when snow is absent. The temperature boundary condition is

where Ts is the surface temperature in °C. At the phase boundaries (the ice-water interface), the temperature must be equal to the equilibrium temperature, Te (0°C for this study), and the energy flux must be conserved. These conditions require that:

and

where Lv is the volumetric latent heat of fusion, subscript " 1 " indicates the variable and parameters for ice, and subscript ˚2" those for water. Lake water is 3.0 m deep. The lower boundary is set at 15 m below the lake-water surface, and the lower boundary condition is prescribed at 0°C.
The seasonal snow cover is treated as an additional layer when it is present. The effective thermal properties of snow are estimated using a serial heat-conduction model (Reference Zhang, Osterkamp and StamnesZhang and others, 1996), which includes wind slab and depth-hoar layers as reported by Reference Benson and SturmBenson and Sturm (1993). The density of snow over lake ice is obtained from Reference Jeffries, Zhang, Frey and KozlenkoJeffries and others (1999).
The model includes up to six different types of materials, individually or in combination, such as snow, ice, water, peat, silt, sand and gravel. The material type can be varied from layer to layer with distinct physical and thermal properties. The values of the thermal properties of the materials (snow, ice or water) were determined during the calculations, depending on the position of the phase boundaries. Latent heat is included as a latent-heat content ˚spike" at the given freezing temperature (Reference O’NeillO’Neill, 1983).
Lake-ice melting is a more complicated process than lake-ice growth. During the decay period of lake ice, both the top and the bottom of the floating lake-ice cover are at 0°C. Lake ice usually is isothermal at 0°C within a few days after the onset of melting at the top, but the complete melting of lake ice takes a few weeks or more than a month in the Arctic and sub-Arctic (Reference BilelloBilello, 1980). In this case, heat conduction is not applicable. Reference BilelloBilello (1980) presented extensive data from a variety of locations in the Arctic and sub-Arctic and examined several empirical approaches to predict the decay rate of lake ice. The accumulated thawing degree-day (ATDD) index gave the best overall correlations, especially when the lake-ice cover was not subjected to water currents or other action that would mechanically break up the ice cover, which is the case near Barrow in this study. The relationship can be expressed as:

where Z is the daily ice thickness and Zmax is the maximum lake-ice thickness by the end of winter in cm, and b is the slope or melting factor in cm ˚C–1d–1. Reference AshtonAshton (1983) later applied a simple heat-balance approach, but it is virtually the same as the Bilello thawing degree-day method.
In this study, the ATDD method was used to calculate changes in ice thickness during the decay period. The ice-thinning rate or melting factor, b, was determined using the modeled maximum ice thickness, the date of melting onset and the date when lakes were completely free of ice, and daily mean air temperature from the U. S. National Weather Service (NWS) station at Barrow. The dates of melt onset and when lakes were completely free of ice were determined using SAR remote-sensing data (Jeffries, unpublished data). Snowmelt onset on lake ice and sea ice is manifested in SAR images as a change from light to dark tone, from strong scattering to little or no scattering, as the radar signal is absorbed in the wet snow (Reference Jeffries, Morris, Weeks and WakabayashiJeffries and others, 1994; Reference Winebrenner, Nelson, Colony and WestWinebrenner and others, 1994). The SAR signatures of wind-roughened and calm open water are quite different from each other, i.e. bright and dark, respectively, and each differs sufficiently from the signature of melting ice that it is a straightforward matter to identify a partially ice-covered lake in spring and an ice-free lake in summer (Jeffries and others, in press). The melting factors are summarized in Table 1.
Lake-ice melting rate near Barrow. Maximum ice thickness in parentheses includes snow thickness with adjustment of ice density
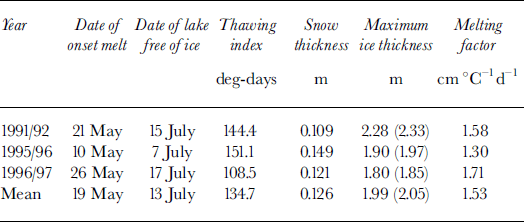
The mean melting factor of 1.53 cm ˚ C–1 d–1 as shown in Table 1, is slightly higher than the value of 1.29 cm ˚ C–1 d–1 obtained by Reference BilelloBilello (1980) over lakes near Barter Island, and significantly higher than melting-factor values in northern Canada (Reference BilelloBilello, 1980).
Daily mean air temperature and snow thickness were obtained from the Barrow NWS station. The air-temperature freezing index is defined as a summation of degree days below 0°C for a given time period (Canada, National Research Council, 1988). The annual freezing index is calculated using daily mean air temperatures from 1 July through 30 June of the next year. We realized that snow depth can vary significantly within a short distance (Reference BensonBenson, 1980, Reference Benson1982; Reference Sturm and HolmgrenSturm and Holmgren, 1994). However, the time series of snow-depth data at the Barrow NWS station is the only long-term dataset available. Snow-cover index (SCI) is defined as an integration of snow thickness over time:

where t, and t2 are the first and last day of snow on ground, respectively, Hs is snow thickness in cm at time t, and h and t2 are determined when Hs ≥ 2.54 cm. SCI provides a combined measure of the duration and thickness of the seasonal snow cover. The in situ ice-thickness data were obtained from Reference BilelloBilello (1980), Reference Jeffries, Morris, Weeks and WakabayashiJeffries and others (1994, Reference Jeffries, Zhang, Frey and Kozlenko1999) and Reference Phelps, Peterson and JeffriesPhelps and others (1998).
In the current model, all ice growth occurs by congelation at the base of the ice cover. However, lake ice also thickens by the formation of snow ice, particularly in sub-Arctic locations. Congelation ice and snow ice are also commonly referred to as black ice and white ice, respectively, in the literature (e.g. Reference Adams, Gray and MaleAdams, 1981). Snow ice forms after the snow/ice interface has been flooded, typically by water upwelling through cracks when the snow load is sufficient to depress the snow/ice interface below lake level. We have observed snow ice in the ice cover on lakes in the Barrow area, but its occurrence tends to be patchy and the layers thin, and most of the ice cover is composed of congelation ice (Reference Jeffries, Morris, Weeks and WakabayashiJeffries and others, 1994). Since snow ice makes up only a small proportion of the total area and mass of lake ice, we consider the simulations to be realistic as they represent the predominant (area and thickness) ice type, i.e. congelation ice.
Results
Model validation
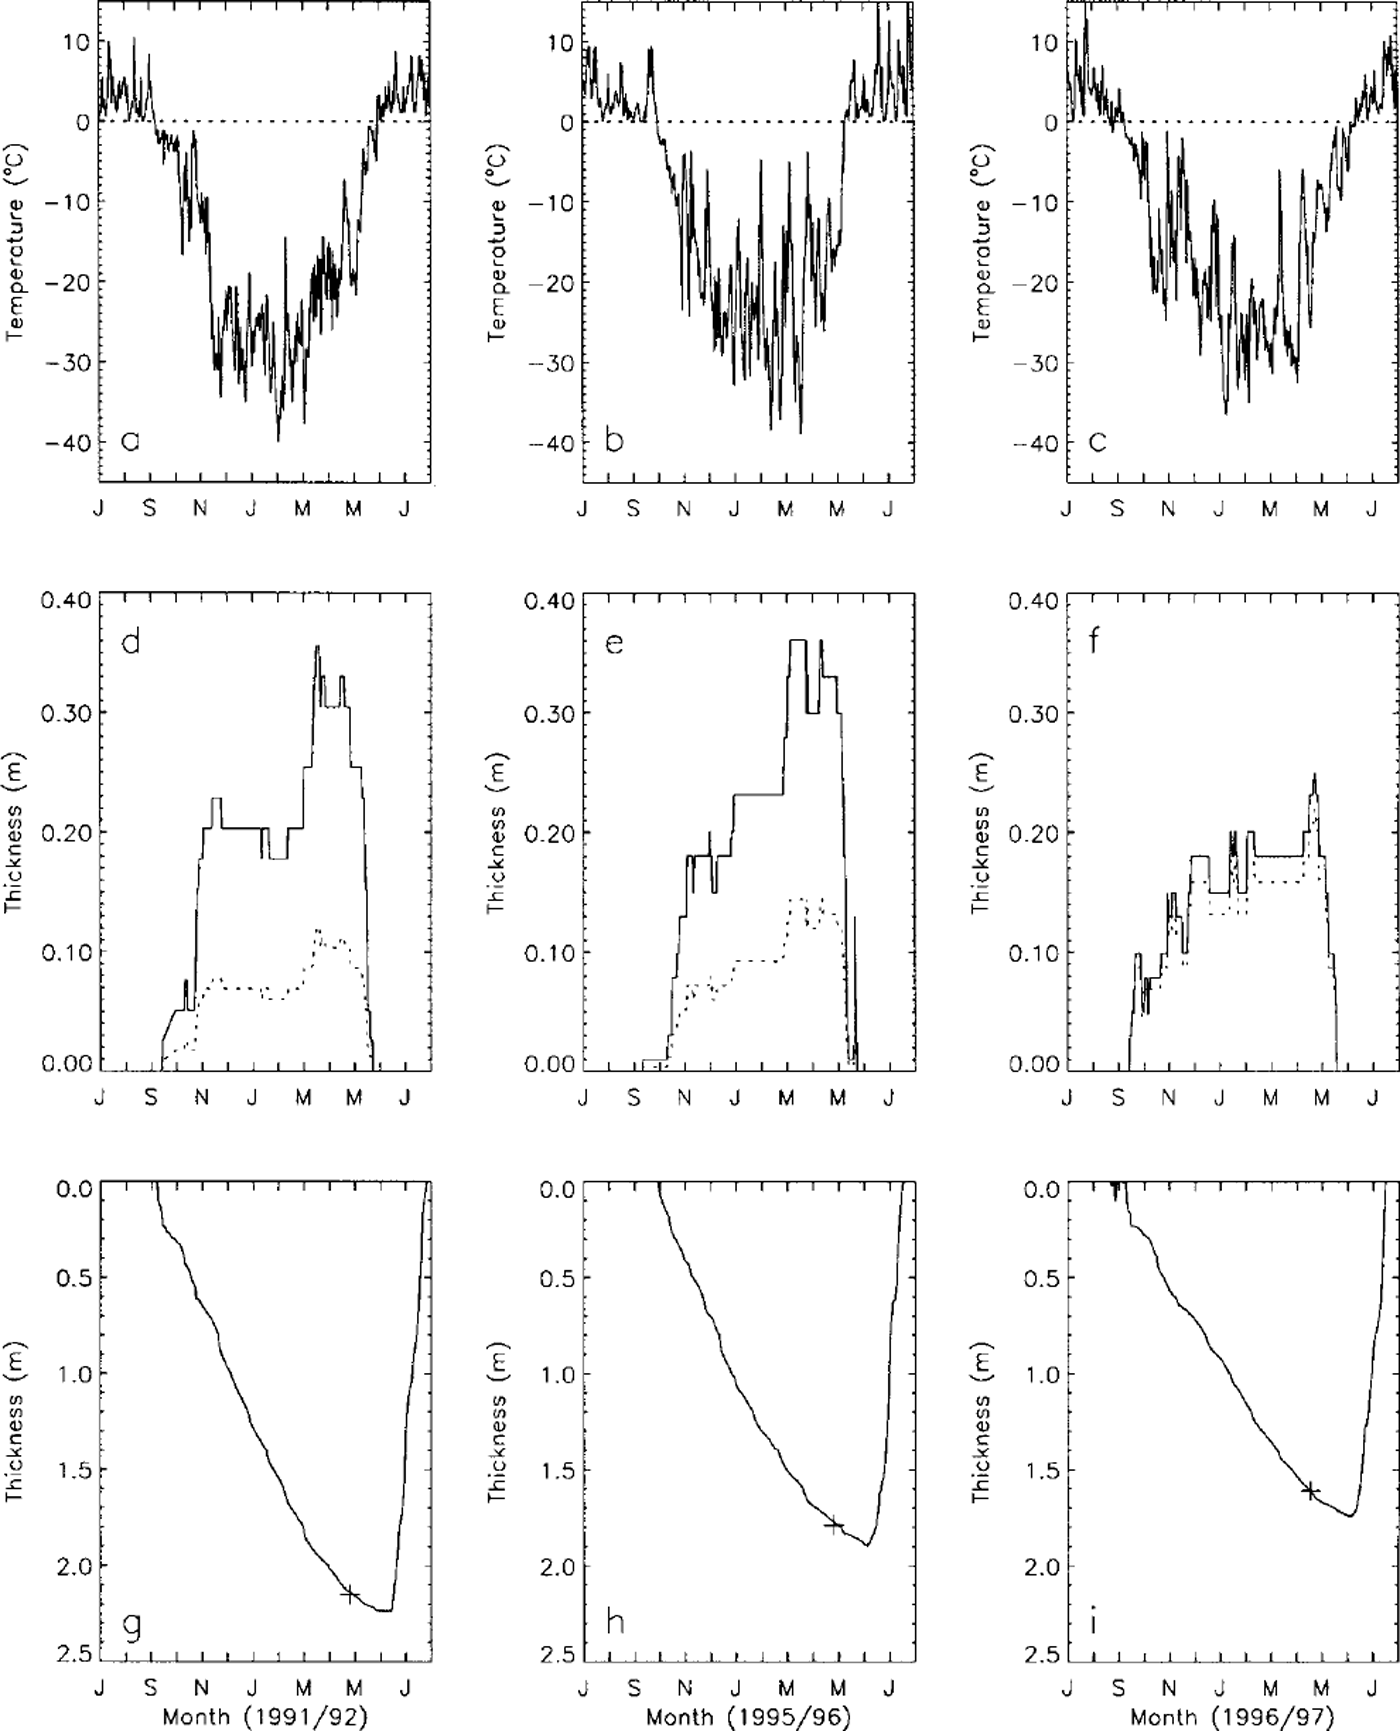
The model was run with inputs of mean daily air temperature and snow depth measured at the Barrow NWS station, located 5–10 km from the lakes for which we have in situ measurements of snow depth and ice thickness (Reference BilelloBilello, 1980; Reference Jeffries, Morris, Weeks and WakabayashiJeffries and others, 1994, Reference Jeffries, Zhang, Frey and Kozlenko1999; Reference Phelps, Peterson and JeffriesPhelps and others, 1998). Figure 1 shows the input daily mean air temperature and snow depth, and ice-growth curves during the winters of 1991/92, 1995/96 and 1996/97, respectively. The model results for these three winters are summarized inTable 2.
Vanations of mean daily air temperature (a-c) and snow depth (d-f) measured at the Barrow NWS station, and simulated lake-ice growth and decay (g-i)for the winters of 1991/92,1995/96 and 1996/97. The dashed lines in (a-c) are the 0°C reference. The dashed lines in (d-f) represent the adjusted snow depth used as input for modeling with Sfac = 0.52 (see Table 2). The crosses in (g-i) are the in situ measured lake-ice thickness.
Comparison between the in situ measured and modeled lake-ice thicknesses at Barrow
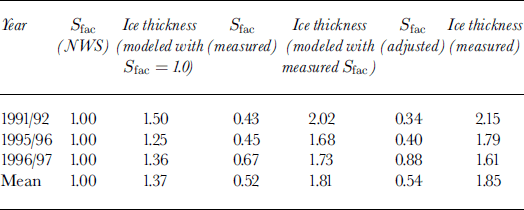
Using the measured daily mean air temperature and mean snow depth at the NWS station as model inputs, the model underestimates lake-ice thickness by up to 30% compared with the in situ measured lake-ice thickness (Table 2). It is generally true that air temperature is well correlated at a local scale (Reference ZhangZhang, 1993), while snow depth can vary substantially within a short distance (Reference Sturm and HolmgrenSturm and Holmgren, 1994) on the North Slope of Alaska. Field measurements indicate that the snow is thinner and more dense on lake ice than on tundra (Reference BilelloBilello, 1980; Reference Jeffries, Zhang, Frey and KozlenkoJeffries and others, 1999). The ratio, Sfac, between the average snow depth measured over lake ice and snow depth measured at the Barrow NWS station ranges from 0.43 to 0.67, with an average of 0.52. By multiplying the measured snow depth at the Barrow NWS station by this ratio to derive an adjusted snow input, the model produces lake-ice thicknesses which are very close to the in situ measured values, with errors less than ± 7% (Table 2). By further adjusting Sfac, the modeled lake-ice thickness can match the field measured values as shown in Figure 1. These results indicate that the model can be used with confidence to predict lake-ice growth if proper field data, especially snow data, can be obtained. In the following sections, Sfac6 = 0.52, the average measured value given inTable 2, will be used to simulate lake-ice growth and its sensitivity to climatic parameters.
Interdecadal variations of lake-ice thickness
The model was run with inputs of mean daily air temperature and daily snow depth measured from the Barrow NWS station from 1 July 1947 through 30 June 1997 to investigate the interannual and interdecadal variations of lake-ice thickness. Figure 2 illustrates the interannual variations of the freezing index, SCI and simulated maximum lake-ice thickness over the study period. The long-term mean simulated maximum lake-ice thickness is 1.91 ±0.21 m.
Interannual variations of the freezing index of air temperature (a), SCI (b) and simulated maximum lake-ice thickness ( c), 1948–97, at Barrow. The thin solid lines represent the individual annual values of each variable. The thick solid lines are the smoothed curves using a low-pass filter with cutoff frequency of 0.091aȡ1 . The dashed lines represent the long-term average value of each parameter.
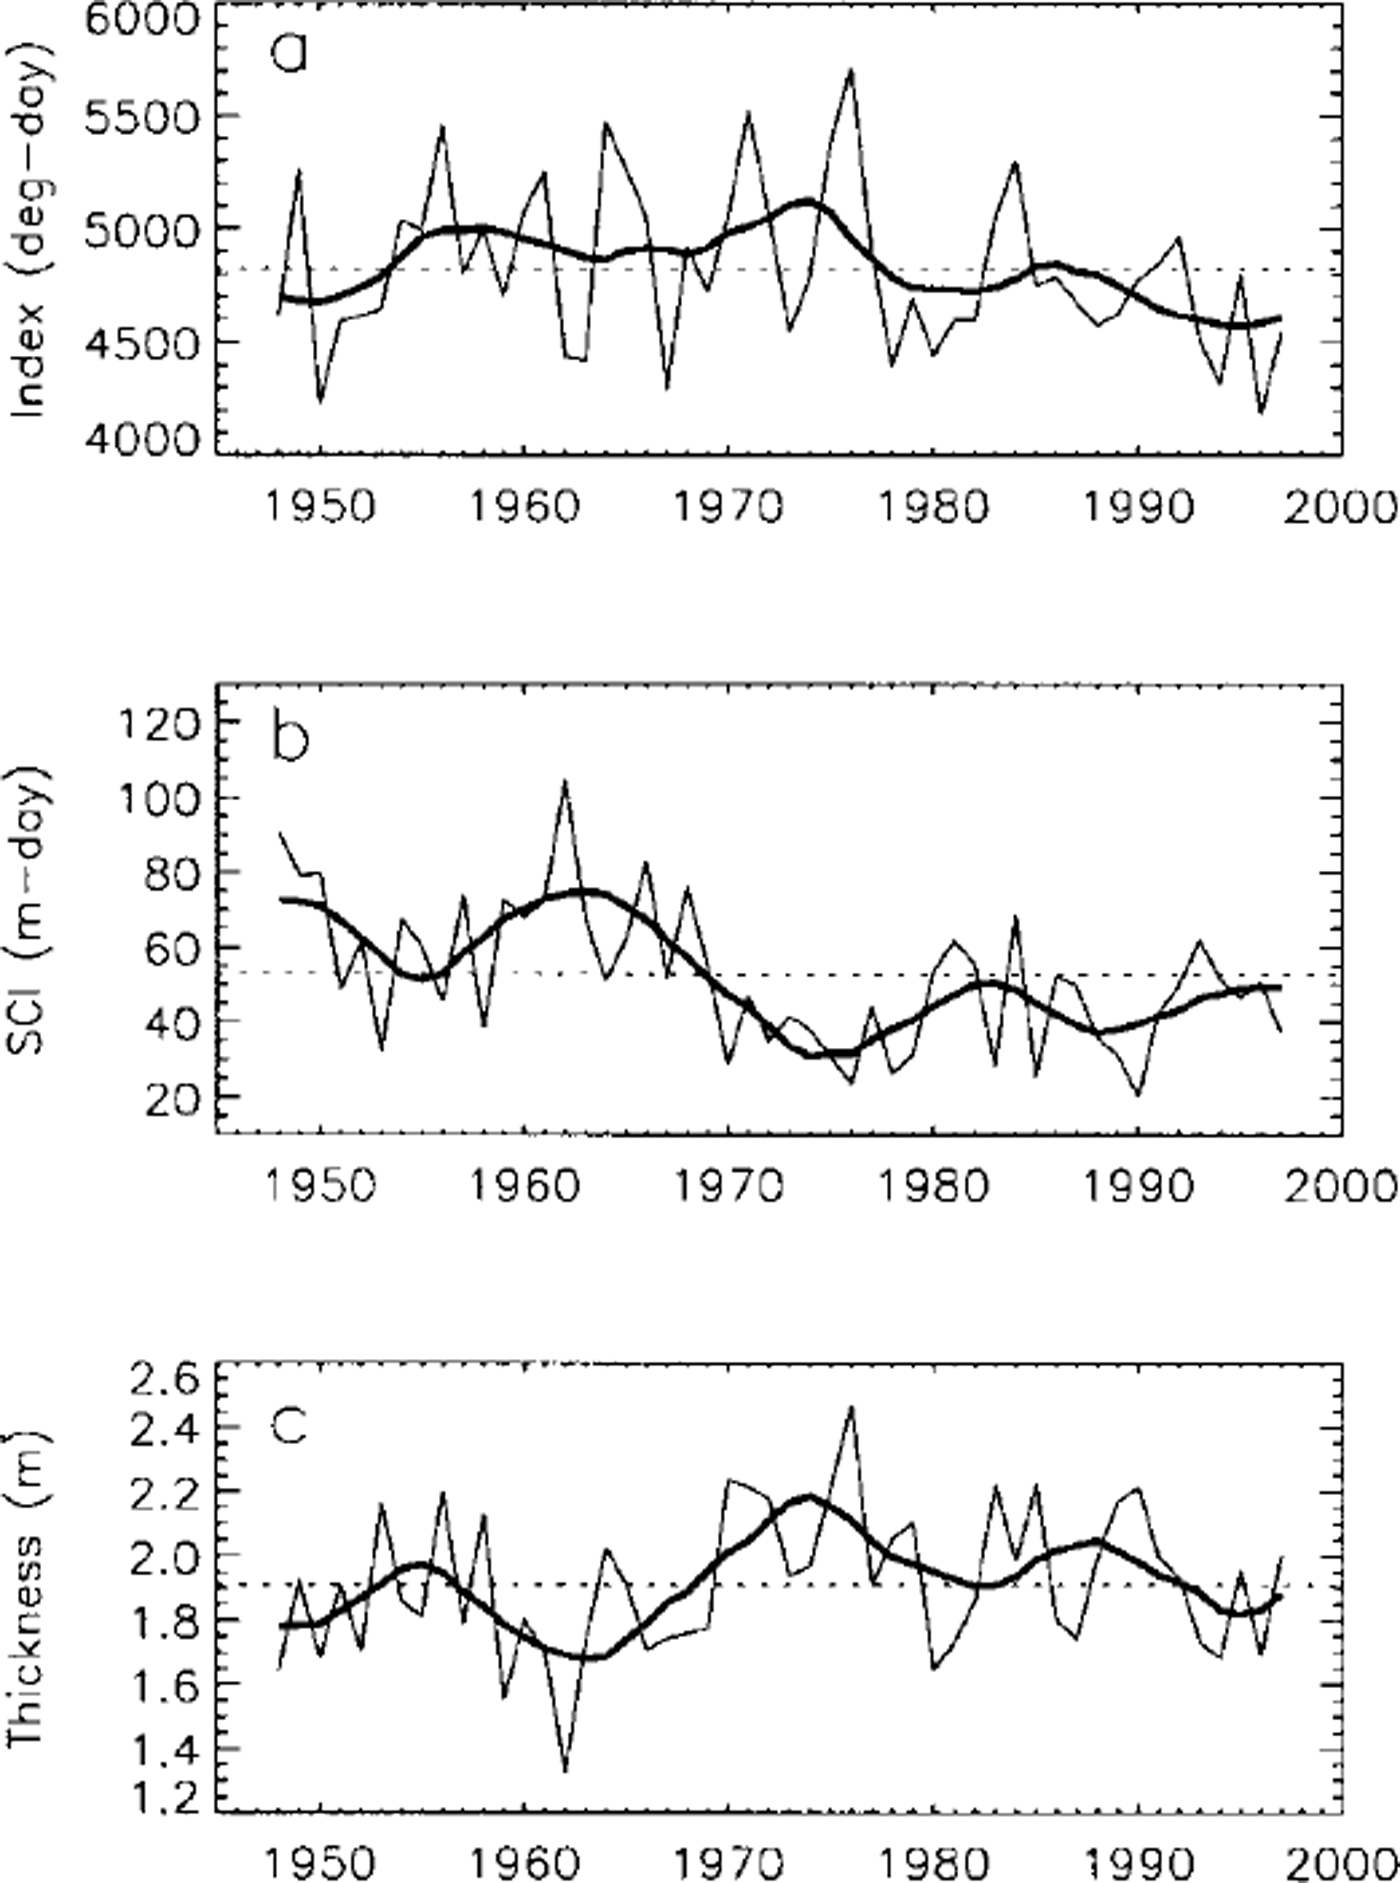
The simulated results indicate that changes in lake-ice thickness are better correlated with changes in SCI than changes in the freezing index. The long-term mean freezing index is 4824 degree-days with standard deviation of ±358 degree-days, or ± 7% from its long-term mean. The long-term mean SCI is about 5268 cm-days with standard deviation of ±2047 cm-days, or ±39% from its long-term mean. Even though the long-term mean values of the freezing index and SCI are of the same magnitude, the interannual variation of SCI is almost six times greater than that of the freezing index. There is a clear anticorrelation between SCI (Fig. 2b) and maximum lake-ice thickness (Fig. 2c), i.e. during years with greater SCI, maximum lake-ice thickness was smaller, and vice versa. Changes in the freezing index have a minor effect on lake-ice thickness (Fig. 2a). A linear least-squares analysis between lake-ice thickness and SCI gives a correlation coefficient of 0.82 with standard deviation of ± 13 cm, while the correlation coefficient between lake-ice thickness and the freezing index is 0.53, with standard deviation of ±20 cm. These results lead to the conclusion that change in SCI is the most significant single factor controlling lake-ice growth and lake-ice thickness on the North Slope of Alaska.
Figure 1 shows three cases of the combined effect of air temperature and snow cover on lake-ice growth in northern Alaska. The freezing index was highest (4960 degree-days) during winter 1991/92 and lowest (4121 degree-days) during winter 1995/96, while SCI was lowest (1682 cm-days, area under the dashed line in Fig. 1d) during winter 1991/92 and highest (3282 cm-days, area under the dashed line in Fig. If) during winter 1995/96. As a result, the coldest winter with lowest SCI (1991/92) produced the thickest lake ice of 2.23 m (Fig. lg). The thinnest lake ice (about 1.75 m) was produced during winter 1996/97 when SCI was highest. Lake-ice thickness was about 1.90 m during winter 1995/96, even though it was the warmest winter of the three.
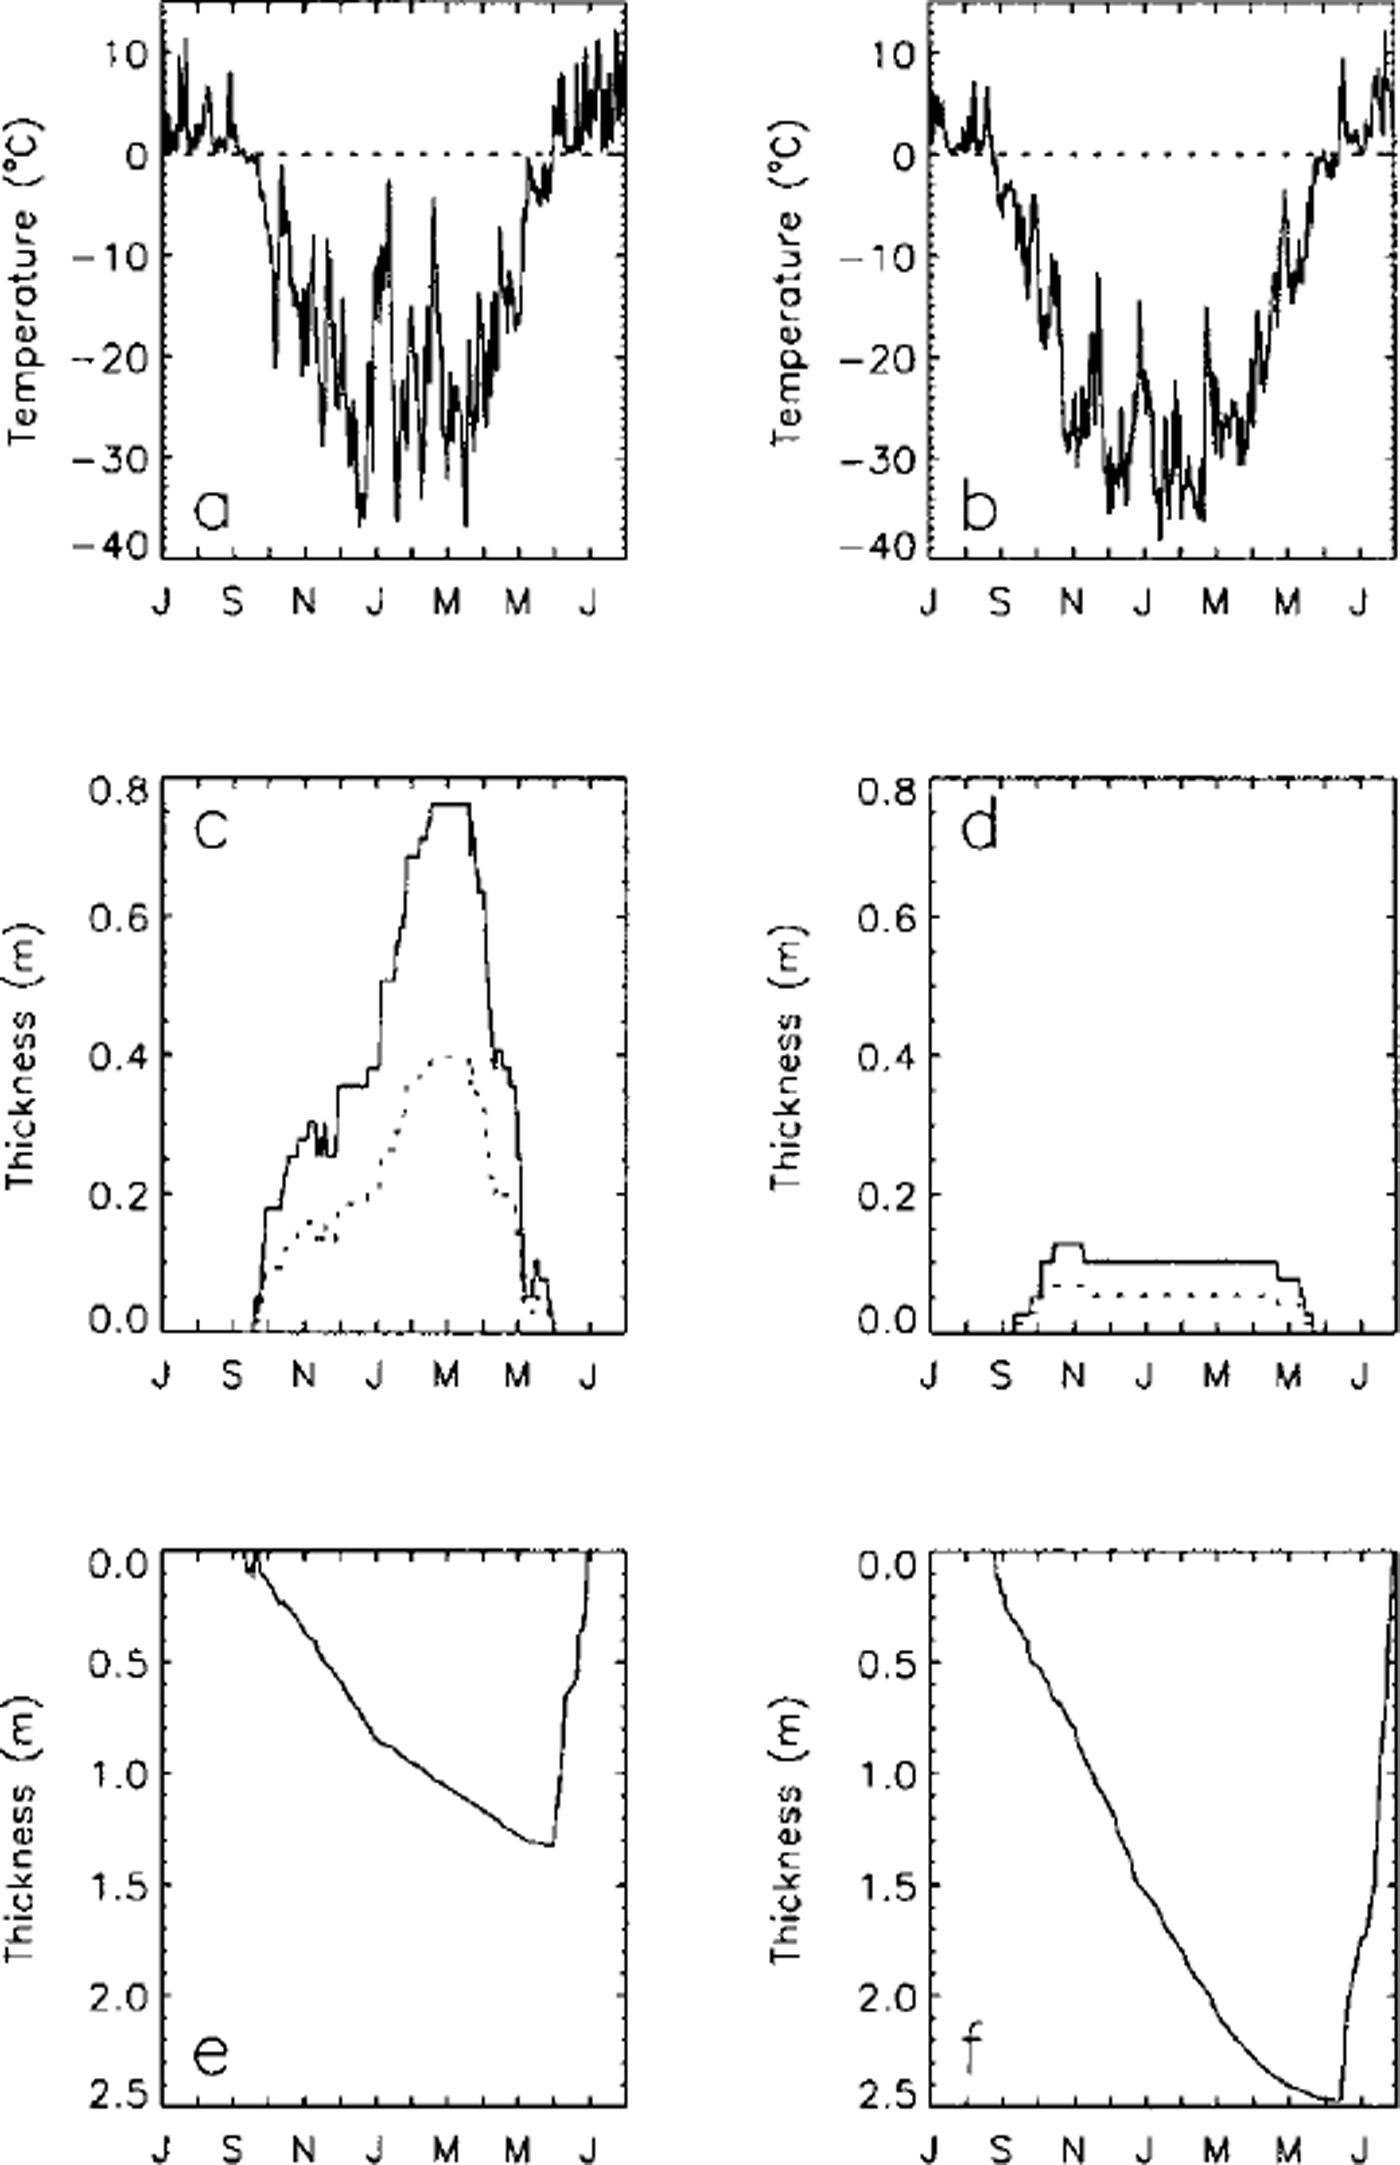
Figure 3 illustrates two extreme cases of the impact of air temperature and snow cover on lake-ice growth and thickness near Barrow. The freezing index was about 4434 and 5708 degree-days for the winters of 1961/62 and 1975/76, respectively, i.e., about 8% below and 18% above the longterm average value. SCI was about 10 447 and 2367 cm-days for the same two winters, i.e. about 98% above and 55% below the long-term average value. The modeled maximum lake-ice thickness is about 1.33 and 2.47 m for the winters of 1961/62 and 1975/76, respectively, i.e. about 30% below and 29% above the long-term average value. These results demonstrate that thinner lake ice during winter 1961/62 was a product of a relatively warm winter (low freezing index) and heavy snowfall (higher SCI), while thicker lake ice during winter 1975/76 was due to the combined impact of a cold winter (lowest freezing index over the study period; Fig. 2a) and very light snowfall (lower SCI).
Variations of mean daily air temperature (a, b) and snow depth (c, d) measured at Barrow, and simulated lake-ice growth and decay (e,f) during two extreme winters: 1961/ 62 with the thinnest lake ice (e) and 1975/76 with the thickest lake ice (f) during the entire 1948–97 study period. The dashed lines in (a) and (b) are the 0°C reference. The dashed lines in ( c) and ( d) represent the adjusted snow depth used as input for modeling with Sfac = 0.52 (see Table 2).
The impact of snow cover on lake-ice growth is mainly due to its insulating effect on heat exchange between the atmosphere and lake ice. Even though snow density is higher on lake ice than on tundra in northern Alaska (Reference Jeffries, Zhang, Frey and KozlenkoJeffries and others, 1999), it is still significantly less dense than lake ice. The bulk thermal conductivity of snow with a density of 0.4 g cm"3 is about one-tenth of the bulk thermal conductivity of lake ice. The timing, duration and thickness of the seasonal snow cover also play an important role in lake-ice growth. Figure 4 indicates the timing, duration and thickness of snow cover and snowfall at Barrow from 1947 through 1997. Early snow at the beginning of the cold season would have a greater insulating effect on lake-ice growth than late snow. From 1950 to the early 1960s, the first day of snow on the ground started about 3 weeks earlier than subsequently (Fig. 4a). This early snow might partly account for the lake-ice thickness decrease from the mid-1950s to the early 1960s (Fig. 2c). Lake-ice thickness minima occurred during the mid-1960s mainly due to the combined influence of early snow cover, heavy snowfall (Fig. 4d) and greater snow thicknesses (Fig. 4e and f), even though the freezing index was generally above its long-term average (Fig. 2a). The combined impact of late snow cover, decreased snowfall and snow thickness, coupled with the higher freezing index, probably accounts for peak lake-ice thickness values during the mid-1970s (Fig. 2b). The decreasing lake-ice thickness from the mid-1970s to the 1980s is probably due to the effect of early snow cover and relatively warmer winters (lower freezing index), even though snowfall was decreasing (Fig. 4d). As snowfall (Fig. 4d) increased and the freezing index (Fig. 2a) decreased after the mid-1980s, lake-ice thickness decreased (Fig. 2c).
Interannual variations of first day of snow on ground (a), last day of snow on ground (b), duration of the seasonal snow cover (c), annual total snowfall (d), average winter snow thickness ( e) and maximum snow thickness by the end of winter (J), 1947–97, at Barrow The thin solid lines represent the individual annual values of each variable. The thick solid lines are the smoothed curves using a lowPass filter with a cut-off frequency of 0.091 a–1 . The dashed lines represent the long-term average values of each parameter.

Sensitivity analysis
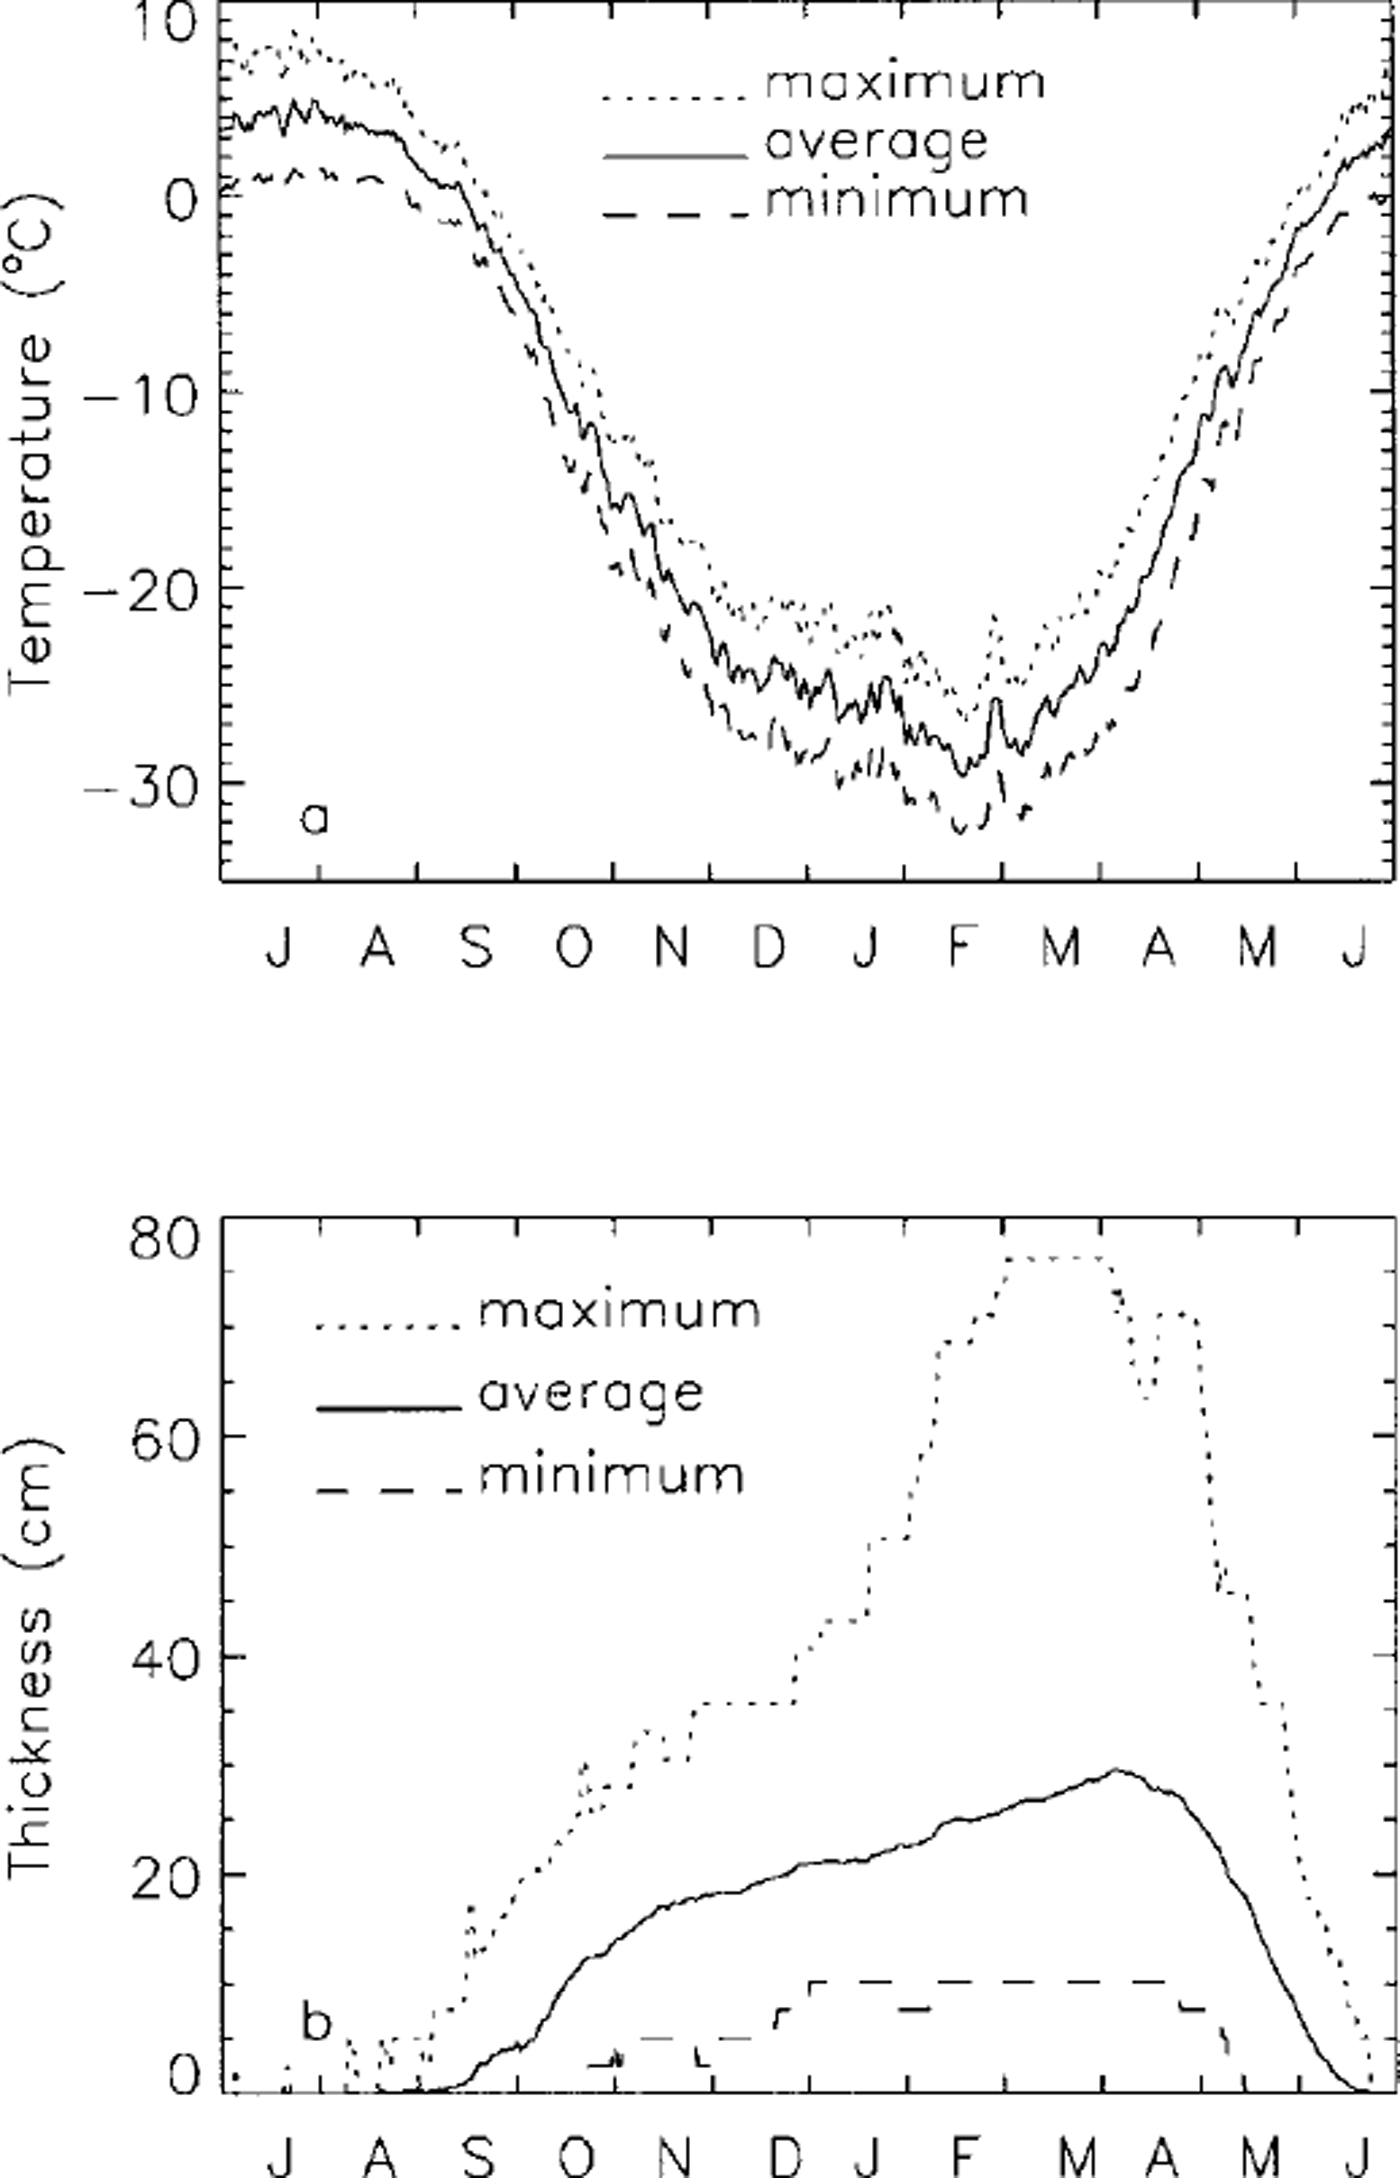
A series of sensitivity analyses was conducted to investigate the impact of changes in snow thickness, bulk thermal conductivity of snow and air temperature on lake-ice growth. The baseline input throughout this sensitivity study includes long-term daily mean air temperature (Fig. 5a) and snow depth (Fig. 5b). The results calculated from the baseline input indicate that maximum lake-ice thickness is about 1.86 m near Barrow.
Variations of the long-term (1947–97) mean daily maximum, average and minimum air temperature (a), and the maximum, average and minimum snow depth (b) at Barrow.
To investigate the impact of changes in snow thickness on lake-ice growth, the daily snow thickness Hs(t) is determined by

where Hm(t) is the long-term measured daily average snow depth (Fig. 5b).
To study the impact of the potential response of lake-ice growth to changes in winter air temperature, the daily mean air temperature is varied according to (Reference Zhang and StamnesZhang and Stamnes, 1998):

where Tm(t) is the baseline input daily mean air temperature and ΔT(t) is the change in daily air temperature. For Pi ≤ t ≤ P2)

and for P2 ≤ t ≤ P3,

where ΔTmax is the potential maximum change in magnitude of air temperature in the middle of winter P2, and P1 and P3, respectively, represent the first day in fall and last day in spring when the daily mean air temperature is below 0°C. Equations (9) and (10) imply that maximum changes in magnitude of ΔT(t) occur at P2, and no change at P1 and P3, with linear variation within the intervals. P1 occurs on day 77, P2 on day 232 and P3 on day 344, starting from 1 July.
Figure 6 illustrates variations of maximum lake-ice thickness with changes in snow depth, bulk thermal conductivity of snow and air temperature. The maximum lake-ice thickness would vary from 2.62 m for Sfac = 0.0 (no snow) to about 0.69 m for Sfac = 2.5 (maximum snow thickness of 0.75 m); maximum lake-ice thickness decreases by a factor of 3.7 (Fig. 6a) due to the insulating effect of the increased snow cover. The rate of lake-ice thickness change with Sfac is greater when Sfac is small (Fig. 6a).
Variations of the simulated maximum lake-ice thickness with changes in snow depth (a), bulk thermal conductivity of snow (b) and air temperature (c) at Barrow. Crosses represent the maximum lake-ice thickness simulated with the baseline inputs.
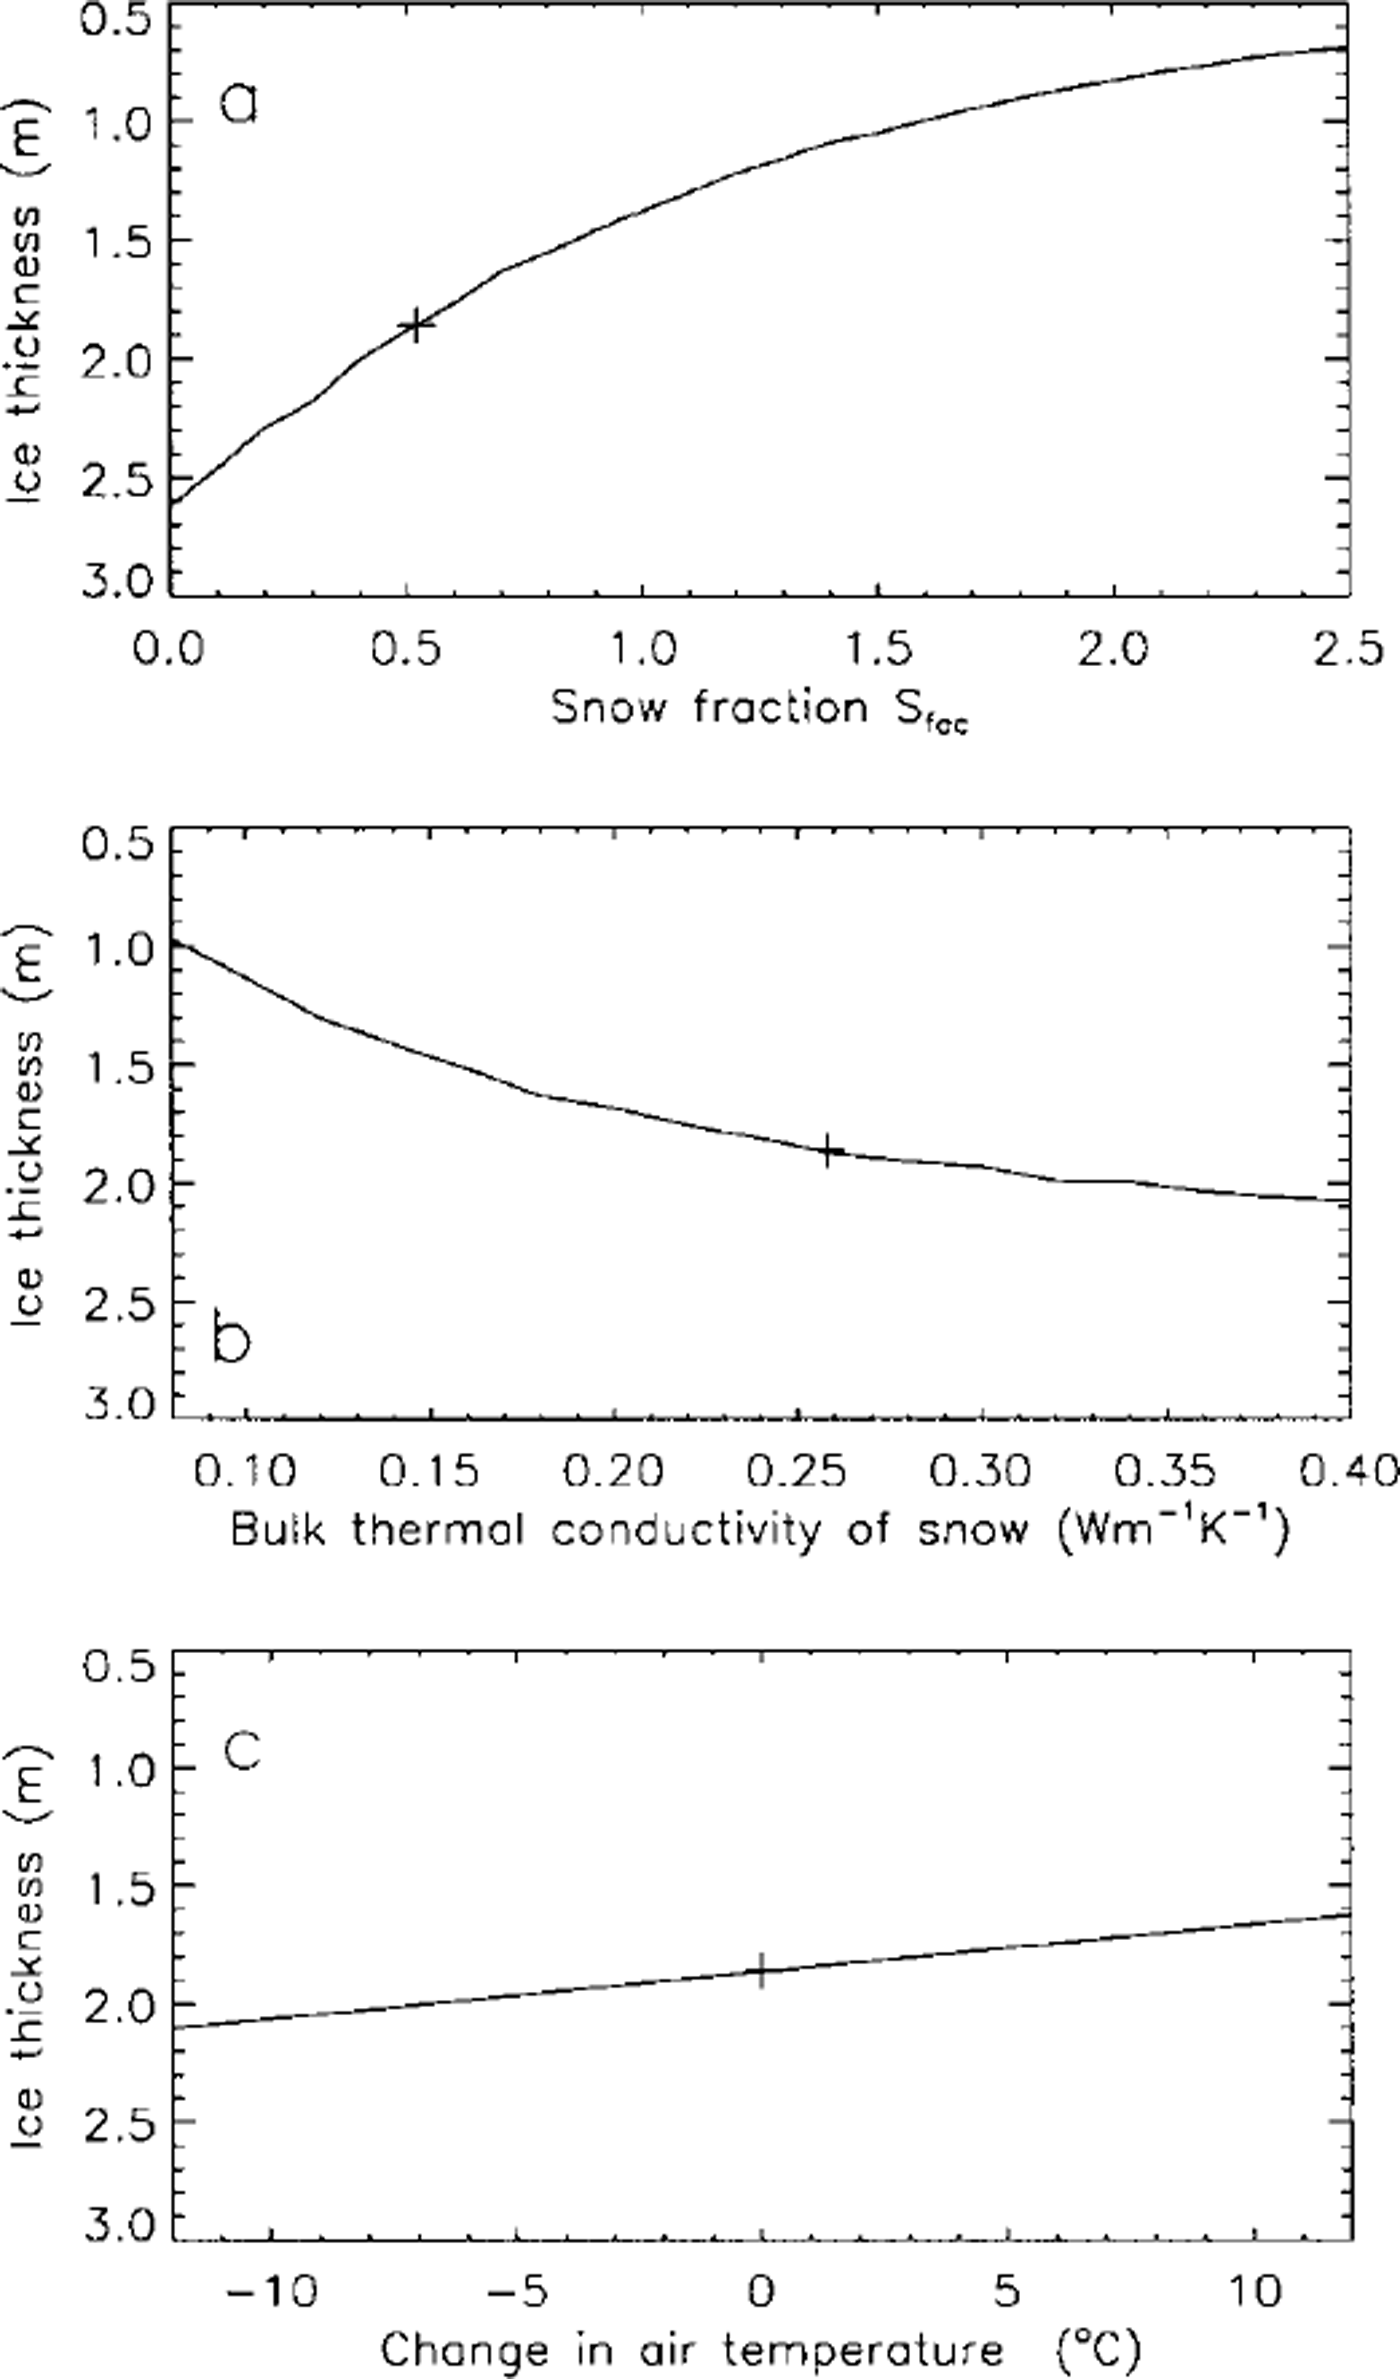
Changes in the bulk thermal conductivity of snow also have a significant impact on lake-ice thickness. Varying snow bulk thermal conductivity from 0.08 Wm–1 K–1 6 (fresh or low-density snow) to 0.40 W nT1 K–1 (wind-packed or high-density snow) would increase maximum lake-ice thickness from 0.97 m to 2.07 m (Fig. 6b), i.e. a twofold increase.
The impact of changes in air temperature on lake-ice thickness is relatively small compared to the effect of snow thickness and thermal conductivity. For a ±12°C change in ΔTmax, lake-ice thickness would decrease linearly by 23% from 2.10 m to 1.62 m (Fig. 6c). A ±12°C change in ΔTmax is equivalent to a change in the freezing index from 5781 degree-days to 3909 degree-days. For comparison, the highest and lowest freezing indices for 1947–97 (Fig. 2a) are 5708 and 4180 degree-days, respectively.
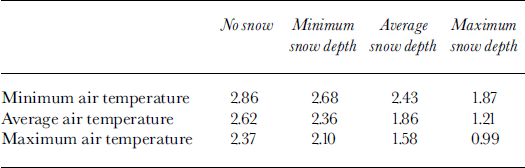
A series of calculations were conducted using different combinations of long-term average daily maximum, mean and minimum air temperature (Fig. 5a) and daily maximum, mean and minimum snow depth (Fig. 5b) at Barrow as input. The simulated results are summarized in Table 3. If there is no snow on lake ice, a change in air temperature from the long-term average minimum to the long-term average maximum would decrease lake-ice thickness only by 0.49 m, a 17% decrease. With maximum snow thickness on lake ice, a change in air temperature from the long-term average minimum to the long-term average maximum would decrease lake-ice thickness by 0.88 m, a 47% decrease. Changes from no snow to maximum snow thickness over lake ice would decrease lake-ice thickness by 0.99 m for the long-term average minimum, 1.41m for the long-term average mean and 1.38 m for the long-term average maximum daily air temperatures, i.e. 35%, 54% and 58% decreases, respectively. For two extreme cases, the model predicts that lake-ice thickness would decrease from 2.68 m (inputs are long-term average minimum daily air temperature and absolute minimum snow depth) to 0.99 m (inputs of the long-term average maximum daily air temperature and absolute maximum snow depth), a 63% decrease.
Simulated lake-ice-thickness ( m) variations with long-term mean minimum, average and maximum air temperature and snow depth near Barrow
Summary and Discussion
A physically based finite-element heat-transfer model with phase change has been developed to investigate lake-ice growth and processes in northernmost Alaska. The model is validated using field measurements and used to study interannual and interdecadal variations of lake-ice thickness and their sensitivity to climatic change near Barrow. The main findings from this study are:
The melting factor of lake ice near Barrow is about 1.53 cm ˚C–1d–1, slightly higher than the value of 1.29 cm ˚C–1 dȡ1 at Barter Island and significantly higher than values obtained in the 1970s in northern Canada.
The long-term (1947–97) mean freezing index (1 July-30 June) is 4824 ±358 degree-days, with extremes varying from 5708 to 4180 degree-days. The long-term mean SCI is 5268 ± 2047 cm-days with extremes ranging from 10 447 to 2040 cm-days. The simulated long-term mean maximum lake-ice thickness is 1.91 ±0.21 m, with extremes of 1.33–2.47 m.
Change in the seasonal snow cover is the most important single factor controlling interannual and interdecadal variations of lake-ice thickness in northern Alaska. Winter monthly air temperature or freezing index is an important but secondary factor influencing variations of lake-ice growth and thickness.
There is a strong anticorrelation between the SCI and maximum lake-ice thickness, i.e. maximum lake-ice thickness is greater during years with lower SCI than during years with higher SCI.
Maximum lake-ice thickness was a little above its longterm average during the mid-1950s but decreased substantially during the mid-1960s because of the combined impact of higher SCI and early and greater snowfall, even through the freezing index was well above its longterm average. Lake-ice thickness reached peak values during the mid-1970s mainly due to the lower SCI, colder winters (higher freezing index) and late snowfall. Subsequently, lake-ice thickness generally decreased due to the increased SCI and decreased freezing index.
Sensitivity studies indicate that a change in maximum snow depth from 0.0 cm (no snow) to 0.75 m would decrease maximum lake-ice thickness from 2.62 m to 0.69 m, a 73% decrease. A change in the bulk thermal conductivity of snow from 0.08 W m–1 K–1 (fresh snow) to 0.40 6 Wm–1 K–1 1 (wind-packed snow) would increase maximum lake-ice thickness from 0.97 m to 2.07 m, a greater than two-fold increase. A change in the freezing index of air temperature from 5781 degree-days to 3909 degree-days would decrease maximum lake-ice thickness from 2.10 m to 1.62 m, a 23% decrease.
For extreme cases, maximum lake-ice thickness decreases from 2.68 m with model inputs of minimum daily air temperature and snow depth, to 0.99 m with model inputs of maximum daily air temperature and snow depth, a 63% decrease.
This study indicates that maximum lake-ice thickness varies significantly from year to year in northern Alaska. A recent study indicates that the mean conductive heat flux through snow cover on floating lake ice (ice is not frozen to the bottom) is about 2.4 times greater than the mean heat flux through snow cover on grounded ice (ice is frozen to the bottom), and 11.4 times greater than the heat flux through snow cover on tundra (Reference Jeffries, Zhang, Frey and KozlenkoJeffries and others, 1999). Changes in maximum lake-ice thickness could have a direct impact on the area of ice and the numbers of lakes which do and do not freeze to the bottom each winter in the region, considering that most of the thaw lakes in northern Alaska are 1–3 m deep (Reference MellorMellor, 1982). Consequently, changes in maximum lake-ice thickness would have a significant impact on the regional energy balance, and thus a significant feedback to the climatic system.
The minimum condition for the formation of a talik (thaw bulb) is that lakes do not freeze to the bottom by the end of winter. Changes in maximum lake-ice thickness would have a significant effect on the thermal regime of permafrost and interannual and interdecadal talik formation at lakes where water depths vary within the range of maximum lake-ice thickness over the past 50 years (Fig. 2c). For example, for lakes with a water depth of 1.91 m, the long-term average maximum lake-ice thickness, a talik may form during years when the lake does not freeze to the bottom and may refreeze during years when the lake freezes completely to the bottom. Talik formation and refreezing under thaw lakes in northern Alaska would have a significant impact on methane release from lakes to the atmosphere. For example, during years when a talik forms under a thaw lake, the methane efflux may be substantially greater when permafrost thaws than during years when the talik refreezes. From the simulated time series of the interdecadal variations of maximum lake-ice thickness (Fig. 2c), we may speculate that the methane efflux might be greater over thaw lakes during the late 1950s and the 1960s, when maximum lake-ice thickness was relatively low, than during the 1970s, when maximum lake-ice thickness reached peak values.
This study demonstrates that lake-ice growth and thickness can be modeled with confidence, provided the necessary field measurements are available. However, the currently available data are spatially and temporally sporadic. This study and others indicate that lake-ice thickness can vary substantially from year to year, and from place to place, due to the spatial and temporal variations of environmental conditions, especially snow-cover parameters. Systematic field measurements, model improvements and validation are essential for better understanding the thaw-lake system and for further investigation of the interdecadal variations of lake-ice growth and thickness in the Arctic and sub-Arctic.
Acknowledgements
Wei Zhou worked on development of the model during the early stage of the project. Jingping Ye at the U.S. National Snow and Ice Data Center, University of Colorado, Boulder, helped to run the numerical model. We would like to express our gratitude to the two anonymous reviewers for their comments and suggestions. This work was supported primarily by NASA Polar Program grants NAG5–4171, NAG5–4170 and NAGW-4966 to the University of Colorado, Boulder, and the University of Alaska Fairbanks. Financial support does not constitute an endorsement of views expressed in this paper.



