


Introduction
Larsen Ice Shelf extends north-south along the east coast of the Antarctic Peninsula (Fig. 1) in a region with strong latitudinal and longitudinal temperature gradients (Reference ReynoldsReynolds, 1981). Located close to the climatic limit for the existence of ice shelves (Reference MercerMercer, 1978), it offers the opportunity to investigate the retreat and disintegration of floating ice bodies.
Map of Antarctic Peninsula showing Larsen Ice Shelf sections A (which disintegrated in early 1995), B and C.
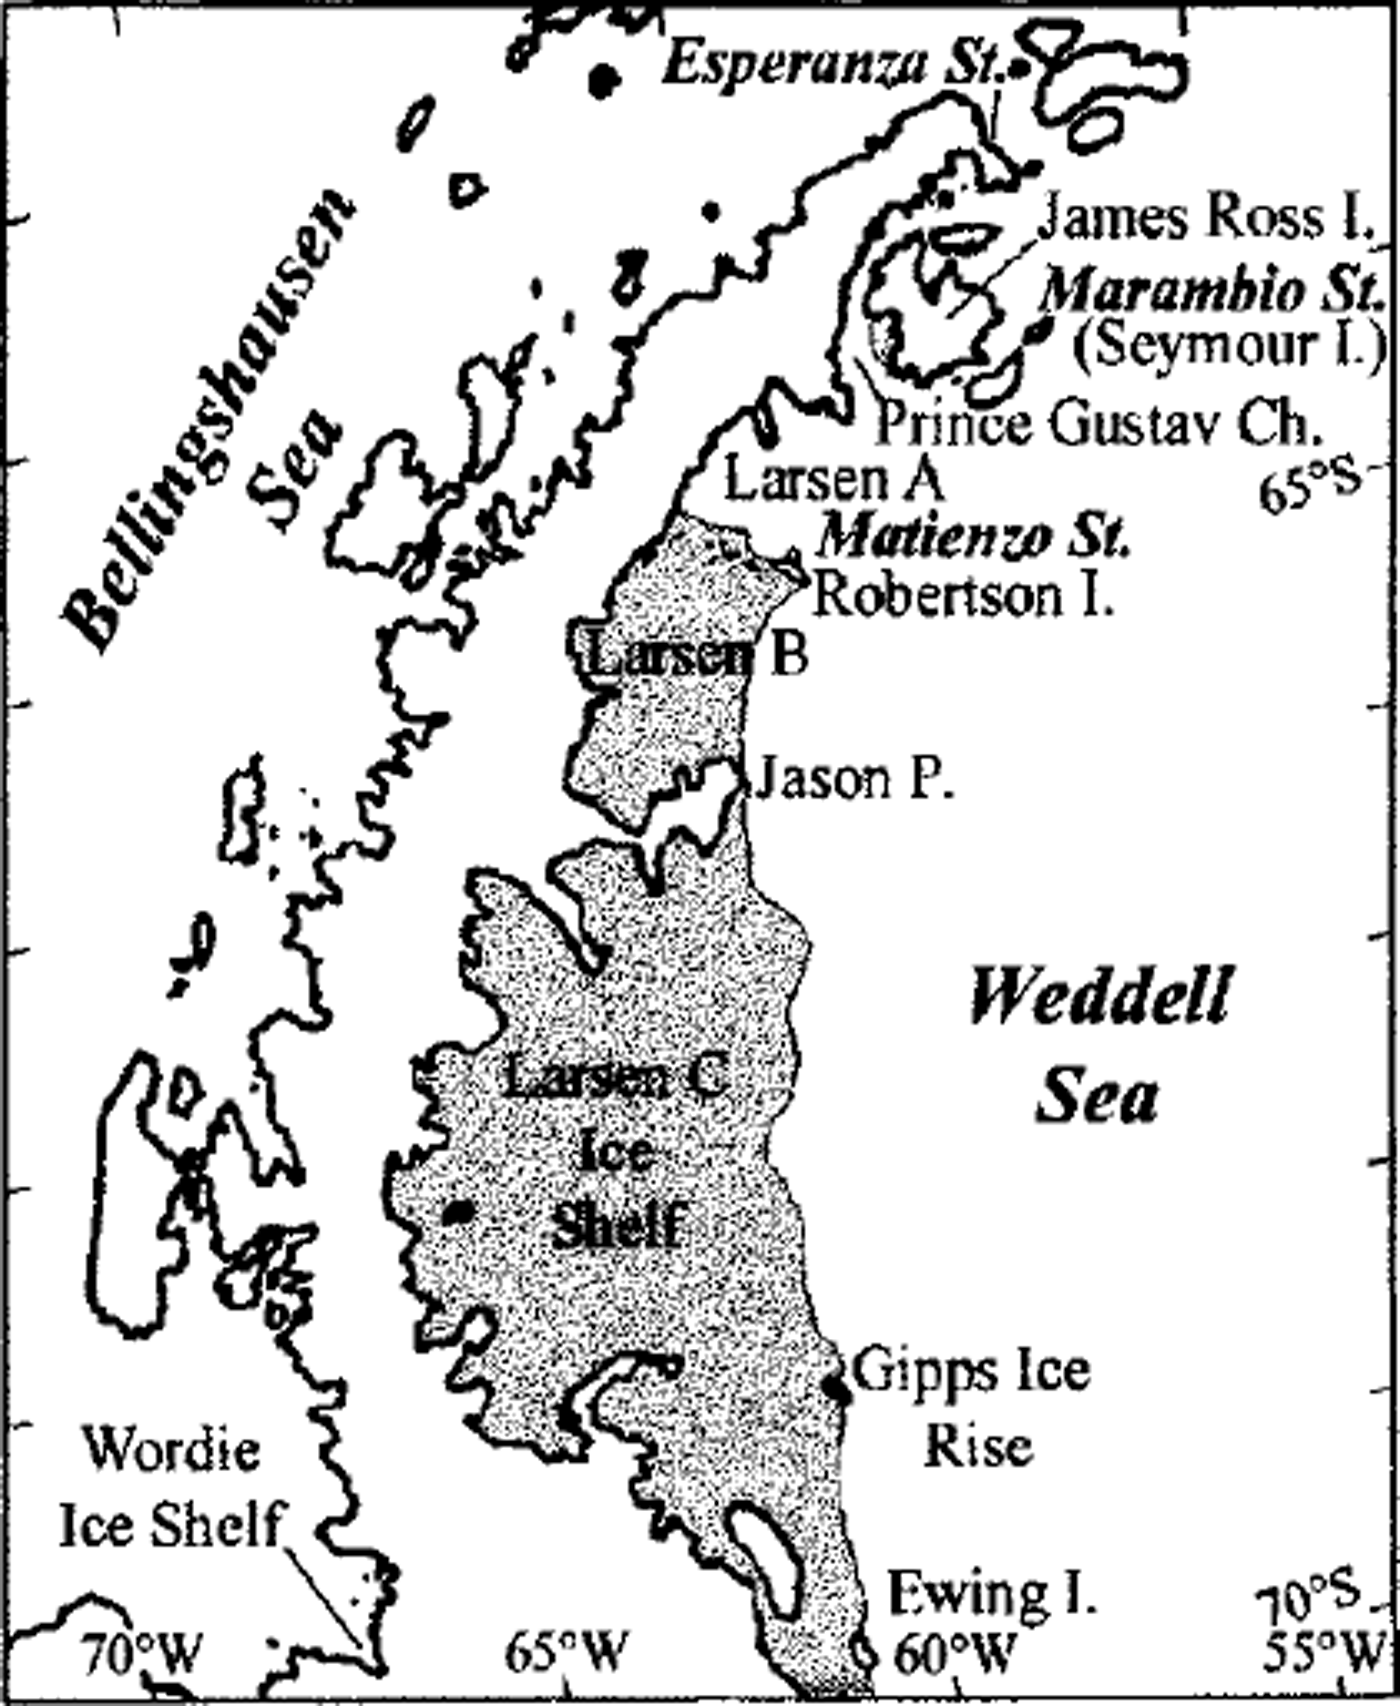
Two sections of the northern Larsen Ice Shelf collapsed in early 1995 after a sustained period of more gradual retreat in accordance with the regional warming trend (Reference Rott, Skvarca and NaglerRott and others, 1996, Reference Rott, Rack, Nagler and Skvarca1998; Reference Skvarca, Rack, Rott and Ibarzabal y DonangeloSkvarca and others, 1998). The present northernmost section, named Larsen B (Reference Vaughan and DoakeVaughan and Doake, 1996), is confined to the north by Robertson Island-Seal Nunataks (65° S) and to the south by Jason Peninsula (66° S) (Fig. 2). In contrast to the behaviour of the ice-shelf sections north of Seal Nunataks (Fig. 1), Larsen B advanced continuously from 1975 (Reference SkvarcaSkvarca, 1994; Reference Rott, Rack, Nagler and SkvarcaRott and others, 1998) until the end ofjanuary 1995 when the large iceberg A32 calved off.
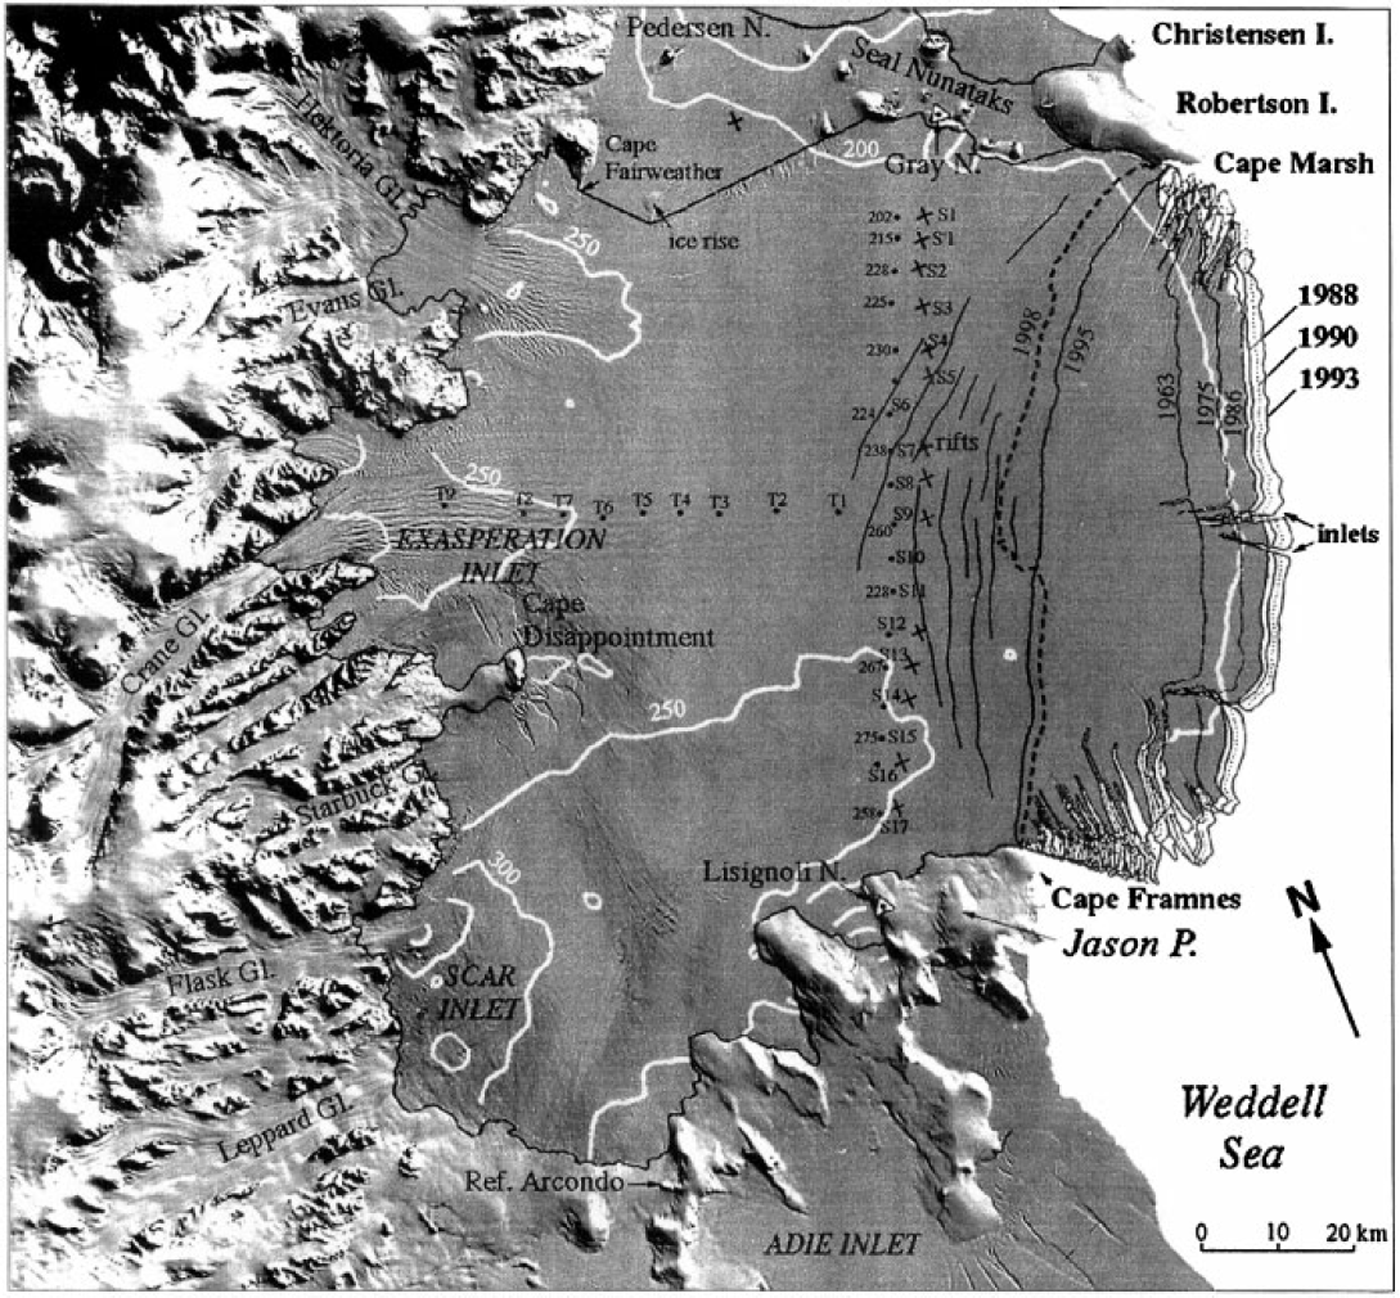
Landsat image, 1 March 1986. No melt features are observed on this image obtained at the end of summer 1985-86 at low temperatures. The image shows ice rises, rifts, flowlines, inlets and regions of chaotic rifting at CaPe Disappointment, south of Robertson Island and north of CaPe Framnes. Thickness contours are from Reference Doake, Corr, Rott, Skvarca and YoungDoake and others (1998). Ice-thickness data along the S-transect (dots) from S6 to S17 are from seismic refractions, measured in October-November 1988 (Reference Keller, Diaz and SkvarcaKeller and others, 1991), and from SI to S4 are from monoPulse radar measurements in late 1991 (unpublished). The ice front positions in different years were derived from the following satellites: 1963 (Argon), 1975 (Kosmos), 1988 and 1990 (Landsat), 1993 and 1995 (ERS SAR), 1998 (RADARSAT). Dots indicate positions of stakes in 1988, and crosses positions of stakes in 1997. Major rifts, derived from the SAR image of l November 1996, are shown.
This paper examines the dynamical behaviour of Larsen B over a 34 year period based on time series of satellite images obtained from a variety of sensors. The temporal sequence of observation improved significantly in 1991, when the European Remote-Sensing Satellite (ERS-1) of the European Space Agency (ESA) was launched with a synthetic aperture radar (SAR) on board. In 1995 the launch of ERS-2 and RADAR-SAT further improved the observation capabilities. The information is complemented by data from several field Campaigns which were initiated in this area in 1980.
Satellite and Georeference Data
Recently declassified US military satellite data extend the observations of Larsen B back to mid-1963. Photographs from 29 August 1963 at 140 m nominal resolution are the earliest satellite images available for this region. Other visible satellite data utilized in this study are a Kosmos KATE-200 photograph from 3 October 1975 (30 m nominal resolution), a Landsat Multispectral Scanner (MSS) image from 1 March 1986 (57 m × 57 m pixel size) and Landsat Thematic Mapper (TM) images (28.5 m × 28.5 m pixel size) from 19 January 1988 and 8 January 1990. Ten ERS SAR images in geocoded ellipsoid-corrected (GEC) format with a nominal resolution of 25 m × 25 m (2 July 1992, 26 August 1993, 28 January 1995, 30 January 1995, 8 March 1995, 28 October 1995, 29 February 1996, 1 November 1996, 2 March 1997 and 4 July 1997) provided detailed information on changes before and after the calving event. The most recent observations were derived from a RADARSAT ScanSAR image (100mx100m nominal resolution) from 25 April 1998.
All satellite images were co-registered; the analysis was carried in Universal Transverse Mercator (UTM) projection. The absolute location accuracy was improved using geodetic field data such as global positioning system (GPS) lines of ice-rock boundaries at several nunataks and islands as reference. In the northern part, several GPS lines in differential kinematic mode were measured during field Campaigns in 1994,1996 and 1997 at Robertson Island, Murdoch and Larsen Nunatak, and to the south at Arcondo refuge and Lisignoli Nunatak, close to the western and eastern margins, respectively, ofJason Peninsula (Fig. 2).
Changes in Areal Extent
The boundaries of Larsen B are plotted in Figure 2 as defined by Reference Rott, Rack, Nagler and SkvarcaRott and others (1998). In the north, Larsen B borders an almost stagnant floating part around Seal Nunataks (Reference Rott, Skvarca and NaglerRott and others, 1996). The western margin of the drainage area of Larsen B is defined by the mountain range of the Antarctic Peninsula which provides the main ice input via large glaciers flowing from the high plateau. The major tributaries from north to south are Hektoria-Evans Glaciers, Crane Glacier flowing into Exasperation Inlet, and Flask-Leppard Glaciers flowing into SCAR Inlet. The southern boundary is defined by Jason Peninsula. The time sequence of the areal extent of Larsen B derived from satellite data is summarised in Table 1, and the seaward margin between Cape Framnes and Cape Marsh in different years is plotted in Figure 2.
Areal extent of Larsen B at different dates

Larsen B advanced steadily from 1963 until late January 1995, when the ice-shelf area decreased by 2320 km2 within 2 days (Table 1). This change was caused by the calving of a large iceberg 1720 km2 in area, named A32, and many small icebergs. This happened between 28 and 30 January at the same time as the collapse of Larsen A (Reference Rott, Skvarca and NaglerRott and others, 1996). After this major calving event, only minor variations were observed along the seaward margin between Robertson Island and Jason Peninsula (Reference Rott, Rack, Nagler and SkvarcaRott and others, 1998). The last calving event occurred in February-March 1998, when about 110 km2 calved off.
Ice-Shelf Morphology
Melt features
Meltwater, which is abundant in warm summers, is a determining factor for the surface morphology of Larsen B. As a result of intense surface melting during the summer, the ice-shelf section north of Cape Disappointment is built up mostly by ice, except at the surface where thin layers of snow accumulate during winter. Various melt features can be observed in the Landsat image of 19 January 1988 extending to the northern boundary of Exasperation Inlet (Fig. 3). This image was acquired during a summer with above-average temperatures, typical of summers after the mid-1980s (Reference Skvarca, Rack, Rott and Ibarzabal y DonangeloSkvarca and others, 1998).
Landsat TM image, 19 January 1988, obtained during a warm summer, showing many meltwater features. Drainage features, streams and melt ponds extend south to Exasperation Inlet. The full white line shows the northern edge of the ice shelf in 1997.

Compared with the visible image from 19 January 1988, the radar images of 1 November 1996 and 4 July 1997 (Figs 4 and 5) show melt features such as streams, drainage channels and melt ponds further south across Exasperation Inlet. These are the result of rising mean summer temperatures (December-February) in the region, which exceeded 0°C for the first time during summer 1992-93, as measured at the nearby Marambio station (Reference Skvarca, Rack, Rott and Ibarzabal y DonangeloSkvarca and others, 1998). These observations are in agreeement with the extent and duration of summer melt on the ice shelves around the Antarctic Peninsula during the period 1978-91, as determined from analysis of passive microwave data (Reference RidleyRidley, 1993).
ERS SAR images in UTM projection. Melt features in both images extend south across Exasperation Inlet to CaPe Disappointment. (a) 1 November 1996. Melt patterns are visible along the inflow of Hektoria-Evans and Crane Glaciers. The bright zone at SCAR Inlet corresponds to the highest elevation of this ice-shelf section. Dark areas (low backscatter) indicate wet snow, and bright areas (high backscatter) dry snow. White line indicates section which is shown enlarged in Figure 5. (b) 4July 1997. Summer surface melt features are well preserved in spite of their frozen state. The T- and S-transects are marked with crosses, as well as the stake at LI. RI, Robertson Island; EI, Exasperation Inlet; SI, SCAR Inlet. ©ESA 1996, 1997.

Section of ERS SAR, 1 November 1996, showing in detail the melt features in the region from Cafe Disappointment to the ice front. ©ESA 1996.
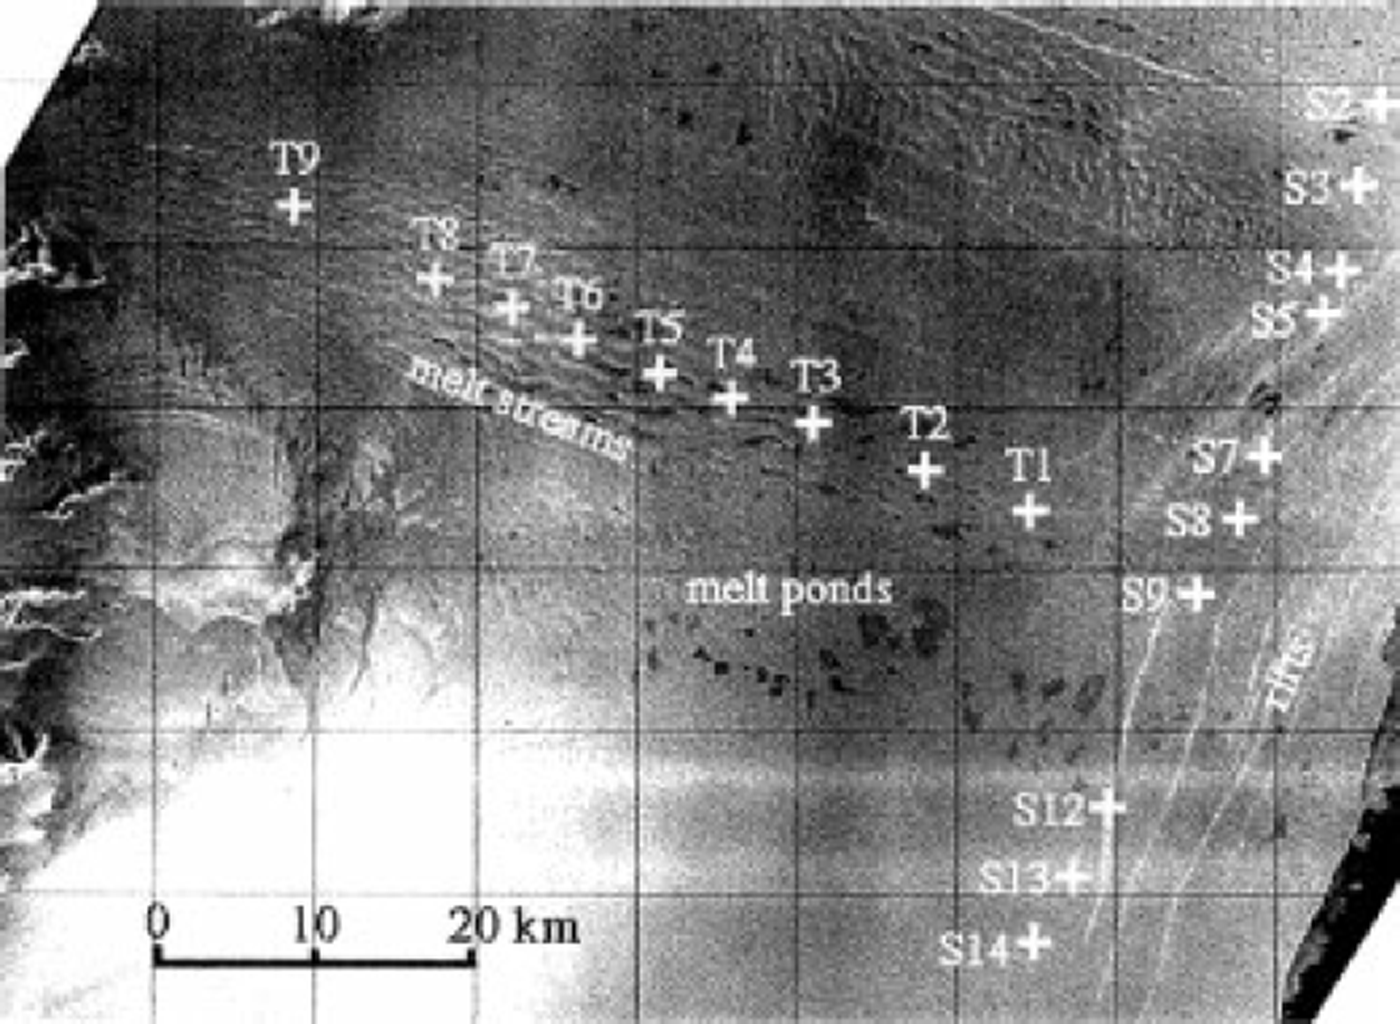
The radar image of 1 November 1996 (Fig. 4a) was obtained after a period with positive temperatures in late October 1996. Due to the low backscatter of wet snow, most parts on the image appear dark. Only a few areas at higher altitudes on Robertson Island, onjason Peninsula and in the mountain region with frozen firn show high backscatter. In the southwestern part of the ice shelf the snow was still dry, as evident from the bright area in the lower left corner of the image. This is also the thickest part of the ice shelf due to the inflow of Flask and Leppard Glaciers (Reference Doake, Corr, Rott, Skvarca and YoungDoake and others, 1998).
Surface morphology on Larsen B changes abruptly south of Cape Disappointment. This distinctive boundary is defined on the ice shelf by the major inflow of Flask and Leppard Glaciers (Figs 2, 4 and 5). In this region comparatively few melt features are observed.
Formation of rifts
From the first field Campaign on Larsen B in 1980 until 1994 no rifts were observed along the S-transect. The Landsat images of 1986 (Fig. 2) and 1988 (Fig. 3) reveal zones of heavy rifting only in areas south of Robertson Island and north of Cape Framnes, as well as on both sides of Cape Disappointment. Rifts due to differential velocities were also detected between the ice rise east of Cape Fairweather and Seal Nunataks (Reference SkvarcaSkvarca, 1994). During the 1994 field Campaign a rift was detected for the first time close to S5. South of S6 a long detour was necessary in order to reach S7 and to avoid a long, wide depression which indicated the beginning of rifting. No sign of rifting was observed along this profile further south to Jason Peninsula.
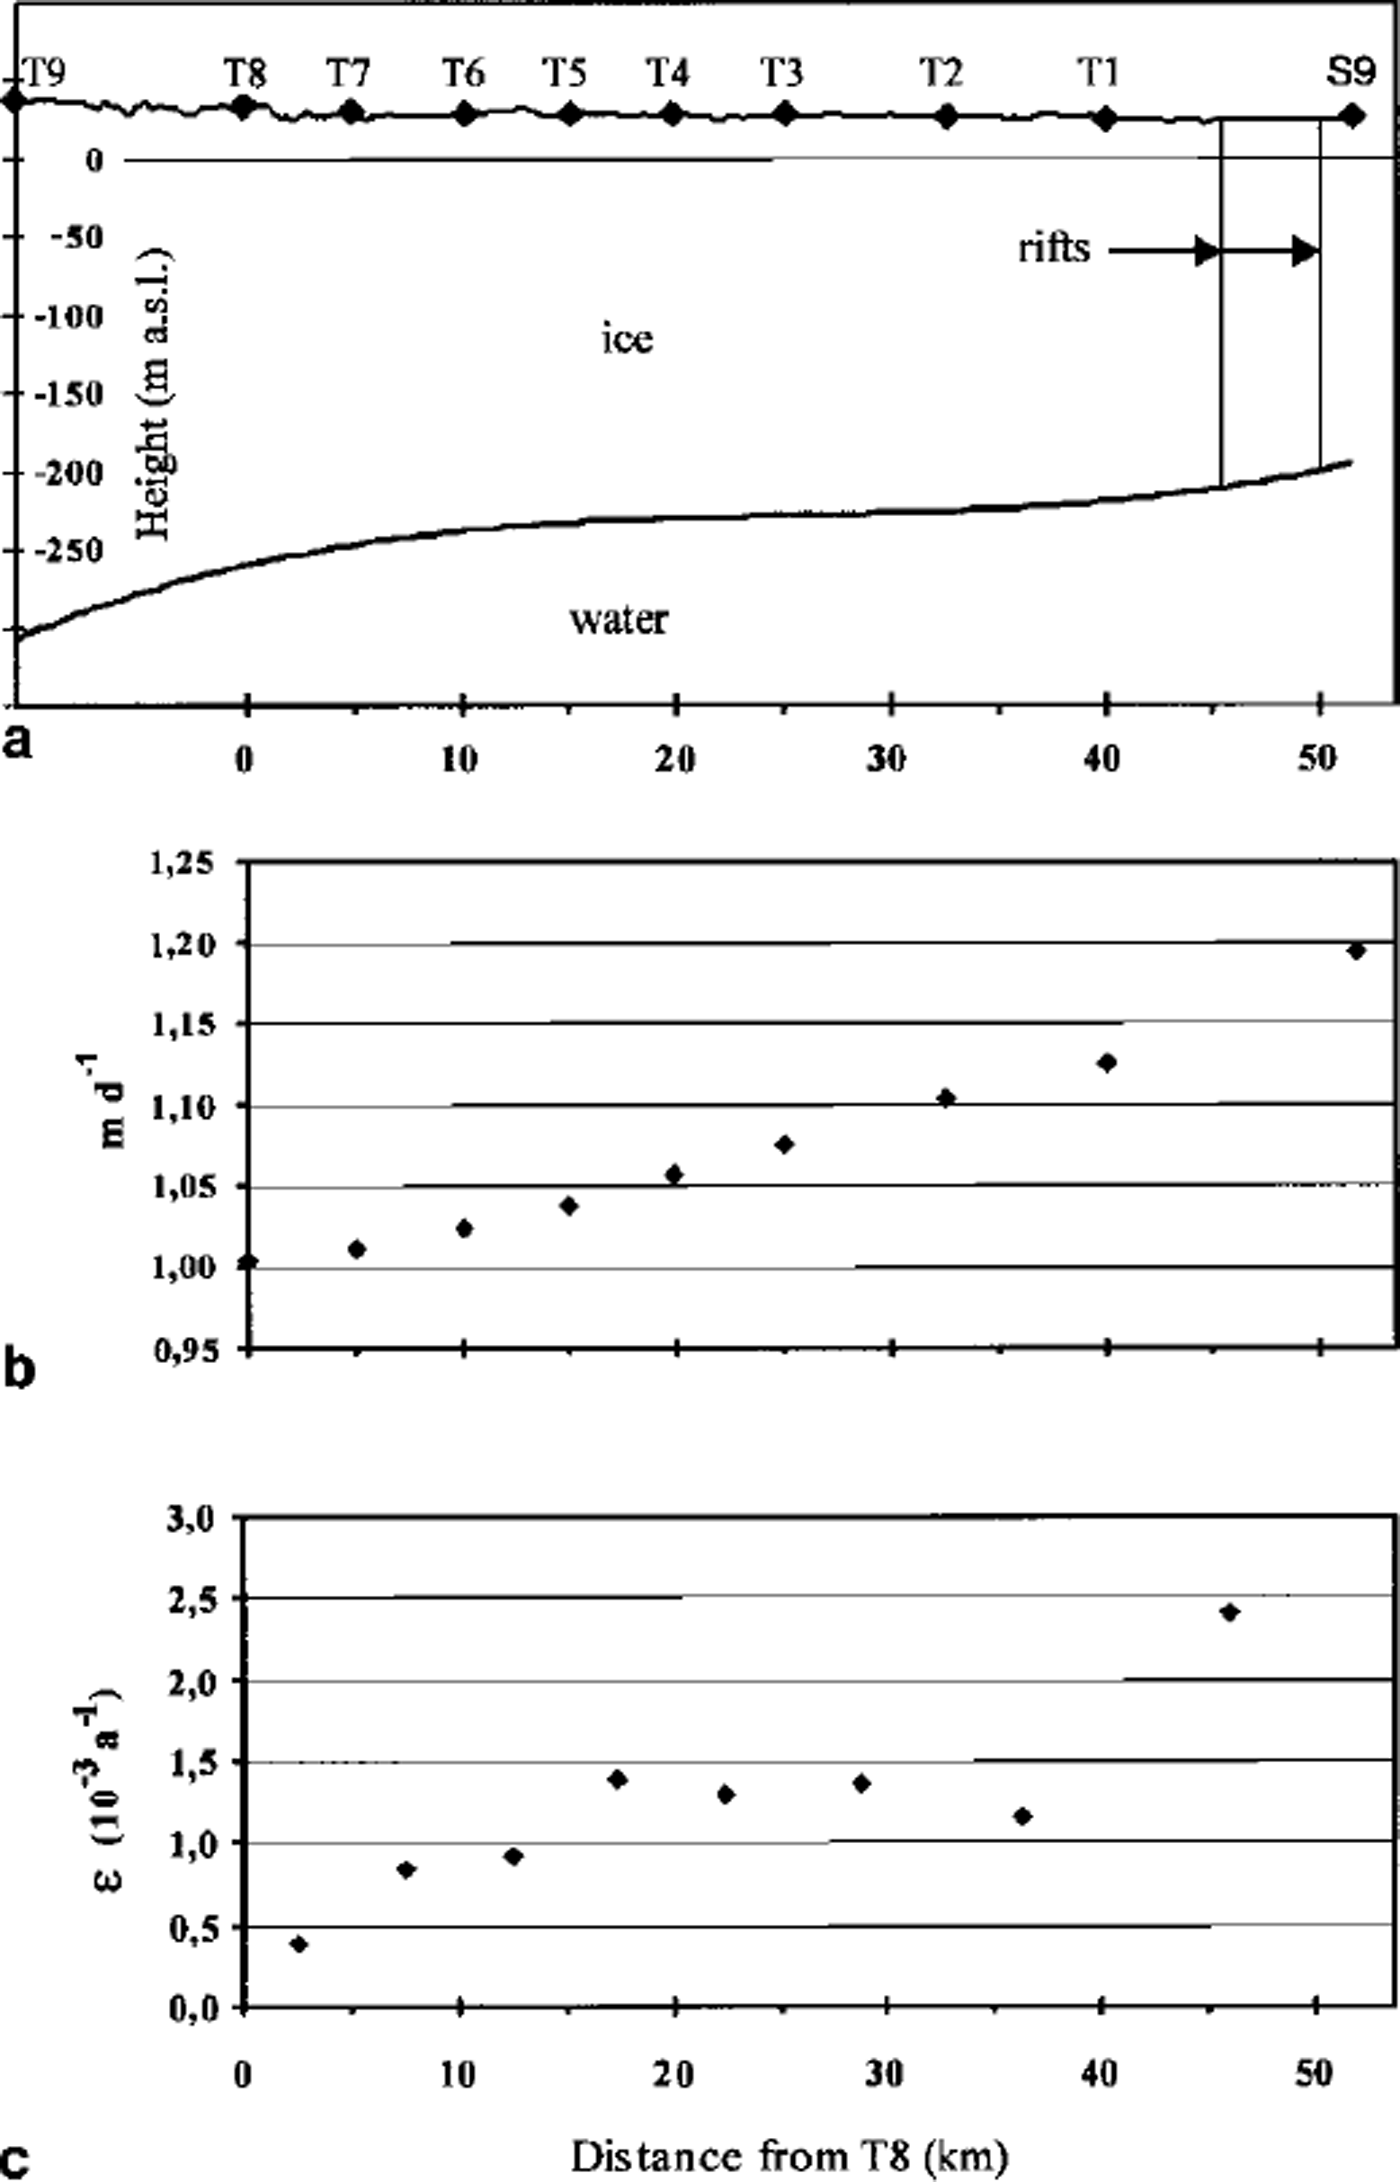
In 1996 a longitudinal profile (T-transect) was set along the central flowline of Crane Glacier upstream of S9 (Fig. 5). The strain rates measured between 1996 and 1997 are shown in Figure 6c. It should be noted that stakes Tl and S9 are separated by two large rifts (Figs 2, 4a and 5). These rifts, which did not exist in 1991, were observed for the first time during the field traverse in October 1994 in an early stage of formation. A significant increase in longitudinal strain rate of 1.24x10⁻³ a−1 was measured between T1/T2 and T1/S9. This high strain-rate value is attributed to rifts, and the corresponding separation rate of the ice-shelf plates is about 15 m a−1. This appears reasonable according to visual observations in 1994 and 1997. It can be concluded that the new ice front will retreat to a position between Tl and S9 after the next significant calving event.
(a) Thickness profile of the ice shelf along a flowline from T9 to S9, derived from static and kinematic differential GPS measurements at the surface assuming hydrostatic equilibrium and corrected for tidal motion. (b) Velocity (md−1) along the same profile, October 1996-October 1997. ( c) Strain rates along the T-transect during the same period.
Most of the rifts, visible in the ERS SAR image of 1 November 1996 (Fig. 4a) and drawn in Figure 2, started to form prior to the calving in 1995 but rapidly attained their present size and pattern after this event. The formation of new rifts parallel to the ice front, the rate of rift opening and the increasing fracturing processes occurring between Robertson Island and Jason Peninsula indicate that large calving events may be expected in this area in the next few years. Similar rift formations were observed on Larsen A prior to its collapse.
Dynamics
Measurements of ice motion and mass balance were initiated on Larsen B in the early 1980s along a line extending north-southward (S-transect), between Gray and Lisignoli Nunataks. In October 1996 a new longitudinal profile (T-transect) was set up from Exasperation Inlet towards the ice edge following a flowline of Crane Glacier (Figs 2 and 4b). Remeasurement of the transect in 1997 yielded the velocities shown in Figure 6b. The thickness profile of the ice shelf from T9 to S9 was obtained by assuming that the ice shelf is in hydrostatic equilibrium. The tidal-corrected surface heights were derived from static and kinematic differential GPS measurements with an estimated accuracy of about 1 m. In Figure 6a the third degree polynomial fit from the derived ice thicknesses is plotted.
Between 1963 and 1993 the central part of the ice front advanced by about 11.5 km. The corresponding rate of advance of 383 ma−1 is similar to the maximum surface velocities (395 ma−1, 1988-94), measured further inland at points S7 and S8. This implies that almost no calving occurred along the seaward margin from 1963 to early 1995. This conclusion is supported by the remarkable similarity of the ice-front shape from Gape Marsh to Gape Framnes as the satellite images show (Fig. 2).
The average velocities in the northern part of the S-transect (stakes S1-S5) show only a slight increase (about 2%) between the periods 1984-88 and 1988-94. However, the motion at these stakes increased considerably from 1994 to 1997. The velocities measured along the S-transect for three different periods are shown in Figure 7.
Velocities along the S-transect between Gray and Lisignoli Nunataks (see Fig. 2) for the periods 1988-94, 1994-97 and 1996-97
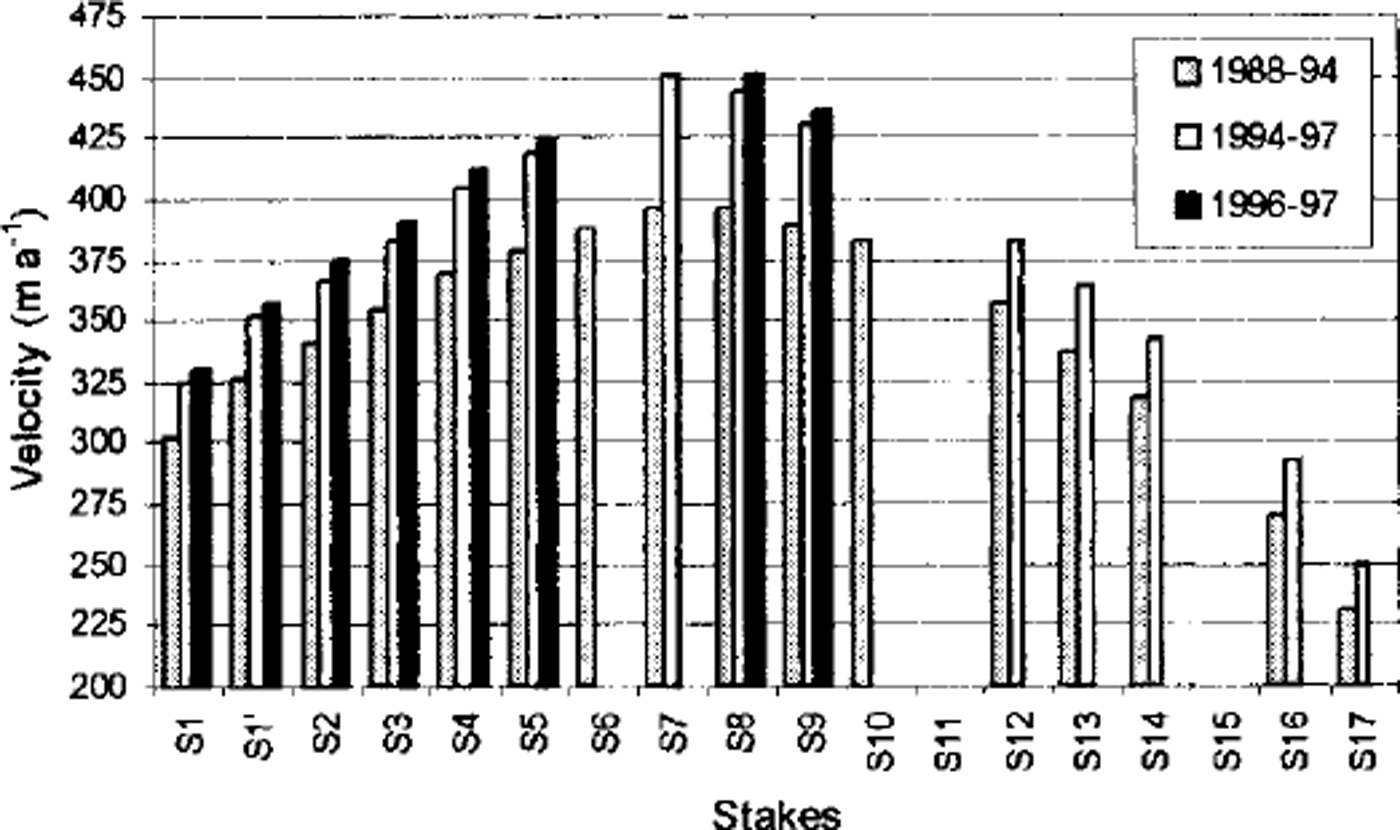
The mean velocity at stakes S7 and S8 increased from 395 m a−1 between 1988 and 1994 to 447 m ^ between 1994 and 1997 (Fig. 7). Without rifting we would expect an acceleration of about 0.7% in the central part of profile S due to the displacement towards the ice front. This is much lower than the observed value of 13.2%. Most of the observed increase in velocity can probably be attributed to the formation of new rifts, as suggested by Reference Rott, Rack, Nagler and SkvarcaRott and others (1998).
Taking into account the flow behaviour, we may conclude that about 80 years of favorable environmental conditions, without any significant calving, would be required to regenerate the ice-shelf area lost at Larsen B in a single calving event in January 1995. The rifting, the extension of melt events in time and space, and ongoing calving suggest that such a regeneration is very unlikely.
Conclusions
Recently declassified US military satellite data indicate that after 1963, Larsen B advanced steadily for more than three decades until a major calving occurred in early 1995. This behaviour contrasts with the steady retreat observed on the ice-shelf sections further north. The shape of the ice front between Robertson Island and Jason Peninsula remained similar during this time interval. This implies that almost no calving occurred along the seaward margin in this section over the 30 year period, a conclusion supported by the velocities measured at stakes close to the front, which are similar to the motion of the ice front derived from sequential satellite images. The multi-temporal sequence of ERS SAR images allowed the areal changes since 1991 to be monitored in unprecedented detail, and showed that melting is spreading southward in accordance with the increasing mean summer temperatures in the region. In addition, an increase of 13.2% in mean surface velocities was observed between the periods 1988-94 and 1994-97 in the central part of the ice shelf. This and the formation of new rifts parallel to the ice front indicate that further retreat should be expected in the next few years. Similar conditions of rifting and melting were observed on Larsen A prior to its collapse. All these observations indicate that major calvings can be expected to affect Larsen Bin the near future.
Acknowledgements
Thanks are due to T. Toconas of Gendarmeria Nacional Argentina for his assistance during field Campaigns, and to Fuerza Aerea Argentina for the logistics. We are also indebted toJ. G. Ferrigno and R.S.Williams, Jr of the U.S. Geological Survey for providing the 1988 and 1990 LandsatTM images. This work is a contribution to the Larsen Ice Shelf Project of Direction National del Antartico, Institute Antártico Argentine, and to the Austrian Science Fund (FWF) Project No. 12923 GEO. The ERS SAR data were made available by ESA for the experiment AO2.A101. The RADARSAT Scan-SAR image was provided for ADRO Project No. 414.



