
I. INTRODUCTION
17-4 PH Stainless Steel (SS) is a precipitation hardened martensitic stainless steel containing approximately 3–4 wt% Cu and is widely used in applications requiring high strength and modest level of corrosion resistance. This steel is used in different heat treated conditions to achieve the desired strength and toughness. Mostly, 17-4 PH stainless steel is used as the structural material in nuclear, aerospace, naval, and chemical industries where high strength, toughness, wear resistance, good fabrication characteristics, and corrosion resistance are essential.
The microstructure of the solution annealed (SA) 17-4 PH SS is found to have parallel lath martensites, having a high dislocation density. Reference Viswanathan, Nayar and Krishnan1 The age hardening behavior of 17-4 PH steel has been studied extensively by various authors by using different analytical techniques. Reference Viswanathan, Banerjee and Krishnan2–Reference Mahadevan, Manojkumar, Jayakumar, Das and Rao6 The precipitation of highly dispersed nano size copper particles in the martensite matrix leads to an increase in the microstrain, which in turn leads to an increase in strength of the material. The earlier studies on thermally aged 17-4 PH SS by TEM, atom ion probe microscopy, electrical resistivity, and hardness show evidence of copper precipitation, but prolonged aging leads to coarsening of the precipitates. From changes in resistivity, Viswanathan et al. Reference Viswanathan, Nayar and Krishnan1 inferred that there is no incubation period for the formation of precipitates, and the sequence of precipitation is similar to that of Fe–Cu binary alloys. Rearrangement of dislocations within martensite laths was found in samples aged at a temperature of 510 °C for 0.5 h. Reference Viswanathan, Banerjee and Krishnan2 The high-temperature aging studies on 17-4 PH steel revealed the formation of the austenite phase even at shorter durations, and the austenite phases were observed by different authors at 580 °C for 0.25 h, Reference Bhambroo, Roychowdhury, Kain and Raja5 above an aging temperature of 599 °C for 1 h Reference Viswanathan, Nayar and Krishnan1 and at 620 °C for 4 h. Reference Hsiao, Chiou and Yang7
While the microstrain increases due to coherent precipitation, it decreases due to dislocation annihilation during heat treatment. XRD profiles broaden due to increase in coherency strains and reduction in the crystallite size. The increase in microstrain due to precipitation and its decrease in the incoherent regime have been estimated to study the aging behavior. Reference Mahadevan, Manojkumar, Jayakumar, Das and Rao6 In ferritic-martensitic EK-181 steel, the dislocation density is decreased by an order on annealing at 720 °C for 3 h. These changes were studied using different XRD analytical methods. Reference Vershinina and Leont’eva-Smirnova8
Different approaches of X-ray diffraction line profile analysis (XRDLPA) are available to separate the contributions of crystallite size and microstrain to profile broadening. The methods are Warren–Averbach (WA) method which is based on Fourier analysis of peak profiles Reference Warren and Averbach9 and Williamson–Hall (WH) method which is based on the angular dependency of size and strain broadening. Reference Williamson and Hall10 While evaluation of the microstrain by analysis of peak breadth provides information which is averaged over all column lengths perpendicular to the diffracting planes, the Fourier method reveals the dependency of strain on the column length. Reference Nandhi, Kuo, Schlosberg, Wissler, Cohen and Crist11 Ungár and Borbély Reference Ungár and Borbély12 addressed the anisotropic broadening using the contrast caused by dislocations and proposed the modified WH method (mWH) for estimating the normalised root mean square strain. Stephens proposed a phenomenological model Reference Stephens13 to address the anisotropic broadening, and the corresponding anisotropic strain parameters are obtained from the metric parameters which are dependent on interplanar spacing. The Rietveld refinement tool developed by Birkenstock et al. Reference Birkenstock, Fischer and Messner14 uses the phenomenological model and gives the anisotropic strain parameters.
Earlier studies on the aging behavior of 17-4 PH steel and M250 grade maraging steel revealed an increase in the microstrain due to precipitation. Reference Mahadevan, Manojkumar, Jayakumar, Das and Rao6,Reference Mahadevan, Jayakumar, Rao, Kumar, Rajkumar and Raj15 Both these studies were carried out using XRDLPA based on the contrast caused by dislocations to strain broadening as proposed by Ungar et al. Reference Ungár and Borbély12 However, in both the steels, the influence of dislocation annihilation on the microstrain has not been thoroughly addressed. As the evaluated microstrain has a contribution from coherent precipitates and dislocations which annihilate on aging, it would be beneficial to separate these contributions. Hence, to understand the effectiveness of the dislocation-based model Reference Ungár and Borbély12 to the strain broadening caused by precipitate-induced effects, further analysis of the results is carried out. In this study, we try to distinguish the effects of precipitation and dislocation annihilation on the microstrain which occurs simultaneously. Toward this objective, the microstrain estimated based on the modified WH method, Fourier analysis of XRD profiles, and the Stephens phenomenological model is compared and discussed.
II. THEORETICAL APPROACH
The theoretical basis of the different analytical methods (Fourier method of Warren–Averbach, Reference Warren and Averbach9 modified Williamson–Hall method, Reference Ungár and Borbély12 and Stephens model Reference Stephens13 ) used in this study for separation of size and strain broadening are briefed below:
A. Fourier analysis of isotropically broadened profiles
The Fourier coefficients of individual peak profiles were obtained, and the influence of crystallite size and lattice microstrain are separated by implementing the Fourier transformation based Warren–Averbach method using Eq. (1)
 $$\ln A(L) = \ln \left( {{A^{\rm{S}}}\left( L \right)} \right) - {{2{\pi ^2}\left\langle {{\varepsilon ^2}\left( L \right)} \right\rangle {L^2}} / {{d_{hkl}}^2}}\quad ,$$
where A(L) is the real Fourier coefficient, A S(L) is the size coefficient, and 〈ε2(L)〉 is the mean square of the strain component perpendicular to the reflecting planes averaged over the column length L. The logarithm of Fourier coefficients (ln A(L)) is plotted with 1/d hkl 2 (d hkl —spacing between hkl planes) at different column lengths, L, and from the slope, the mean-squared strain 〈ε2(L)〉 for different column lengths is determined. The intercept of this plot gives the particle size coefficients. From the plot of A S(L) versus L at lower column lengths, the area-weighted average column length L S can be obtained.
B. Dependence of microstrain on column length
The variation of 〈ε2(L)〉 has been analyzed by various authors. According to Rothman and Cohen, Reference Rothman and Cohen16 the mean squared strain due to dislocations follows an inverse relation with the column length and is given as
 $$\left\langle {{\varepsilon ^2}\left( L \right)} \right\rangle \propto {1 \over L}\quad .$$
However, Wilkens Reference Wilkens17 derived the mean squared strain caused by dislocations for small values of L and is given as
 $$\left\langle {{\varepsilon ^2}\left( L \right)} \right\rangle \propto \ln \left( {{{{R_{\rm{e}}}} / L}} \right)\quad ,$$
where R e is the effective outer cut-off radius which depends on the dislocation density and its distribution. Balzar and Ledbetter Reference Balzar and Ledbetter18 derived a relation (Eq. 19 of Ref.) for the strain 〈ε2(L)〉 from the Gaussian (βDG) and Cauchy (βDC) components of broadening due to distortion and their relationship can be written of the form
 $$\left\langle {{\varepsilon ^2}\left( L \right)} \right\rangle = {P_0} + {{{P_1}} \over L}\quad .$$
The parameter P 0 and P 1 are proportional to βDG 2 and βDC, respectively. Van Berkum et al. Reference Van Berkum, Vermeulen, Delhez, De Keijser and Mittemeijer19 have expanded the Fourier coefficients of distortion in the power series of the even order of L.
Expanding the logarithmic expression into Taylor series and limiting the same to second order term, Eq. (2b) is proposed and is given as
 $$\left\langle {{\varepsilon ^2}\left( L \right)} \right\rangle = {P_0} + {{{P_1}} \over L} + {{{P_2}} \over {{L^2}}}\quad .$$
In this study, an attempt is made to estimate the above three parameters by least square refinement and to correlate the same with the strain estimated from other methods.
C. Modified Williamson–Hall method
The modified Williamson–Hall method proposed by Ungár and Borbély Reference Ungár and Borbély12 suggests that full width half maxima (FWHM) of the diffraction profiles can be written as a sum of the size component and strain component and is based on the contrast caused by dislocations. Herein, the variation of FWHM (βF) with the diffraction angle is given by
 $${\beta _{\rm{F}}}^ * = {1 / D} + \alpha \left( {K{{\bar{C}}^{1{\rm{/}}2}}} \right) + O\left( {{K^2}\bar{C}} \right)\quad ,$$
where D is related to the average grain or particle size,
 ${\beta _{\rm{F}}}^ * = {{{\beta _{\rm{F}}}\cos \theta } / \lambda }$
and K = 2 sin θ/λ, where 2θ denotes the diffraction angle and λ denotes the wave length of the X-ray beam, α = (πA
2
b
2/2)1/2ρ1/2 is called the hkl independent or normalised root mean square strain, and Ο indicates the noninterpreted higher-order terms. The variable A is a constant depending on the effective outer cut-off radius of dislocations (R
e), b is the Burgers vector, ρ is the dislocation density, and
 $\bar{C}$
is the average contrast factor of the dislocations given by
 ${\bar{C}_{hkl}} = {\bar{C}_{h00}}\left( {1 - q{H^2}} \right)$
, where H
2 = (h
2
k
2 + k
2
l
2 + l
2
h
2)/(h
2 + k
2 + l
2)2; q and
 ${\bar{C}_{h00}}$
depend on elastic constants of the material.
D. Stephens phenomenological model
In the phenomenological model proposed by Stephens, Reference Stephens13 the anisotropic peak broadening of diffraction profiles is taken into account, and the corresponding anisotropic strain is obtained as discussed below. The lattice spacing d between planes with miller indices hkl is given by
 $${1 / {{d^2}}} = {M_{hkl}} = A{h^2} + B{K^2} + C{l^2} + Dkl + Ehl + Fhk\quad ,$$
where A, B, C, D, E, and F are the metric parameters of the reciprocal lattice. Considering that the strain broadening causes a distribution of these metric parameters, the variance of M hkl can be determined.
According to this model, the anisotropic broadening contribution to the anisotropic strain for each hkl plane is
 $${\delta _{hkl}} = {{\delta d} \over d} = {{\pi {{\left[ {{\sigma ^2}\left( {{M_{hkl}}} \right)} \right]}^{{1 \over 2}}}} \over {\left( {180{M_{hkl}}} \right)}}\quad ,$$
where the variance of M hkl is stated as
 $${\sigma ^2}\left( {{M_{hkl}}} \right) = \sum\limits_{HKL} {{S_{HKL}}{h^H}{k^K}{l^L}} \quad ,$$
and S ABC are the anisotropic strain parameters defined for H + K + L = 4. For the cubic system S 400 = S 040 = S 004, S 220 = S 202 = S 022 and the values of other S HKL are zero. From the two values of S 400 and S 220, the strain along each of the hkl directions can be estimated.
III. EXPERIMENTAL
17-4 PH steel specimens were SA at 1040 °C for one hour and heat treated isothermally at different temperatures for different durations and then air cooled. The isothermal aging temperatures are 430 and 480 °C for durations of 0.5, 1, and 3 h. To understand the dislocation annihilation effects, aging was carried out at a lower temperature of 380 °C for 0.5 and 1 h, as this temperature regime is expected to be dominated by dislocation annihilation effects, and precipitation-induced effects would be minimal.
XRD measurements were carried out in a MAC Science X-ray diffractometer. The instrumental broadening is obtained from the standard sample of LaB6 which is accounted by using the code SHADOW Reference Howard and Snyder20 and XPRESS. The individual profiles corresponding to all the matrix peaks were fitted with the pseudo-Voigt function by considering the Kα2 component. This refinement gave the parameters of the pseudo-Voigt function like peak position, FWHM, and Gauss content of these peaks. Rietveld refinement of all the diffraction profiles from the aged specimens of 17-4 PH steel was done using the BRASS code. Reference Birkenstock, Fischer and Messner14 The refinement gives the anisotropic parameters S 400 and S 220 which are used for further analysis.
IV. RESULTS AND DISCUSSION
A. Profile refinement
The powder patterns of all the 17-4 PH SS specimens were obtained in the range of 2θ (33°–122°) using the procedures given earlier. Figure 1 shows the profile as open circles along with the fit obtained from the BRASS code for the solution-annealed (SA) specimen, along with specimens further aged for 0.5 and 1 h at 480 °C. The goodness of fit (GOF) parameter calculated from the BRASS code for each of these profiles is shown in Fig. 1. The GOF parameter calculated for all the other specimens (discussed in Sec. III) fall within the range of 1.78–2.79, with only the 480 °C, 0.5 h specimen giving a value of 3.25. The SA specimen showed peaks corresponding to reflections from the bcc structure, and the reflections are indexed in the figure as (110), (200), (211), (220), and (310). Additional peaks observed in aged specimens indicate the formation of an FCC phase, which are indexed in the figure and the legend SA corresponds to the SA specimen.
X-ray diffraction data (open circles) and the profile fit (black solid line) obtained from the BRASS code for 17-4 PH Steel specimens.

B. Fourier method
The Fourier method is based on the classical WA approach in which the two ordered peaks of the bcc matrix (110) and (220) are considered for the evaluation of strain and crystallite size. The results, thus obtained would give the strain as a function of the column length along the (110) direction. Hence, the Fourier method using the isotropically broadened profiles with peaks corresponding to (110), (211), and (220) (which have a H 2 value of 0.25) will provide the mean squared strain that can be compared with other methods briefed in Sec. II. The profiles fitted with the pseudo-Voigt peak function are used for the Fourier analysis which will aid when the tail regions are superimposed with peaks from precipitates that are below detection (peak separation) limits. A methodology based on using the pseudo-Voigt function has been proposed by Enzo et al. Reference Enzo, Fagherazzi, Bendetti and Polizzi21 More recently, Bajo et al. Reference Sanchez-Bajo, Ortiz and Cumbrera22 fitted a pseudo-Voigt function to a single XRD peak to study the grain size distribution of nanocrystalline materials. In our refinements, the Cauchy content was above 0.328, and this value is considered adequate for size-strain separation. Reference Prabal23
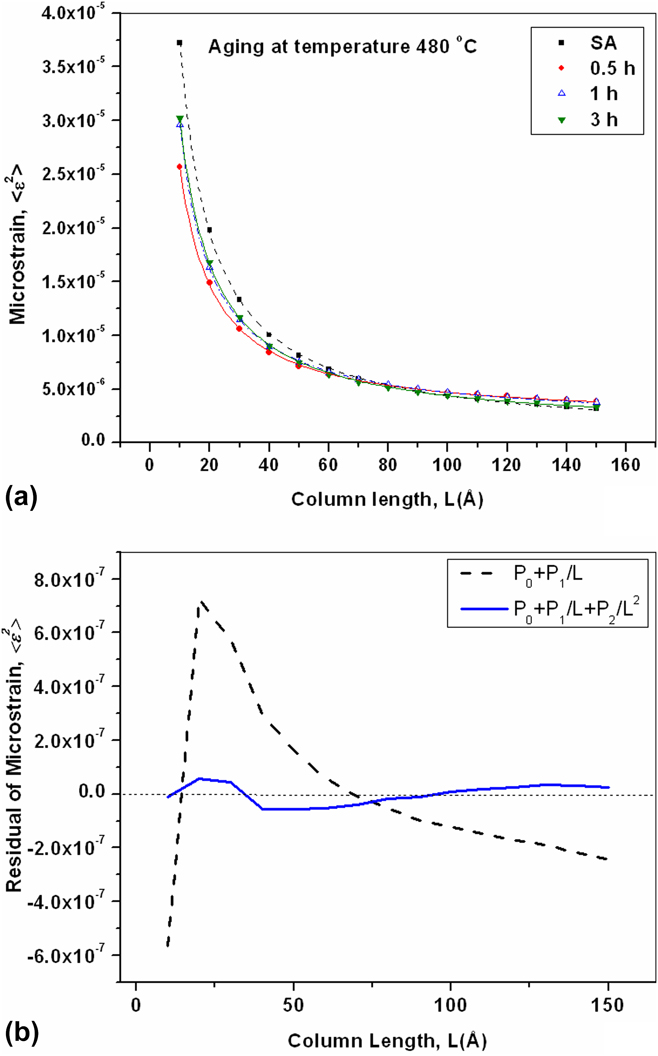
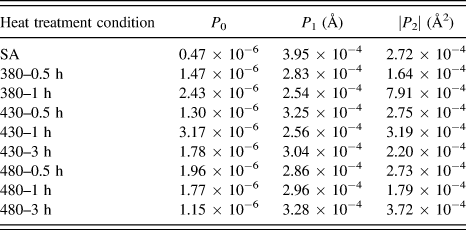
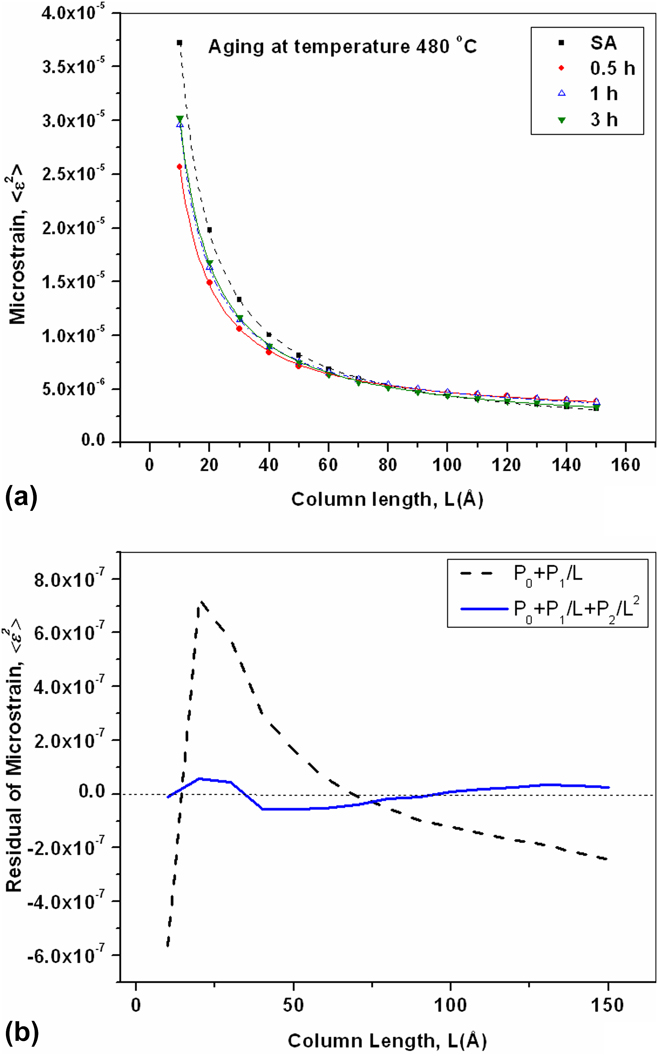
The variation of 〈ε2(L)〉 obtained from Eq. (1) as a function of the column length L, along with the fits obtained based on Eq. (3) is shown in Fig. 2(a) for the SA specimen and three isothermally aged (480 °C, 0.5, 1, and 3 h) specimens. Figure 2(b) shows the difference plot (residual) between the estimated strain and the fitted strain using Eqs. (2c) and (3) as dotted and continuous lines, respectively, for the SA sample. It is clear that the residual of the microstrain is small when the additional term (P 2) is considered, which improves the fit. The parameters P 0, P 1, and P 2 have been determined by least square refinement and are tabulated in Table I for all aging durations. The observed changes in these parameters (P 0 and P 1) with aging will be presented, and its variation with the precipitation and dislocations will be discussed in the following sections. The parameter P 2 is further a function of L/R e Reference Ribárik, Ungár and Gubicza24 and hence its variation with aging has not been considered in this study.
The values of P 0, P 1, and P 2 parameters for SA and aged specimen under study are given below.

C. The microstrain α determined from mWH method and its equivalence with P 0
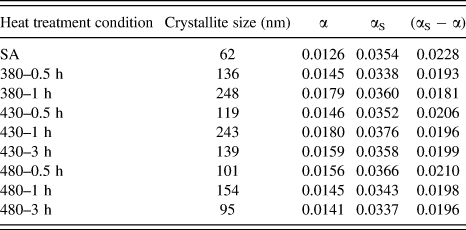
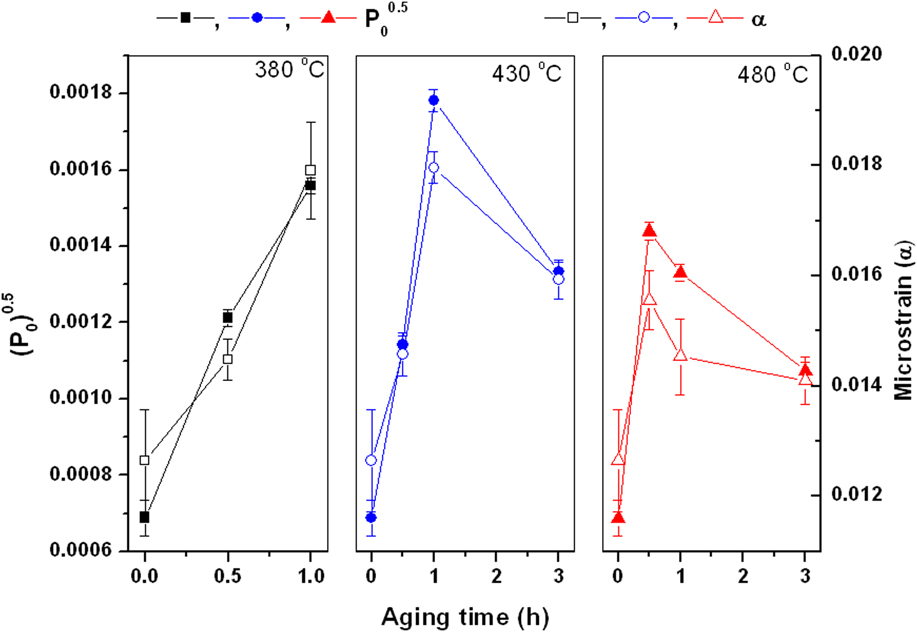
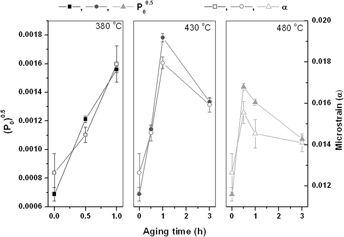
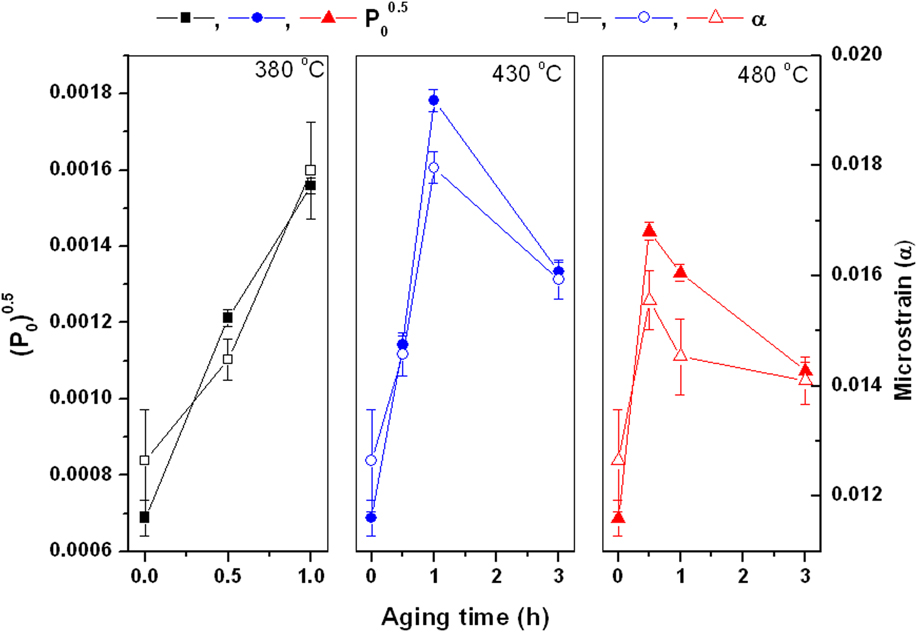
The FWHM values obtained from the profile analysis were used in the modified Williamson–Hall method based on Eq. (4) for estimating the crystallite size and normalised root mean square strain (α) and are shown in Table II. Since P 0 has been derived from the mean squared strain 〈ε2(L)〉, for comparison with the microstrain (α) estimated by the mWH method, (P 0)0.5 is analyzed. Figure 3 shows the variation of (P 0)0.5 and α with aging duration as solid and open symbols for temperatures of 380, 430, and 480 °C as squares, circles, and triangles, respectively. From Fig. 3, it is observed that the SA specimen has the lowest (P 0)0.5 value. Upon aging at 380 °C, it is observed that (P 0)0.5 increases up to the aging duration considered in the study. On aging at 430 and 480 °C, (P 0)0.5 increases up to 1 and 0.5 h, respectively, and beyond which (P 0)0.5 decreases. The variation of α with the aging duration (open symbols) shows a similar trend as observed for P 0. It is to be noted that the P 0 value corresponds to the strain at longer column lengths, which in diffraction profiles corresponds to regions in the neighborhood of FWHM of the diffracted peaks. Hence, it is valid to use the parameter P 0 for studying the precipitation-induced effects. However, it is noted that when the dislocation density is high, the microstrain would extend to longer column lengths, and the dislocation contribution to P 0 cannot be ruled out. Hence, the changes in the microstrain α determined from FWHM using the mWH method Reference Mahadevan, Manojkumar, Jayakumar, Das and Rao6 are similar to those of the long-range strain parameter, P 0.
The values of crystallite size, α, and αS for solution annealed and aged specimen under study are given below.

Variation of the parameter (P 0)0.5 obtained from the column length distribution of strain using Fourier method and normalised root mean square strain (α) determined from Eq. (4).
D. Comparison of P 1 estimated from Fourier method with dislocation density (ρ)
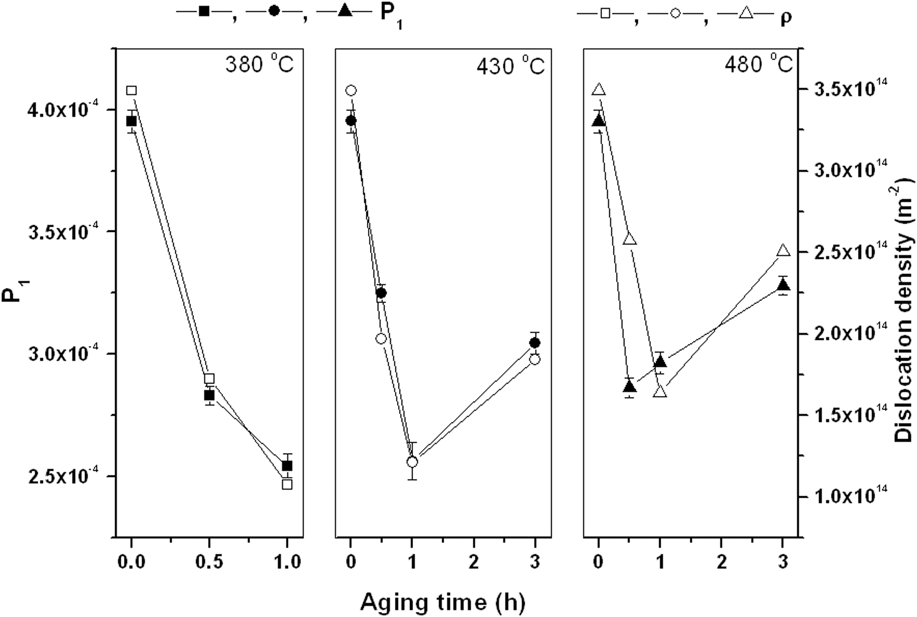
The variation of the parameter P 1 as a function of the aging duration for the temperatures 380, 430, and 480 °C is shown in Fig. 4 as solid squares, circles, and triangles, respectively. It is clear from the figure that the parameter P 1 decreases on aging up to 1 h for all three isothermal conditions. Since precipitation causes an increase in microstrain due to aging (as shown in Sec. IV.C), the observed decrease in the value of the parameter P 1 has been analyzed based on its dependency with the dislocation density. It is well known that the strain fields of dislocations decay as a function of 1/L. The approach of Williamson and Smallman Reference Williamson and Smallman25 is used to determine the dislocation density. The average dislocation density ρ is given by (ρS × ρD)0.5, where ρD and ρS denote the contributions from the crystallite size and strain, respectively. ρD is estimated from 3/D 2 and ρS from 4〈ε2〉/b 2, where D is the crystallite size and b is the Burgers vector. The variation of dislocation density, ρ, as a function of the aging duration is shown in Fig. 4 with open symbols for different aging temperatures. The variation of parameters P 1 and dislocation density, ρ, with aging shows similar behavior which is in accordance with the 1/L dependency of the mean squared strain 〈ε2(L)〉 due to dislocations. Reference Wilkens17
Variation of the parameter P 1 obtained from the column length distribution of strain using Fourier method and of dislocation density ρ determined from Williamson–Smallman approach.

E. Microstrain estimation based on the Stephens model
The strain parameters S 220 and S 400 as discussed in Sec. II.D were obtained from the BRASS Reference Birkenstock, Fischer and Messner14 code. According to Stephen’s anisotropic model, the strain (δ hkl ) component along each of the planes is calculated as per Eq. (5). In this model, the normalised root mean square strain (αS) was calculated from the strains along each of the planes as per the following equation
 $${\alpha _{\rm{S}}} = \sqrt {{{\sum {{\delta _{hkl}}^2} } \over n}} \quad ,$$
where n is the number of peaks and herein the five peaks (110), (200), (211), (220), and (310) were considered. The variations of αS derived from the whole profile analysis (Stephens model) includes the tail regions, which is affected by dislocations and precipitate-induced effects. The microstrain αS estimated using the Stephens model for all aging durations at temperatures 380, 430, and 480 °C is tabulated in Table II.
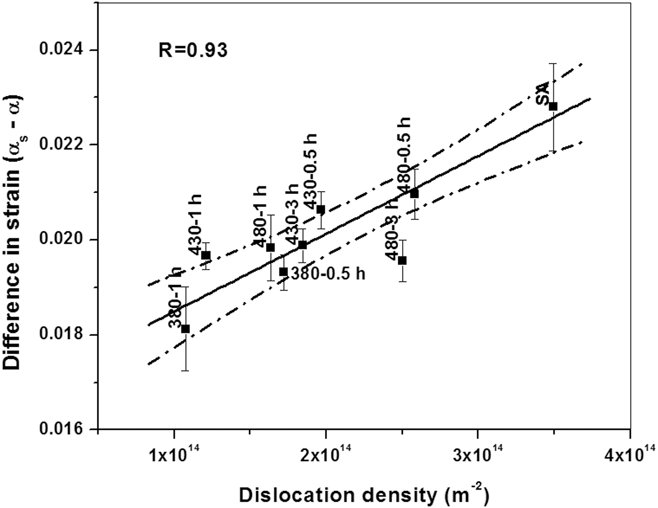
During initial aging at 380 and 430 °C for 0.5 h, the microstrain, αS, decreased which indicates that the decrease in microstrain due to dislocation annihilation is much larger than the increase in coherency strains due to precipitation. However, at all aging temperatures, the peak value of αS and α was observed at similar aging durations. This is attributed to the increased contribution of the precipitation-induced strain to the increase in αS. At higher aging durations (3 h), αS is found to decrease, which is similar to the behavior observed by α. This is attributed to the fact that precipitates become incoherent at larger aging durations. The different behaviors of the microstrain α and αS are explained as follows: while changes in α are dominated by the precipitate-induced effects, changes in αS are influenced by precipitates and dislocations. Hence, the difference ∆αd = (αS − α) between the microstrain, αS, estimated from the integral breadth (based on Stephens model) and α estimated from FWHM (mWH method) is a measure of the changes in the tail region of the XRD profiles. The difference ∆αd (tabulated in Table II) has been plotted with respect to the dislocation density in Fig. 5. The figure also shows the linear fit obtained between these two parameters with 95% upper and lower confidence limits to the fit.
The variation of differences in the microstrain (αS − α) of Stephens model and mWH method with respect to dislocation density ρ.

F. Discussion
The variation of α, (P 0)0.5, P 1, and ρ with aging duration is analyzed for understanding the microstructural changes that take place in 17-4 PH steel. The microstrain 〈ε2(L)〉 determined from the Fourier analysis as a function of the column length is a summation of three terms with one being independent and the other two being dependent on column lengths.
The observed variation in (P 0)0.5 and α, as shown in Fig. 3, reflects that during initial aging, coherent precipitation increases the strain in the matrix, and at larger aging durations, coarsening of the precipitates leads to a loss in coherency between the matrix and precipitate, thereby reducing the microstrain. The similar behavior of (P 0)0.5 and α indicates that the newly derived parameter (P 0) is sensitive to the precipitation-induced behavior. Hurley et al. Reference Hurley, Balzar and Purtscher26 had correlated the strain estimated using the double-Voigt method with coherency strains in ASTM A710 low-alloy steel. The estimated strain decreases when the Cu precipitates become incoherent on aging for longer durations. An earlier study carried out on the aging behavior of 17-4 PH steel had shown that the microstrain (α) can be used to infer early precipitation despite its decrease expected due to dislocation annihilation. Reference Mahadevan, Manojkumar, Jayakumar, Das and Rao6
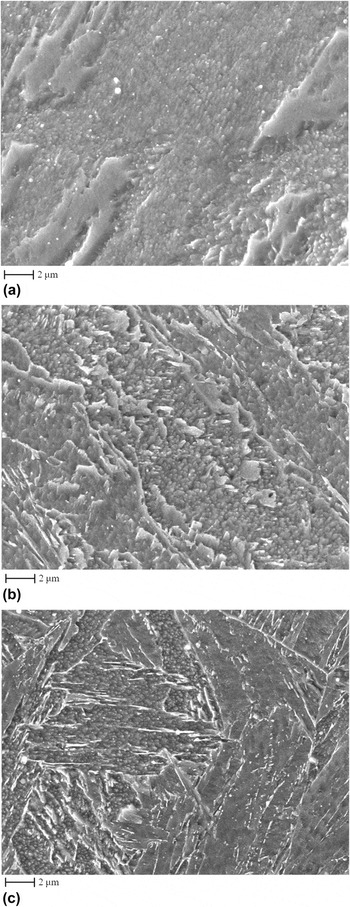
Figure 4 clearly shows that P 1 and ρ decrease on initial aging at all three temperatures considered in this study. It is clear that the dislocation annihilation behavior can be studied by the parameter estimated from the modified strain function [Eq. (3)]. The observed sensitivity of P 1 to the dislocation density stems from the fact that the mean squared strain 〈ε2(L)〉 is a function of ρ. Reference Wilkens17,Reference Ribárik, Ungár and Gubicza24 The increase in parameter P 1 and ρ on increasing the aging duration from 1 to 3 h (Fig. 4) is attributed to the formation of misfit dislocations when the precipitates grow and become semicoherent. Reference Martin27 The growth of precipitates at this aging duration (3 h) is corroborated by the decrease in microstrain (α) as shown in Fig. 3. Formation of misfit dislocations would influence the matrix and cause changes in the substructure. Hence, to confirm these findings, microstructures of the specimens were obtained. Figures 6(a)–6(c) show the microstructure of the SA sample and samples aged for 3 h at 430 and 480 °C. Figure 6(a) shows a typical martensitic structure with a fine substructure, which is indicative of a higher dislocation density. The 3 h-aged samples show an increase in substructure size as compared to the SA sample. These findings are in line with the changes in crystallite size (refer Table II) of the SA sample from 62 nm to 139 and 95 nm for 430 °C and 480 °C aged (for 3 h) samples. The substructural refinement that occurs after reaching a peak crystallite size of 243 nm (430 °C–1 h) and 154 nm (480 °C–1 h) on further aging (to 3 h) is attributed to sub-boundary pinning by dislocations and due to misfit dislocations. Reference Ghosh, Haldar and Chattopadhyay28 Huang et al. studied the effect of fine preexisting dispersoids on precipitation and found that these dispersoids influence the size of the matrix crystals by providing a pinning effect. Reference Huang, Qinglong, Yanjun and Knut29
SEM micrographs of (a) SA, (b) aged at 430 °C for 3 h, and (c) aged at 480 °C for 3 h samples.

The microstrain, αS, obtained from the whole profile analysis (Stephens model) includes the tail regions and is predominantly affected by the precipitation and dislocation effects. By subtracting the microstrain α due to precipitation-induced effects as determined from the FWHM-based analysis, the difference in microstrain (αS − α) is indicative of dislocation-induced effects. The observed linear fit between dislocation density (ρ) and (∆αd) as shown in Fig. 5 indicates that an integral breadth and FWHM-based analysis can be used for understanding the changes in the dislocation density. Herein, the SA sample has the highest dislocation density and the highest difference (∆αd) in microstrain as compared to all other specimens, which is consistent with the known behavior of this material. All the other samples have ∆αd values smaller than those of the SA sample, indicating the reduction in strain due to aging-induced annihilation of dislocations.
V. CONCLUSIONS
The aging behavior of 17-4 PH stainless steel has been studied using various XRDLPA methods. The results from various methods are analyzed based on the microstructural changes (precipitation and dislocation annihilation which occur simultaneously) that take place in this material, and the following conclusions are drawn.
-
(1) The term P 0, estimated from strain as a function of the column length, indicates the long-range strain fields and is correlated with the strain determined from the mWH method [using Eq. (4) with FWHM]. This strain is attributed to precipitate induced effects.
-
(2) The term P 1, which is linked to the 1/L dependency of the strain as a function of column length, shows a good correlation with variation in dislocation density.
-
(3) The difference in microstrain (∆αd) between the strain estimated by Stephens model and the mWH method shows a linear behavior with the dislocation density.
-
(4) The above analysis clearly shows that the line profile analysis using various methods can be effectively used to distinguish the precipitation- and dislocation-induced changes that take place simultaneously during the aging of 17-4 PH steel.
To validate the above approach, it would be beneficial to study the precipitation and strain hardening behavior of different materials using different XRDLPA methods.
ACKNOWLEDGMENTS
The authors thank Dr. C.R. Das, Metallurgy and Materials Group (MMG), for his help in acquiring the micrographs. The authors express their gratitude to Dr. T. Jayakumar, former Director, MMG, Indira Gandhi Center for Atomic Research (IGCAR) presently Visiting Professor, NIT, Warangal for many fruitful discussions during the course of the present study. The authors would also like to thank Dr. G. Amarendra, Director, MMG, IGCAR and Dr. A.K. Bhaduri, Director, IGCAR for their constant encouragement and support.