Nomenclature
-
 $\mu,\lambda$
-
Lamé’s parameters
-
$\nu$
-
Poisson’s ratio
-
$\rho$
-
Density
-
$u$
-
Longitudinal displacement
-
$v$
-
Transverse displacement
-
$A,B,C,D$
-
Arbitrary constants
-
$p,q$
-
Dispersive wavenumbers
-
$k$
-
Wavenumber
-
$\omega$
-
Circular frequency
-
$f$
-
Linear frequency
-
$c_L$
-
Longitudinal wave velocity of the bulk material
-
$c_T$
-
Transverse wave velocity of the bulk material
-
$E$
-
Young’s modulus
-
$c_g$
-
Group velocity
-
$c_p$
-
Phase velocity
-
$\phi$
-
Phase
-
$T$
-
Temperature
-
$\alpha$
-
Coefficient of thermal expansion
-
$Q_{ij}$
-
Stiffness coefficients along the ply axis
-
${{A}_{ij}}^{\!\!\!\ast}$
-
In plane stiffness terms


1.0 Introduction
Non-destructive testing (NDT) has been around for over 100 years, with one of the very first applications being in the railroad industry [Reference Farley1]. The 1970s significantly changed the field of NDT with the emergence of the discipline of fracture mechanics [Reference Farley1]. This enabled the prediction of whether a crack of a given size would fail under a given load if the relevant material property or fracture toughness was known. Laws to predict the rate of growth of cracks under cyclic loading were also developed. With these laws, it became possible to use structures with known defects, if the sizes of the defects were known [Reference Bond2]. That is, design incorporated a new approach, and they became “damage tolerant designs” [Reference Grandt3]. Components with known defects could be used as long as the defects did not grow past a critical limit, which could result in a catastrophic failure. This presented a new challenge for NDT, ‘simple’ detection of flaws was no longer enough, quantitative information was needed about the size of flaws to enable predictions of the component’s residual life. That is, non-destructive evaluation (NDE) [Reference Farley1, Reference Pollock, O’Byrne and Wild4].
Structural Health Monitoring (SHM) is an emerging area which brings together NDE with smart technologies and materials [Reference Staszewski, Boller and Tomlinson5]. The drive for SHM in the aerospace industry lies with the need to improve safety, for both aerospace manufacturers and operators. Maintenance activities can account for as much as 20% of the direct operating costs, and human error in maintenance contributes to 15% of all aircraft accidents [Reference Staszewski, Boller and Tomlinson5]. Beyond that, reliable SHM would allow for less conservative design philosophies to be used, leading to significant weight savings on future aircraft whilst improving the safety of passengers. The rapid advances that have been made in recent decades in sensor technology, smart materials and innovative structural concepts are leading to the practical use of SHM. One such area is the use of ultrasonic guided waves [Reference Giurgiutiu6, Reference Pollock and Wild7], a direct evolution of traditional ultrasonic NDT.
Simulation of ultrasonic guided wave-based NDT and NDE for SHM is onerous [Reference Giurgiutiu6]. While the use of finite element analysis (FEA) has become more common [Reference Rajagopal, Drozdz and Lowe8], there are limitations and issues with such a method. Specifically, FEA can be computationally intensive [Reference Gresil, Shen and Giurgiutiu9]. Reducing computational effort is essential for airframe digital twins [Reference Tuegel10, Reference Glaessgen and Stargel11], especially if an intelligent digital twin is used onboard, in flight [Reference Li, Aslam, Wileman and Perinpanayagam12]. In this work, a simple numerical model for guided wave propagation in 2D plate structures is presented. These structures made specifically of aluminium alloys are representative of those used to skin aircraft [Reference Yandouzi, Gaydos, Guo, Ghelichi and Jodoin13, Reference Starke and Staley14].
2.0 The numerical model
The original analysis of guided waves in thin plates was published by Lamb in 1917 [Reference Lamb15] and derives itself from an interrogation of the elastodynamic Navier-Cauchy equations for isotropic materials [Reference Rose16].
 \begin{align}\mu {v_{i,jj}} + ( {\lambda + \mu } ){v_{j,ji}} + \rho {f_i} = \rho {\ddot v_l}\end{align}
The geometry is simple, the thin plate is a solid medium which is bounded on the top and bottom by parallel planes which are a distance
 $\;2h$
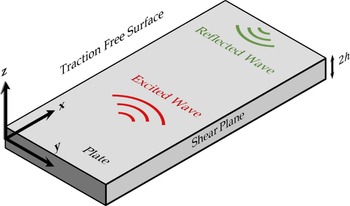
apart, as depicted in Fig. 1 [Reference Worden17]. In the horizontal distance within the plate, the dimensions are unbounded, and it is also assumed that there is no medium outside the upper and lower bounds of the solid plate. In a bulk solid medium, mechanical waves can propagate as longitudinal (pressure) waves, or as lateral (shear) waves. In a plate, the close nature of bounding planes results in a mixing of these types of waves, and interestingly results in the production of two unique propagation modes. These are the symmetric wave which is an even function of the displacement of the medium in
 $z$
, where
 $u( z ) = u( { - z} )$
, and the antisymmetric wave, which is an odd function of the displacement of the medium in
 $z$
, where
 $ - u( z ) = u( { - z} )$
(17). The longitudinal component of the displacement
 $u$
and a transverse component
 $w$
have the form,
 \begin{align}u = i( {kA\cos ( {pz} ) + qB\cos ( {qz} )} ){e^{ik( {x - ct} )}}\end{align}
 \begin{align}w = ( { - pA\sin ( {pz} ) - kB\sin ( {qz} )} ){e^{ik( {x - ct} )}}\end{align}
for symmetric modes, and
 \begin{align}u = i( {kC\sin ( {pz} ) - qD\sin ( {qz} )} ){e^{ik( {x - ct} )}}\end{align}
 \begin{align}w = ( {pC\cos ( {pz} ) - kD\cos ( {qz} )} ){e^{ik( {x - ct} )}}\end{align}
for antisymmetric modes. While A, B, C and D are arbitrary constants, the coefficients
 $p$
and
 $q$
represent the dispersive wavenumbers, and are given by,
 \begin{align}{p^2} = {{{\omega ^2}} \over {c_L^2}} - {k^2}\end{align}
 \begin{align} {{q^2} = {{{\omega ^2}} \over {c_T^2}} - {k^2}} \end{align}
where
 $\omega $
is the circular frequency of the wave,
 $k$
is the wavenumber determined by the phase velocity of the wave at
 $\omega $
,
 ${c_L}$
is the longitudinal wave velocity of the bulk material and
 ${c_T}$
is the transverse wave velocity of the bulk material.
 \begin{align} {{c_L} = \sqrt {{{\lambda + 2\mu } \over \rho }} } \end{align}
 \begin{align} {{c_T} = \sqrt {{\mu \over \rho }} } \end{align}
The general setup and co-ordinate system for a guided Lamb wave.

The variables
 $\lambda $
and
 $\mu $
represent the Lamé constants as given below [Reference Giurgiutiu18].
 \begin{align} {\lambda = {{E\nu } \over {( {1 + \nu } )( {1 - 2\nu } )}}} \end{align}
 \begin{align} {\mu = {E \over {2( {1 + \nu } )}}} \end{align}
The boundary conditions are that
 ${t_{xz}} = {s_{zz}} = 0$
on
 $z = \pm h$
[Reference Graff19]. The result of imposing these boundary conditions is that Equations (1.1) to (2.2) only have nontrivial solutions if,
 \begin{align} {{{\tan ( {qh} )} \over {\tan ( ph )}} = - {{4{k^2}pq} \over {{{( {{q^2} - {k^2}} )}^2}}}} \end{align}
 \begin{align} {{{\tan ( ph )} \over {\tan ( qh )}} = - {{4{k^2}pq} \over {{{( {{q^2} - {k^2}} )}^2}}}} \end{align}
for the symmetric and antisymmetric modes, respectively [Reference Graff19].
The important result is that Lamb waves are dispersive, given the velocity depends on the product of
 $h$
and
 $\omega $
, or the frequency-thickness product. That is, any arbitrary wave, which based on Fourier’s theorem can be described as the sum of many sinusoidal waves, will experience dispersion, as well as generating two wave modes that travel independently of each other. The group velocity given as
 ${c_g} = {{d\omega } \over {dk}}$
can be related to the phase velocity through Equation (7).
 \begin{align} {{c_g} = c_p^2{{\left[ {{c_p} - ( fh ){{d{c_p}} \over {d( fh )}}} \right]}^{ - 1}}} \end{align}
Where
 $fh$
represents the frequency-thickness product of the case. The frequency-thickness product is often used as the independent variable as it allows for calculation of the phase velocity independent of the thickness of the plate. Modelling the propagation of an ultrasonic guided wave in a plate structure can be achieved using the previously stated fact. Any signal is a sum of sinusoidal waves. Each sinusoidal wave will have a velocity dictated by the dispersive relationship, which is a function of the material properties and the plate thickness. Consider a typical Gaussian apodised sinusoidal signal,
 \begin{align} {f(t) = ( {A\cos ( {\omega t} )} ){e^{{\raise0.7ex\hbox{${{t^2}}$} \!\mathord{\left/ {\vphantom {{{t^2}} {2{c^2}}}}\right.} \!\lower0.7ex\hbox{${2{c^2}}$}}}}} \end{align}
The Fourier transform of this signal will be a Gaussian distribution of frequencies about the central frequency,
 $\omega $
[Reference Bracewell and Bracewell20]. Rather than defining analytically what the Fourier transform of (8) is, a discrete numerical approximation of the function can be defined with a set sampling rate. The fast Fourier transform (FFT) of this discrete signal will then provide the phase and amplitude information for all the sinusoids that sum together to form this signal. In the frequency domain, the spacing of these constituent signals (
 $df$
) is derived from the sampling rate (
 $1/dt$
) and the total number of samples (
 $n$
), such that,
 \begin{align} {\Delta f = {1 \over {n{\rm{\Delta }}t}}} \end{align}
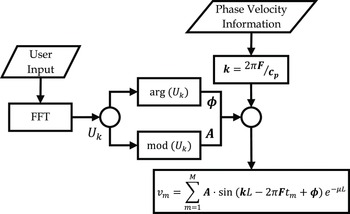
Knowing each frequency, the dispersion for each can be determined. There are two options, root finding algorithms can be used for Equations (6.1) and (6.2) to determine the valid wave speed at each frequency, or a lookup table for the given material with a given thickness can be utilised. The second provides a more computationally efficient means of determining the dispersion but is less general purpose. For each signal, a time component can be determine based on the distance between the transmitter and receiver, and the wave speed at that frequency. Importantly, the relative phase information from the FFT is preserved and used as the initial phase offset of the sinusoid before adding the traveling wave component.
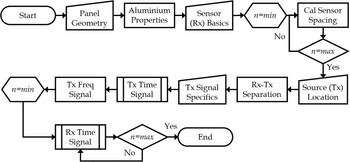
For the received signal, there is no inverse problem that needs to be solved. That is, each of the signals at the receiver location do not have their amplitude and phase information taken to for the FFT of the received signal, which is the inverted (iFFT) to give the received time domain signal. Rather, the direct sum of the array of sinusoids is the time domain signal. Effectively, the computationally intensive solution to the inverse problem is solved with the novel application of first principles physics. The overall procedure is illustrated in Fig. 2.
The process for the numerical model shown as a flow chart.

3.0 Other modelling approaches
Several numerical methods already exist for the modelling of Lamb waves in plate-like materials such as the finite element method (FEM), spectral element method (SEM), and semi-analytical finite element method (SAFE). These numerical modelling techniques are often time intensive in both setup and operation, requiring extensive resources. However, the use of such methods permits analysis of complex structures such as composite materials, stepped geometries, assemblies and damage interaction.
3.1 Finite element analysis (FEA)
The finite element approach for the computation of Lamb wave behaviour is the most versatile and resource intensive. Using FEA, the entire structural model is spatially discretised, and a series of partial differential equations are solved using adequate boundary conditions for the time response of the model. FEA is a powerful tool for the exploration of Lamb wave responses to various geometries [Reference Sherafat, Quaegebeur, Hubert, Lessard and Masson21], materials [Reference Sause, Hamstad and Horn22], damages [Reference Jingjing, Haode, Xuefei and Jinsong23–Reference Munian, Mahapatra and Gopalakrishnan25] and sensor-material interactions [Reference Marinushkin, Levitsky, Zograf and Bakhtina26]. Analysis of Lamb waves using FEA is also one of the most accessible methods due to the availability of commercial software. However, the high resource demand has led to the development of various other numerical methods.
3.2 Spectral element analysis (SEA)
An alternative method to FEA is that of SEA developed principally for work with fluid flows [Reference Patera27]. SEA has a high degree of similarity to FEA, but offers large computational savings due to the use of Lagrange interpolation functions [Reference Peng, Meng and Li28]. The SEA method has been used in similar applications to FEA such as material modelling [Reference Sause, Hamstad and Horn22], damage [Reference Sun, Zhang, Qing and Wang29] and sensor-material interactions [Reference Ha and Chang30]. Ultimately, SEA offers significant benefits over FEA but is otherwise less accessible due to the lack of commercial software available.
3.3 Semi-analytical finite element analysis (SAFE)
The semi-analytical method for the simulation of Lamb wave propagation in elastic wave guides has been studied intensively. The SAFE method offers computational savings over other, pure, finite element methods [Reference Ahmad and Gabbert31]. The SAFE method was first formulated by Aalami [Reference Aalami32] in 1973. Using SAFE, the waveguide is discretised across the cross-section whilst an exponential function is used in the propagation direction [Reference Ahmad and Gabbert31]. The SAFE method has been used for the efficient calculation of the dispersive properties of a Lamb wave in anisotropic laminates and has been shown to have exact solutions for homogenous materials [Reference Datta, Shah, Bratton and Chakraborty33]. The SAFE method is an effective tool for calculating the propagation of Lamb waves in irregular and non-planar geometries [Reference Hladky-Hennion34–Reference Hayashi, Song and Rose36]. Recent work with SAFE has involved the modelling of more complex materials and interactions such as viscoelastic effects in composite mediums [Reference Shorter37], boundary reflection interactions [Reference Aalami32], reflection and transmission behaviour for damage and discontinuities [Reference Ahmad, Vivar-Perez and Gabbert38], pre-stressed materials [Reference Peddeti and Santhanam39] and leaky Lamb wave behaviour [Reference Hayashi and Inoue40]. The SAFE method requires integration of analytical equations with typically finite element methods and is generally developed for individual cases.
3.4 WaveForm Revealer 3
As an alternative, WaveForm Revealer 3 (WFR3) developed by the University of South Carolina is an analytical method for the modelling of Lamb wave propagation by the convolution of a user input function with a structural transfer function in the frequency domain [Reference Shen and Giurgiutiu41]. The structural transfer function is derived by Giurgiutiu [Reference Giurgiutiu18, Reference Shen and Giurgiutiu41] and given below.
 \begin{align}G( {u,\omega } ) = S( \omega ){e^{i{k^S}u}} + A( \omega ){e^{i{k^A}u}}\end{align}
Where the superscript S and A and functions
 $S( \omega )$
and
 $A( \omega )$
correspond to the symmetric and anti-symmetric components, respectively. These are given below.
 \begin{align} S( \omega ) = - \frac{{i\frac{{a{\tau _0}}}{\mu }\sin ( {{k^S}a} ){N_S}({k^S})}}{{D_S^{\prime}( {{k^S}} )}} \end{align}
 \begin{align} {A( \omega ) = - \frac{{i\frac{{a{\tau _0}}}{\mu }\sin ( {{k^A}a} ){N_A}({k^A})}}{{D_A^{\prime}( {{k^A}} )}}} \end{align}
The analytical model for WFR3 is programmed in MATLAB and operated through a graphical user interface (GUI). WFR3 is also capable of modelling Lamb wave damage interactions such as transmission, reflection and conversion behaviour. WFR3 has been validated against FEM and experimental testing such that it is now favoured by industry and academia [Reference Shen and Giurgiutiu41]. Moreover, the analytical method offered significant computational time savings over typical numerical techniques. As a result of the low-resource requirement of WFR3, it has been used in later sections to verify the proposed first principles numerical model.
4.0 Validation
The first step in deploying the numerical model is to determine the dispersion relationships for the given material. Firstly, a range of phase velocities must be selected in which the solution to the Rayleigh-Lamb equation is predicted to exist. These selected phase velocities are used to calculate the predicted wave numbers for the inputted frequency range, which are then used to determine the
 $p$
and
 $q$
constants as given in Equations (3.1) and (3.2). To begin solving the Rayleigh-Lamb equation, it is better to rearrange it into a more useful form suitable for solving with a numerical method. The rearranged forms of Equations (6.1) and (6.2) are given below in subscript notation.
 \begin{align} {\frac{{\tan ( {{q_n}h} )}}{{\tan \left( {{p_n}h} \right)}} + \frac{{4k_n^2{q_n}h}}{{\left( {k_n^2 - q_n^2} \right){^{\!\!2}}}} = f_n^S} \end{align}
 \begin{align} {\frac{{\tan \left( {{q_n}h} \right)}}{ {\tan \left( {{p_n}h} \right)}} + \frac{{\left( {k_n^2 - q_n^2} \right){^{\!\!2}}}}{{4k_n^2{q_n}h}} = f_n^A} \end{align}
The exact solution for the wavenumber and hence, phase velocity occurs when
 ${f_n} = 0$
, representing a root of the rearranged Rayleigh-Lamb equation. A variety of numerical solvers can be applied at this point such as the bisection, secant or Newton-Raphson method. For most solvers, an interval must be determined in which the root is known to lay. Hence, the range [n, n+1] in which a root is found is determined for the case that
 ${f_{n + 1}} \cdot {f_n} \lt 0$
. Discovery of this range restricts the search field, rendering the ability to apply the desirable solver. For the case of higher order wave modes, it must be acknowledged that more than one root may exist within the search field, requiring more rigorous methods. The search resolution for the root can be coarse as the Rayleigh-Lamb equation has high smoothness and hence, a cubic spline may be fitted to the roots to improve the efficiency of the process. Once the phase velocities have been found for the given frequency range, the group velocities may be determined by applying a suitable finite difference approximation to Equation (7).
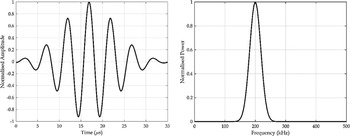
Following determination of the dispersive relationship, the numerical model may be applied as shown in Figs. 2 and 3. To validate the proposed method and evaluate it against common practices, a parametric study was performed for a range of variables. The numerical model was compared with the industry accepted and peer-reviewed software WFR3, developed by the University of South Carolina. The study was conducted using a Gaussian windowed sinusoid centred at a peak frequency of 200 kHz with a fractional bandwidth of 30% as the input signal, shown in Fig. 4. A Gaussian windowed function is used to reduce signal ringing effects [Reference Haugwitz, Hinrichs, Rutsch, Allevato, Dörsam and Kupnik42, Reference Cirtautas, Samaitis, Mažeika, Raišutis and Žukauskas43].
Flow chart depicting the first principles numerical method.

The time domain input signal (left) and its frequency spectrum (right).

In performing the parametric study, the symmetric and antisymmetric wave modes were compared separately. The choice of sensor has a dramatic impact upon the amplitude ratio between the two modes, most notably; fibre Bragg gratings are much more sensitive to the symmetric mode as they measure in-plane displacement whilst piezoelectric transducers are generally more sensitive to the antisymmetric mode due to their measurement of out-of-plane displacement [Reference Yu, Okabe, Wu and Shigeta44]. Hence, the amplitude relationship between the two modes would greatly differ dependent upon the sensor choice. Moreover, it has been shown that piezoelectric transducers can be carefully selected such that they may be tuned for the detection of selected wave modes [Reference Giurgiutiu45]. Ultimately, separation of the two modes allows for normalisation and for a sensor agnostic comparison. The relationship between the two wave modes is commutative and hence, separation will not affect the results.
Data from the WFR3 software is exported with a sampling rate of 10 mega samples per second (MSPS). Hence, as a matter of consistency, the sampling frequency of the proposed model has been set to match this. Whilst the sampling frequency from the WFR3 software does not affect the overall results, the sampling frequency in the numerical model is used for the constitutive frequency selection. As such, varying the sampling frequency of the numerical model could have a minor effect on the results of the study. Nonetheless, as the sampling frequency is increased, it produces results that are more like the analytical solution. At a sampling frequency of 10 MSPS, it is expected that the numerical model results should offer a high degree of similarity to the analytical solution. A comparison of three sampling frequencies is shown below for the numerical model output in Fig. 5.
A comparison of the propagated wave using the numerical model with different sampling frequencies.

At a value of 1 MSPS it is evident that the wave packet is not smooth. At both sampling frequencies of 10 MSPS and 100 MSPS, the results are near identical, and the wave packets can hardly be distinguished from one another. The effect of frequency selection between 1 MSPS and 10/100 MSPS is evident as there is a phase delay between the signals. Ultimately, a sampling frequency between 10 MSPS and 100 MSPS should provide signal outputs that are akin to the analytical solution and any aliasing effects are negligible.
To evaluate the similarity between WFR3 and the numerical model, two methods have been employed. Firstly, the cross-correlation function has been used in the time domain. The cross-correlation function is a method of determining the lag between the location of highest correlation of two signals. A small lag indicates that the signals are very close to their highest point of correlation. If the lag value across all the parametric trials is relatively constant, this is a possible indicator that there is a constant phase delay between the two methods but that they otherwise produce very similar results. The cross-correlation is a useful tool in determining this phase delay but is not a definite method for determining similarity. The method for calculating cross-correlation is given below for two, time dependent signals
 ${x_1}(t)$
and
 ${x_2}(t)$
where signal two is a copy of signal one separated by a time delay (lag)
 ${\tau _{12}}$
and attenuation
 $A$
. Both signals are assumed to have independent, Gaussian noise components given by
 ${n_1}(t)$
and
 ${n_2}(t)$
. For the parametric study both signals have no noise and hence,
 ${n_1}(t) = {n_2}(t) = 0$
.
 \begin{align} {{x_1} = {s_1}(t) + {n_1}(t)} \end{align}
 \begin{align} {{x_2} = A{s_1}( {t + {\tau _{12}}} ) + {n_2}(t)} \end{align}
A perfect cross-correlation between two signals can only be obtained over an infinite period and hence, any calculation possesses a degree of truncation. The method for determining the cross-correlation function for a pair of discrete signals is given below where
 ${}_{}^ - {x_n}$
is the complex conjugate of
 ${x_n}$
.
 \begin{align} {{\psi _j} = \mathop {\lim }\limits_{N\; \to \infty } \mathop \sum \limits_{k = - N}^N {x_{{1_{k + j}}}}{ \cdot ^ - }{x_{{2_k}}}} \end{align}
The cross-correlation can be more efficiently calculated in the frequency domain where the lag can be determined as follows where
 ${X_1}( f )$
is the Fourier transform of signal one and
 ${}_{}^ - {X_2}( f )$
is the complex conjugate of the Fourier transform of signal two.
 \begin{align} {{\tau _{12}} = \max {\rm{iFFT}}\left( {{X_1}( f ) \cdot {}_{}^ - {X_2}( f )} \right)} \end{align}
The second measure of similarity used is Pearson’s linear correlation. The correlation coefficient is a useful metric in determining a linear relationship between sets of data. As the time information, given as the independent variable, will be constant between data sets, the correlation coefficient may be used to compare the amplitude response of the two signals. However, if the signals are not properly aligned due to a possible phase delay, this metric would not prove useful. Hence, the cross-correlation is initially performed and then used to align the signals to the point of their maximum correlation before the correlation coefficient is calculated to determine the magnitude of correlation at this location. In this way, the combination of the two metrics should act as a robust way for determining similarity in both amplitude and phase. The Pearson’s correlation coefficient is given below for two signals
 ${x_1}$
and
 ${x_2}$
with means of
 $\overline {{x_1}}$
and
 $\overline {{x_2}}$
.
 \begin{align} {r = {{\mathop \sum \nolimits_{i = 1}^N \left( {{x_1}_i - \overline {{x_1}} } \right)\left( {{x_{{2_i}}} - \overline {{x_2}} } \right)} \over {\sqrt {\mathop \sum \nolimits_{i = 1}^N {{\left( {{x_{{1_i}}} - \overline {{x_1}} } \right)}^2}\mathop \sum \nolimits_{i = 1}^N {{\left( {{x_2}_i - \overline {{x_2}} } \right)}^2}} }}} \end{align}
A comparison of the dispersive relationships calculated from the numerical model and obtained from WFR3 are shown in Fig. 6. The resultant curves are for aluminium alloy 2024-T3.
The Pearson’s linear correlation coefficient has been used to compare the two dispersion relationships. As can be seen, both wave modes are perfectly correlated with a correlation value of one. Hence, the dispersion information from both the proposed technique in the numerical model as well as the WFR3 software can be considered identical.
A comparison of dispersion properties of aluminium from the numerical model and WFR3.

The remainder of the numerical model is validated against WFR3 over a range of material properties and variables as noted in Table 1. These variables are swept from the lower limit to the upper limit with the spacing specified. These properties are assessed over a range that is suitable for most materials. Symmetric and antisymmetric modes are compared independently as previously discussed.
The range of variables assessed in the numerical model validation

The results of the parametric study are shown below in Fig. 7 with phase error, depicted as a time delay on the left and amplitude error, depicted as the Pearson’s correlation coefficient shown on the right. Both sets of data show that the numerical model is comparatively very similar to the results obtained from WFR3. There are notably few outliers. WFR3 struggles to provide a solution as material properties approach non-physical values. Most notably, a Poisson’s ratio of 0.05 produced a bad result. However, the numerical model continues to perform well in this regime and yields qualitatively accurate results. Nonetheless, the results indicate that the numerical model is capable of accurately calculating the propagation of Lamb waves.
Time delay comparison between the numerical model and WFR3 (left) and the Pearson’s correlation coefficient of the signals (right). Antisymmetric modes are shown as solid lines and symmetric as dashed lines.

The following sections detail several proposed improvements to the basic version of the numerical model, including how higher levels of fidelity may be incorporated.
5.0 Modelling extensions
5.1 High temperature effects
Whilst numerous advancements have been made in the fields of NDE and SHM, there remains several challenges, including operation in extreme environments. High-temperature sensors that can withstand such conditions are difficult and expensive to produce. Modelling of high-temperature Lamb waves allows for the optimisation of sensing systems to overcome some of these challenges. Aerospace fields that would see the biggest improvement from research in this area includes the health monitoring of propulsive systems and hypersonic vehicles.
Propulsion systems have recently been shown as the most common cause of fatigue failure in aircraft [Reference Pollock, Wild, Abdelwahab and Murray46]. Moreover, whilst hypersonic flight has seen deployment of experimental vehicles (∼TRL 5), mass production has been delayed, partly owing to the low reliability of some systems [Reference Pollock and Wild47]. The extreme environments in which these vehicles operate introduce large uncertainties and sensitivities of which the use of SHM can aid in overcoming.
Whilst a suitable body of literature exists that explores the thermal effects on Lamb wave propagation, little work has been completed at temperatures of interest (> 1,000°C). Within this higher temperature range, it is expected that additional phenomena may be encountered that have not been considered in previous work. Materials for use in this temperature range including nickel-based superalloys, titanium aluminides and Ceramic Matrix Composites (CMCs) exhibit phenomena such as viscoelastic behaviour and creep that has not been characterised or modelled [Reference Ashby, Shercliff and Cebon48]. Moreover, accumulation of creep damage results in higher void content and cracking that can further influence acoustic behaviour and further engenders reflection-transmission and mode conversion [Reference Ashby, Shercliff and Cebon48].
First attempts can be made to model high-temperature Lamb waves by solving a temperature dependent Rayleigh-Lamb equation. Here,
 ${\lambda _T}$
and
 ${\mu _T}$
are the first and second temperature dependent Lamé’s constants, respectively. The temperature change
 ${\rm{\Delta }}T$
is taken as the difference between the current temperature
 $T$
and that of a reference temperature
 ${T_0}$
. The half-thickness of the plate
 $h$
with respect to the thickness at the reference temperature
 ${h_0}$
is then determined by considering the linear coefficient of thermal expansion
 $\alpha $
.
 \begin{align} {h( {{\rm{\Delta }}T} ) = {h_0}( {1 + \alpha {\rm{\Delta }}T} )} \end{align}
Likewise, the density of the material with respect to the density at the reference temperature can be determined.
 \begin{align} {\rho ( {{\rm{\Delta }}T} ) = {{{\rho _0}} \over {{{( {1 + \alpha {\rm{\Delta }}T} )}^3}}}} \end{align}
The variation in Young’s modulus and Poisson’s ratio were empirically derived by Augereau et al. [Reference Augereau, Laux, Allais, Mottot and Caes49] for aluminium 6061-T6 over a temperature range of 20°C to 220°C as given below. Material properties at high temperatures is arguably one of the biggest limitations in this area.
 \begin{align} {E = 77.59 - {{27.03 \cdot T} \over {{{10}^3}}} - {{13.78 \cdot {T^2}} \over {{{10}^6}}}} \end{align}
 \begin{align} {\nu = 0.317 + {{54.79 \cdot T} \over {{{10}^6}}} + {{6.5 \cdot {T^2}} \over {{{10}^9}}}} \end{align}
Taking the derivative of
 $p$
and
 $q$
with respect to temperature provides the following relationships.
 \begin{align} {p{{\partial p} \over {\partial T}} = k{{\partial k} \over {\partial T}} - {k_L}{{\partial {k_L}} \over {\partial T}}} \end{align}
 \begin{align} {q{{\partial q} \over {\partial T}} = k{{\partial k} \over {\partial T}} - {k_T}{{\partial {k_T}} \over {\partial T}}} \end{align}
Where
 ${k_L}$
and
 ${k_T}$
are the longitudinal and transverse wave numbers, respectively. Finally, the group velocity
 ${C_G}$
may be calculated as follows from the phase velocity
 ${C_P}$
.
 \begin{align} {{{\partial {C_G}} \over {\partial T}} = {{\partial {C_P}} \over {\partial T}}\left( {1 - {k \over {{C_P}}}{{\partial {C_P}} \over {\partial k}}} \right) + k\left( {{{{\partial ^2}{C_P}} \over {\partial k\partial T}}} \right)} \end{align}
A plot of the dispersive phase velocities for aluminium 6061-T6 as well as the corresponding temperature sensitivities are shown in Fig. 8. It is clear that an increase in temperature results in a decrease in the phase velocity of both wave modes but is more pronounced for the symmetric mode.
A comparison of dispersive phase velocities for aluminium (left) and the corresponding sensitivity (right). The solid and dashed lines correspond to the room temperature and 500°C solutions, respectively.

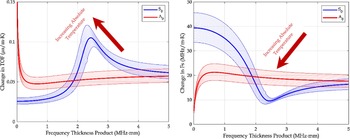
The change in the time-of-flight (TOF) of an acoustic signal as well as the corresponding increase in frequency is shown in Fig. 9. An example of a 200 kHz wave in a 3 mm plate that is transmitted over 250 mm with an increase from the reference temperature of 20°C would result in a change in the TOF of the symmetric mode by 0.134 µs and the antisymmetric mode by 0.239 µs.
Change in the signal time-of-flight (TOF) (left) and corresponding increase in sampling frequency (right).

5.2 Anisotropic materials
A further extension of the numerical model may include consideration of anisotropic materials. Such materials are commonplace in aerospace settings, primarily in the form of fibre reinforced polymers (FRPs) and cold-rolled aluminium [Reference Pollock and Wild50]. Adjustments can be made to the original model by including these effects in the form of directionally dependent material properties. The model can easily incorporate this modification by calculating the dispersion relationships for each direction of interest. Whilst such a method would account for the variation in wave speed, it would not capture the complex Lamb wave and shear horizontal wave coupling effects [Reference Wierach51].
To model the anisotropic material properties in FRPs, classical laminate theory (CLT) is used to determine the directionally dependent material properties. We begin with the reduced stiffness coefficients of the material along the ply axis, knowing that
 ${{{\nu _{12}}} \over {{E_1}}} = {{{\nu _{21}}} \over {{E_2}}}$
[Reference Baker52].
 \begin{align} {{Q_{11}}( 0 ) = {{{E_1}} \over {1 - {\nu _{12}}{\nu _{21}}}}} \end{align}
 \begin{align} {{Q_{22}}( 0 ) = {{{E_2}} \over {1 - {\nu _{12}}{\nu _{21}}}}} \end{align}
 \begin{align}{Q_{12}}( 0 ) = {{{\nu _{21}}{E_1}} \over {1 - {\nu _{12}}{\nu _{21}}}}\end{align}
 \begin{align}{Q_{66}}( 0 ) = {G_{12}}\end{align}
These coefficients must then be transformed along the laminate axis, where
 $c = \cos ( \theta ),\;s = {\rm{sin}}( \theta )$
.
 \begin{align}\boldsymbol{Q}( \theta ) = \boldsymbol{TQ}( 0 ),\end{align}
 \begin{align}\boldsymbol{T} = \left[ \begin{array}{c@{\quad}c@{\quad}c@{\quad}c} {{c^4}} & {2{c^2}{s^2}} & {{s^4}} & {4{c^2}{s^2}} \\ {{c^2}{s^2}} & {{c^4} + {s^4}} & {{c^2}{s^2}} & { - 4{c^2}{s^2}} \\ {{s^4}} & {2{c^2}{s^2}} & {{c^4}} & {4{c^2}{s^2}} \\ {{c^3}s} & { - cs\left( {{c^2} - {s^2}} \right)} & { - c{s^3}} & { - 2cs\left( {{c^2} - {s^2}} \right)} \\ {c{s^3}} & {cs\left( {{c^2} - {s^2}} \right)} & { - {c^3}s} & {2cs\left( {{c^2} - {s^2}} \right)} \\ {{c^2}{s^2}} & { - 2{c^2}{s^2}}& {{c^2}{s^2}} & {{{\left( {{c^2} - {s^2}} \right)}^2}} \end{array} \right], \quad \boldsymbol{Q}( 0 ) = \begin{array}{c} {{Q_{11}}( 0 )} \\ {{Q_{12}}( 0 )} \\ {{Q_{22}}( 0 )} \\ {{Q_{66}}( 0 )} \end{array}\end{align}
Next, we calculate the in-plane stiffness matrix terms for the stress resultants.
 \begin{align} {A_{ij}^* = {1 \over t}\mathop \sum \limits_{k = 1}^n {Q_{ij}}\left( {{\theta _k}} \right)\left( {{h_k} - {h_{k - 1}}} \right)} \end{align}
Finally, the stiffness properties of the material along the laminate axis may be obtained.
 \begin{align}{E_x} = A_{xx}^* - {{{A^*}_{xy}^2} \over {A_{yy}^*}}\end{align}
 \begin{align}{E_x} = A_{yy}^* - {{{A^*}_{xy}^2} \over {A_{xx}^*}}\end{align}
 \begin{align}{\nu _{xy}} = {{A_{xy}^*} \over {A_{yy}^*}}\end{align}
 \begin{align}{\nu _{yx}} = {{A_{xy}^*} \over {A_{xx}^*}}\end{align}
 \begin{align}{G_{xy}} = A_{ss}^*\end{align}
Let us consider an orthotropic laminate with the following layup [0, 0, 90, 90]2S, and material properties given in Table 2.
Material properties of the composite for the given example

The resulting CLT analysis provides polar plots of the material properties as shown in Fig. 10.
Polar plots for modulus (left) and Poisson’s ratio (right) dependent upon the material direction of orientation.

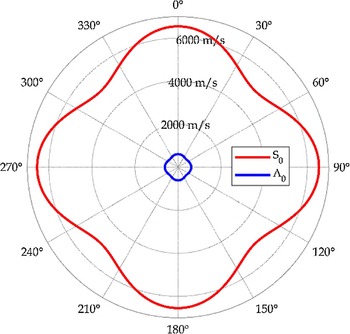
The resulting phase velocities for both the symmetric and antisymmetric modes at 200 kHz are plotted in Fig. 11. As evident, the change in material properties has a marked effect upon the acoustic response of the panel and should be considered in any form of analysis.
Polar plot of the phase velocities of both Lamb wave modes.

5.3 Edge reflections
Edge reflections of Lamb waves has not been implemented but a proposed addition to the original numerical model is a raytracing method that would predict the path of the Lamb wave through a discrete number of angles, like that shown in Fig. 12. Boundary conditions can be implemented by considering whether the plate is fixed or free at an edge, resulting in an inverted or non-inverted reflection, respectively. Likewise, a relationship for reflected energy could be used to predict the amplitude of reflected waves as well as models for predicting mode conversion. Edge reflections are an important phenomenon, as the colocation of waves would result in constructive and destructive interference, affecting the ability to analyse and localise the emission.
The general principles of ray tracing edge reflections.

Previous approaches including Monte Carlo simulations are computationally expensive, and hence, the use of ray tracing algorithms that can accurately and efficiently analyse the path of the wave from source to sink are desirable. Heinze et al. [Reference Heinze, Sinapius and Wierach53] developed a ray tracing algorithm for anisotropic composite materials based on Fermat’s principle. Zhang et al. [Reference Zhang, Sun, Qi and Liu54] proposed a novel version of the linear travel time interpolation method, which was also used to predict and visualise geometric defects in plates. Balvantín et al. [Reference Balvantín, Baltazar and Rodriguez55] also developed a ray tracing method based on Fermat’s principle by discretising the plate into a grid of constant material properties and applying Snell’s law. A thickness reduction defect was experimentally and numerically studied, which showed the ability to reconstruct the tomography of a plate based upon the wave’s time of flight.
6.0 Conclusion
Ultimately, this work has presented a novel first principles numerical model for predicting the behaviour of Lamb wave propagation in 2D plate structures. The model is easier to understand and implement compared to analytical solutions and faster than traditional numerical methods. Validation against WFR3 shows excellent correlation. The presented numerical model opens opportunities for improved NDT&E and SHM of aerospace vehicles. The study also identifies potential avenues for future research and improvements to the code, including the modelling of high temperature effects, anisotropic materials and edge reflections. Overall, this research paper has contributed to the field of Lamb wave propagation modelling and provides valuable insights for researchers and engineers in the aerospace industry.