


1 Introduction
The motion of a liquid plug in a capillary tube has been widely studied since the pioneering works by Fairbrother & Stubbs (Reference Fairbrother and Stubbs1935), Bretherton (Reference Bretherton1961) and Taylor (Reference Taylor1961) due to its relevance in a variety of natural systems and engineering applications including pulmonary flows (Grotberg Reference Grotberg1994, Reference Grotberg2011), enhanced oil recovery (Afzali, Rezaei & Zendehboudi Reference Afzali, Rezaei and Zendehboudi2018), two-phase monolith catalyst reactors (Irandoust & Andersson Reference Irandoust and Andersson1988; Kreutzer et al. Reference Kreutzer, Kapteijn, Moulijn and Heiszwolf2005), gas-assisted injection molding (Dimakopoulos & Tsamopoulos Reference Dimakopoulos and Tsamopoulos2003), arterial gas embolism (Mukundakrishnan, Ayyaswamy & Eckmann Reference Mukundakrishnan, Ayyaswamy and Eckmann2009) and lab-on-a-chip systems (Stone, Stroock & Ajdari Reference Stone, Stroock and Ajdari2004; Ladosz, Rigger & von Rohr Reference Ladosz, Rigger and von Rohr2016). In particular, liquid plug formation, propagation and rupture play a crucial role in respiratory airways in both healthy (Burger & Macklem Reference Burger and Macklem1968; Hughes, Rosenzweig & Kivitz Reference Hughes, Rosenzweig and Kivitz1970) and pathological (Gunther et al. Reference Gunther, Siebert, Schmidt, Ziegler, Grimminger, Yabut, Temmesfeld, Walmrath, Morr and Seeger1996a ,Reference Gunther, Siebert, Schmidt, Ziegler, Grimminger, Yabut, Temmesfeld, Walmrath, Morr and Seeger b ; Baker et al. Reference Baker, Evans, Randle and Haslam1999; Griese et al. Reference Griese, Essl, Schmidt, Rietschel, Ratjen, Ballmann and Paul2004; Hogg et al. Reference Hogg, Chu, Utokaparch, Woods, Elliott, Buzatu, Cherniack, Rogers, Sciurba and Coxson2004; Grotberg Reference Grotberg2011) conditions as well as in treatment of various pulmonary diseases, such as surfactant replacement therapy (Stevens & Sinkin Reference Stevens and Sinkin2007), partial liquid ventilation (Shaffer & Wolfson Reference Shaffer and Wolfson1996) and pulmonary drug delivery (Jensen, Halpern & Grotberg Reference Jensen, Halpern and Grotberg1994; Yu & Chien Reference Yu and Chien1997).
The inside of lung airways is coated with a liquid lining that may undergo a Plateau–Rayleigh instability and create a liquid plug obstructing gas exchange not only for that airway but also for all connected distal parts of the lung (Hughes et al. Reference Hughes, Rosenzweig and Kivitz1970; Kamm & Schroter Reference Kamm and Schroter1989). The instability occurs when the film thickness is sufficiently large (Bian et al. Reference Bian, Tai, Halpern, Zheng and Grotberg2010; Tai et al. Reference Tai, Bian, Halpern, Zheng, Filoche and Grotberg2011) and can be intensified by deficiency or disfunction of lung surfactant (Halpern & Grotberg Reference Halpern and Grotberg1993) as well as by flexibility of airway walls resulting in a capillary–elastic instability (Halpern & Grotberg Reference Halpern and Grotberg1992).
Pulmonary surfactant, which is secreted as a mixture of lipids and proteins by the alveolar type II cells into the alveolar space, plays a critical role in the respiratory system (Hall et al. Reference Hall, Venkitaraman, Whitsett, Holm and Notter1992; Goerker Reference Goerker1998). Surfactant molecules are composed of a hydrophilic head and a hydrophobic tail. Once produced, they tend to collect at the liquid film lining the alveoli and airways, form a buffer zone between the liquid and gas phases, interact with the cohesive forces between the fluid molecules and thus reduce the surface tension. It is known that the pulmonary surfactant reduces the work required to expand the lung in each breath by reducing the surface tension at the liquid–air interface and also plays a vital role in stabilizing the sizes of alveolar gas bubbles that prevents the collapse of alveoli and consequent formation of pulmonary edema, and regulating the entire breathing process (Clements Reference Clements1962, Reference Clements1997). The pulmonary surfactant also critically influences the formation, propagation and rupture of liquid plugs (Grotberg Reference Grotberg2011). Thus, the understanding of effects of pulmonary surfactant on the airway closure and reopening processes is of fundamental importance and physiological significance.
Plug propagation and rupture exert large mechanical stresses and may cause significant damage to the pulmonary epithelial cells (Huh et al. Reference Huh, Fujioka, Tung, Futai, Paine, Grotberg and Takayama2007; Tavana et al. Reference Tavana, Zamankhan, Christensen, Grotberg and Takayama2011; Grotberg Reference Grotberg2019). In addition, the abnormal breath sounds known as respiratory crackles are also believed to be generated by the transient pressure waves resulting from plug rupture and its interaction with the airway walls (Grotberg Reference Grotberg2019). The crackle sounds are routinely used as a signature of a wide range of respiratory disorders in clinical practices (Piirila & Sovijarvi Reference Piirila and Sovijarvi1995). Experimental studies conducted on rat and rabbit lungs in vivo by Muscedere et al. (Reference Muscedere, Mullen, Gan and Slutsky1994) and Taskar et al. (Reference Taskar, John, Evander, Robertson and Jonson1997) have revealed that severe lung injuries are caused by repetitive airway reopening in surfactant-deficient subjects. Bilek, Dee & Gaver (Reference Bilek, Dee and Gaver2003) experimentally and computationally investigated flow-induced epithelial cell damage using the progression of a semi-infinite bubble in a narrow liquid-filled channel lined with pulmonary epithelial cells as a model for airway reopening. They found that cell damage surprisingly increases as reopening velocity decreases. They also showed that cell injury can be prevented completely by the presence of pulmonary surfactant supporting the hypotheses that the pulmonary surfactant protects the epithelium from flow-induced injury during airway reopening. With the aid of computational simulations, they concluded that the cell damage is caused most likely by the steep pressure gradient near the bubble front, which has been confirmed by Kay et al. (Reference Kay, Bilek, Dee and Gaver2004) by showing that cell damage is directly correlated with the pressure gradient, not the duration of stress exposure. Yalcin, Perry & Ghadiali (Reference Yalcin, Perry and Ghadiali2007) investigated the effects of reopening velocity, airway diameter cell confluence and cyclic closure/reopening on cellular damage using an in vitro cell culture model and demonstrated that cell damage increases with decreasing channel size and reopening velocity. Based on the experimental results, they concluded that distal airways of the lung are more prone to flow-induced injury. The cell culture experiments by Bilek et al. (Reference Bilek, Dee and Gaver2003) and Kay et al. (Reference Kay, Bilek, Dee and Gaver2004) showed that pulmonary surfactant completely abates the epithelial cell damage by reducing the magnitude of flow-induced mechanical stresses resulting from propagation and rupture of liquid plugs during the airway reopening process, which serves as a motivation for the present study that aims to investigate the mechanism of how surfactant reduces this epithelial cell damage.
Huh et al. (Reference Huh, Fujioka, Tung, Futai, Paine, Grotberg and Takayama2007) performed an extensive experimental study using a microfluidic airway model and showed that propagation and rupture of liquid plugs generate deleterious fluid mechanical stresses that cause significant injury of small-airway epithelial cells. They also showed that repetition of plug rupture greatly intensifies the cell damage suggesting that repeated closure and reopening can cause the epithelial cell to be injured severely even under conditions that would not result in significant damage during a single reopening event. More recently, Tavana et al. (Reference Tavana, Zamankhan, Christensen, Grotberg and Takayama2011) experimentally studied the effects of surfactant on cell damage using a microfluidic model of small airways of the lung and confirmed the protective role of surfactant against flow-induced mechanical stresses in lungs. They found that addition of a physiologic amount of a clinical surfactant, Survanta, to propagating liquid plugs significantly reduces epithelial cell death and protects the epithelium.
Ghadiali & Gaver (Reference Ghadiali and Gaver2000, Reference Ghadiali and Gaver2003) studied the progression of a semi-infinite air bubble in a surfactant-doped, fluid-filled rigid capillary tube experimentally and computationally to investigate the continual interfacial expansion dynamics as a model for opening of collapsed pulmonary airways. They found that the physicochemical properties of surfactant can have a large impact on the interfacial pressure drop through modification of the surface tension and the creation of Marangoni stresses and thus on the dynamics of the propagation of a semi-infinite bubble in a rigid capillary. Naire & Jensen (Reference Naire and Jensen2005) developed a theoretical model to study propagation of a semi-infinite bubble through an initially liquid-filled collapsed airway lined with deformable epithelial cells. Their model accounts for the flow–structure interactions, surfactant transport around the bubble tip and cell deformation. They showed that surfactant reduces the pressure required to drive the bubble through a collapsed airway by peeling apart the airway walls and this reduction in reopening pressure can potentially limit damage via volutrauma.
Liquid plug propagation in capillary tubes has been studied computationally using various numerical approaches. Fujioka & Grotberg (Reference Fujioka and Grotberg2004) performed extensive simulations to investigate steady propagation of a clean liquid plug in a two-dimensional rigid channel without a plug rupture. They found that a capillary wave develops in the precursor film in the vicinity of the front meniscus as the Reynolds number increases, which results in sharp pressure and shear stress peaks in the capillary wave at the front interface. Their findings indicate the possibility of a higher risk of epithelial cell injury on the front side of the liquid plug compared to the rear side. Fujioka & Grotberg (Reference Fujioka and Grotberg2005) later included the pulmonary surfactant into their computational model and performed simulations to examine effects of surfactant on steady propagation of a liquid plug in a similar two-dimensional planar geometry. They found that the surfactant accumulates on the front meniscus interface and the surfactant-induced Marangoni stress rigidifies the interface to make the surface velocity nearly zero. As a result, the liquid film near the front meniscus becomes thicker and hence the mechanical stresses on the wall are reduced significantly. Fujioka, Takayama & Grotberg (Reference Fujioka, Takayama and Grotberg2008) also extended their model to examine the unsteady effects on plug propagation in the absence of surfactant. For this purpose, they performed numerical simulations to investigate the effects of precursor film thickness on pressure and wall shear stress for a clean liquid plug moving in a capillary tube. They showed that the plug length decreases monotonically until the plug ruptures when the driving pressure exceeds a critical value while the plug length increases and the plug does not rupture otherwise. However, they did not simulate the plug rupture and post-rupture processes because of the limitation of their numerical method. Later, Hassan et al. (Reference Hassan, Uzgoren, Fujioka, Grotberg and Shyy2011) computationally examined the rupture dynamics but they did not consider the effects of surfactant. They used an adaptive Eulerian–Lagrangian method and performed extensive simulations to examine plug rupture in a liquid-lined tube. They showed that plug rupture results in a sudden increase of mechanical stresses on the tube wall providing further evidence for significant epithelial cell injuries caused by plug rupture as observed experimentally by Huh et al. (Reference Huh, Fujioka, Tung, Futai, Paine, Grotberg and Takayama2007).
In the present study, we computationally examine the effects of pulmonary surfactant on liquid plug propagation and rupture in a capillary tube as a model for distal lung airways using a front-tracking method (Muradoglu & Tryggvason Reference Muradoglu and Tryggvason2008). The plug is driven by an applied constant pressure difference in a rigid axisymmetric tube lined by a thin precursor liquid film. The solubility of surfactant is accounted for and the surface tension is related to the interfacial surfactant concentration via an equation of state. Then extensive simulations are performed to investigate the effects of surfactant on the mechanical stresses that could be injurious to epithelial cells, such as pressure, shear stress and their gradients. It is found that the liquid plug ruptures violently to induce large stresses on airway walls and even a tiny amount of surfactant significantly reduces them, which improves cell survivability as seen in microfluidic experiments of Tavana et al. (Reference Tavana, Zamankhan, Christensen, Grotberg and Takayama2011). However, addition of surfactant also delays the plug rupture and thus airway reopening.
The remainder of the paper is organized as follows. The mathematical formulation is presented and the numerical method is briefly discussed in § 2. The physical problem, the computational domain and initial and boundary conditions are described in § 3. The results are presented and discussed in § 4 and conclusions are drawn in § 5. The numerical method is validated in appendix A for a surfactant-free plug propagation without and with a rupture studied previously using different numerical approaches by Fujioka et al. (Reference Fujioka, Takayama and Grotberg2008) and Hassan et al. (Reference Hassan, Uzgoren, Fujioka, Grotberg and Shyy2011), respectively. Grid convergence of the numerical method is also demonstrated in appendix B.
The computational set-up for plug propagation and rupture. The plug moves from left to right due to applied pressure difference
 $\unicode[STIX]{x0394}p^{\ast }=p_{1}^{\ast }-p_{2}^{\ast }$
. The arclength (
 $s^{\ast }$
) is measured from the centreline in the clockwise and counterclockwise directions for the leading and trailing air fingers, respectively. Note that the arclength of the trailing air finger is made negative to distinguish it from that of the leading air finger. When the liquid plug ruptures, a negative arclength denotes a point on the interface whose axial location
 $z_{p}$
is smaller than the axial location of the rupture point
 $z_{rupture}$
.

2 Formulation and numerical method
The governing equations are described in the context of the finite-difference/front-tracking method. The flow equations are solved in their dimensional forms but the results are presented in terms of non-dimensional quantities. The dimensional quantities are denoted by superscript
 $^{\ast }$
. We consider a liquid plug moving through a liquid-lined airway of radius
 $R^{\ast }$
as shown in figure 1. The flow is assumed to be incompressible and symmetric about the axis of the tube, and the gas and liquid phases are Newtonian fluids. Using a one-field formulation of Unverdi & Tryggvason (Reference Unverdi and Tryggvason1992), the incompressible flow equations can be written for the entire computational domain as
 $$\begin{eqnarray}\displaystyle {\displaystyle \frac{\unicode[STIX]{x2202}\unicode[STIX]{x1D70C}^{\ast }\boldsymbol{u}^{\ast }}{\unicode[STIX]{x2202}t^{\ast }}}+\unicode[STIX]{x1D735}^{\ast }\boldsymbol{\cdot }(\unicode[STIX]{x1D70C}^{\ast }\boldsymbol{u}^{\ast }\boldsymbol{u}^{\ast }) & = & \displaystyle -\unicode[STIX]{x1D735}^{\ast }p^{\ast }+\unicode[STIX]{x1D735}^{\ast }\boldsymbol{\cdot }\unicode[STIX]{x1D707}^{\ast }(\unicode[STIX]{x1D735}^{\ast }\boldsymbol{u}^{\ast }+\unicode[STIX]{x1D735}^{\ast }\boldsymbol{u}^{\ast \text{T}})\nonumber\\ \displaystyle & & \displaystyle +\,\int _{A^{\ast }}(\unicode[STIX]{x1D70E}^{\ast }(\unicode[STIX]{x1D6E4}^{\ast })\unicode[STIX]{x1D705}^{\ast }\boldsymbol{n}+\unicode[STIX]{x1D735}_{s}^{\ast }\unicode[STIX]{x1D70E}^{\ast }(\unicode[STIX]{x1D6E4}^{\ast }))\unicode[STIX]{x1D6FF}(\boldsymbol{x}^{\ast }-\boldsymbol{x}_{f})\,\text{d}A^{\ast },\qquad\end{eqnarray}$$
where
 $t^{\ast }$
is the time,
 $\boldsymbol{u}^{\ast }$
is the velocity vector,
 $p^{\ast }$
is the pressure field,
 $\unicode[STIX]{x1D70C}^{\ast }$
and
 $\unicode[STIX]{x1D707}^{\ast }$
are the discontinuous density and viscosity fields, respectively, and
 $A^{\ast }$
is the surface area. The last term on the right-hand side represents the body force due to the surface tension, where
 $\unicode[STIX]{x1D70E}^{\ast }$
is the surface tension coefficient that is a function of the interfacial surfactant concentration
 $\unicode[STIX]{x1D6E4}^{\ast }$
,
 $\unicode[STIX]{x1D705}^{\ast }$
is twice the mean curvature of the interface,
 $\boldsymbol{n}$
is a unit vector normal to the interface and
 $\unicode[STIX]{x1D735}_{s}^{\ast }$
is the gradient operator along the interface defined as
 $$\begin{eqnarray}\unicode[STIX]{x1D735}_{s}^{\ast }=\unicode[STIX]{x1D735}^{\ast }-\boldsymbol{n}(\boldsymbol{n}\boldsymbol{\cdot }\unicode[STIX]{x1D735}^{\ast }).\end{eqnarray}$$
The surface tension only acts on the interface as indicated by the three-dimensional Dirac delta function
 $\unicode[STIX]{x1D6FF}$
whose arguments
 $\boldsymbol{x}^{\ast }$
and
 $\boldsymbol{x}_{f}^{\ast }$
are the point at which the equation is evaluated and the point at the interface, respectively. The treatment of surface force as a body force was pioneered by Peskin (Reference Peskin1977) with the immersed boundary approach. The Navier–Stokes equations are supplemented by the incompressibility condition
 $$\begin{eqnarray}\unicode[STIX]{x1D735}^{\ast }\boldsymbol{\cdot }\boldsymbol{u}^{\ast }=0.\end{eqnarray}$$
We also assume that the material properties remain constant following a fluid particle:
 $$\begin{eqnarray}{\displaystyle \frac{\text{D}\unicode[STIX]{x1D70C}^{\ast }}{\text{D}t^{\ast }}}=0,\quad {\displaystyle \frac{\text{D}\unicode[STIX]{x1D707}^{\ast }}{\text{D}t^{\ast }}}=0,\quad {\displaystyle \frac{\text{D}D_{c}^{\ast }}{\text{D}t^{\ast }}}=0,\end{eqnarray}$$
where
 $D_{c}^{\ast }$
is the molecular diffusivity of bulk surfactant concentration and
 $\text{D}/\text{D}t^{\ast }=(\unicode[STIX]{x2202}/\unicode[STIX]{x2202}t^{\ast })+\boldsymbol{u}^{\ast }\boldsymbol{\cdot }\unicode[STIX]{x1D735}^{\ast }$
is the material derivative. The density and viscosity vary discontinuously across the fluid interface and are given by
 $$\begin{eqnarray}\unicode[STIX]{x1D70C}^{\ast }=\unicode[STIX]{x1D70C}_{g}^{\ast }I+\unicode[STIX]{x1D70C}_{l}^{\ast }(1-I),\quad \unicode[STIX]{x1D707}^{\ast }=\unicode[STIX]{x1D707}_{g}^{\ast }I+\unicode[STIX]{x1D707}_{l}^{\ast }(1-I),\end{eqnarray}$$
where the subscripts ‘
 $g$
’ and ‘
 $l$
’ denote properties of the gas phase and the liquid phase, respectively, and
 $I$
is the indicator function defined as
 $$\begin{eqnarray}I(\boldsymbol{x}^{\ast },t^{\ast })=\left\{\begin{array}{@{}ll@{}}1\quad & \text{in gas phase,}\\ 0\quad & \text{in liquid phase.}\end{array}\right.\end{eqnarray}$$
The interfacial surfactant concentration
 $\unicode[STIX]{x1D6E4}^{\ast }$
is defined as the amount of surfactant per unit surface area. In a static system, as the bulk concentration increases, the surfactant molecules are adsorbed at the interface until the interface becomes saturated with surfactant and attains the value
 $\unicode[STIX]{x1D6E4}^{\ast }=\unicode[STIX]{x1D6E4}_{\infty }^{\ast }$
, where
 $\unicode[STIX]{x1D6E4}_{\infty }^{\ast }$
is the maximum equilibrium concentration. In a dynamic system,
 $\unicode[STIX]{x1D6E4}^{\ast }$
can exceed
 $\unicode[STIX]{x1D6E4}_{\infty }^{\ast }$
in the region where the surfactant accumulates due to the surface flow. The surface tension decreases with the interfacial surfactant concentration approximately linearly for
 $\unicode[STIX]{x1D6E4}^{\ast }<\unicode[STIX]{x1D6E4}_{\infty }^{\ast }$
and the relationship becomes nonlinear for
 $\unicode[STIX]{x1D6E4}^{\ast }\geqslant \unicode[STIX]{x1D6E4}_{\infty }^{\ast }$
. Following Fujioka & Grotberg (Reference Fujioka and Grotberg2005) and Zheng, Fujioka & Grotberg (Reference Zheng, Fujioka and Grotberg2007), the surface tension coefficient is related to the interfacial surfactant concentration as
 $$\begin{eqnarray}{\displaystyle \frac{\unicode[STIX]{x1D70E}^{\ast }}{\unicode[STIX]{x1D70E}_{s}^{\ast }}}=\left\{\begin{array}{@{}ll@{}}\left(1-\unicode[STIX]{x1D6FD}{\displaystyle \frac{\unicode[STIX]{x1D6E4}^{\ast }}{\unicode[STIX]{x1D6E4}_{\infty }^{\ast }}}\right)\quad & \text{if }\unicode[STIX]{x1D6E4}^{\ast }<\unicode[STIX]{x1D6E4}_{\infty }^{\ast },\\ (1-\unicode[STIX]{x1D6FD})\exp \left[{\displaystyle \frac{\unicode[STIX]{x1D6FD}}{1-\unicode[STIX]{x1D6FD}}}\left(1-{\displaystyle \frac{\unicode[STIX]{x1D6E4}^{\ast }}{\unicode[STIX]{x1D6E4}_{\infty }^{\ast }}}\right)\right]\quad & \text{if }\unicode[STIX]{x1D6E4}^{\ast }\geqslant \unicode[STIX]{x1D6E4}_{\infty }^{\ast },\end{array}\right.\end{eqnarray}$$
where
 $\unicode[STIX]{x1D70E}_{s}^{\ast }$
is the surface tension of the clean interface and
 $\unicode[STIX]{x1D6FD}$
is the elasticity number.
The evolution equation for the interfacial surfactant concentration
 $\unicode[STIX]{x1D6E4}^{\ast }$
was derived by Stone (Reference Stone1990). Since the interfacial surfactant evolution equation is solved on a Lagrangian grid in the finite-difference/front-tracking framework, it is convenient to write it in the following form (Muradoglu & Tryggvason Reference Muradoglu and Tryggvason2008, Reference Muradoglu and Tryggvason2014):
 $$\begin{eqnarray}{\displaystyle \frac{1}{A^{\ast }}}{\displaystyle \frac{\text{D}\unicode[STIX]{x1D6E4}^{\ast }A^{\ast }}{\text{D}t^{\ast }}}=D_{s}^{\ast }\unicode[STIX]{x1D6FB}_{s}^{\ast 2}\unicode[STIX]{x1D6E4}^{\ast }+{\dot{S}}_{\unicode[STIX]{x1D6E4}}^{\ast },\end{eqnarray}$$
where
 $A^{\ast }$
is the area of an element of the interface,
 $D_{s}^{\ast }$
is the diffusion coefficient along the interface and
 ${\dot{S}}_{\unicode[STIX]{x1D6E4}}^{\ast }$
is the source term given by
 $$\begin{eqnarray}{\dot{S}}_{\unicode[STIX]{x1D6E4}}^{\ast }=\left\{\begin{array}{@{}ll@{}}k_{a}^{\ast }C_{s}^{\ast }(\unicode[STIX]{x1D6E4}_{\infty }^{\ast }-\unicode[STIX]{x1D6E4}^{\ast })-k_{d}^{\ast }\unicode[STIX]{x1D6E4}^{\ast }\quad & \text{if }\unicode[STIX]{x1D6E4}^{\ast }<\unicode[STIX]{x1D6E4}_{\infty }^{\ast },\\ -k_{d}^{\ast }\unicode[STIX]{x1D6E4}^{\ast }\quad & \text{if }\unicode[STIX]{x1D6E4}^{\ast }\geqslant \unicode[STIX]{x1D6E4}_{\infty }^{\ast },\end{array}\right.\end{eqnarray}$$
where
 $k_{a}^{\ast }$
and
 $k_{d}^{\ast }$
are the adsorption and the desorption coefficients, respectively, and
 $C_{s}^{\ast }$
is the surfactant concentration in the liquid immediately adjacent to the interface. The bulk surfactant concentration
 $C^{\ast }$
is governed by the advection–diffusion equation
 $$\begin{eqnarray}{\displaystyle \frac{\unicode[STIX]{x2202}C^{\ast }}{\unicode[STIX]{x2202}t^{\ast }}}+\unicode[STIX]{x1D735}^{\ast }\boldsymbol{\cdot }(C^{\ast }\boldsymbol{u}^{\ast })=\unicode[STIX]{x1D735}^{\ast }\boldsymbol{\cdot }(D_{co}^{\ast }\unicode[STIX]{x1D735}^{\ast }C^{\ast }),\end{eqnarray}$$
where
 $D_{co}^{\ast }$
is related to the molecular diffusion coefficient
 $D_{c}^{\ast }$
through the indicator function as
 $$\begin{eqnarray}D_{co}^{\ast }=D_{c}^{\ast }(1-I).\end{eqnarray}$$
The source in (2.8) is related to the bulk concentration as
 $$\begin{eqnarray}{\dot{S}}_{\unicode[STIX]{x1D6E4}}^{\ast }=-D_{co}^{\ast }(\boldsymbol{n}\boldsymbol{\cdot }\unicode[STIX]{x1D735}^{\ast }C^{\ast }|_{interface}).\end{eqnarray}$$
The adsorption layer concept developed by Muradoglu & Tryggvason (Reference Muradoglu and Tryggvason2008) is used to treat mass boundary condition at the interface. The method assumes that all the mass transfer between the interface and the bulk takes place in a thin adsorption layer adjacent to the interface. In this approach, the total amount of mass adsorbed on the interface is distributed over the adsorption layer and added to the bulk concentration evolution equation as a negative source term in a conservative manner. Equation (2.10) thus becomes
 $$\begin{eqnarray}{\displaystyle \frac{\unicode[STIX]{x2202}C^{\ast }}{\unicode[STIX]{x2202}t^{\ast }}}+\unicode[STIX]{x1D735}^{\ast }\boldsymbol{\cdot }(C^{\ast }\boldsymbol{u}^{\ast })=\unicode[STIX]{x1D735}^{\ast }\boldsymbol{\cdot }(D_{co}^{\ast }\unicode[STIX]{x1D735}^{\ast }C^{\ast })+{\dot{S}}_{c}^{\ast },\end{eqnarray}$$
where
 ${\dot{S}}_{c}^{\ast }$
is the source term evaluated at the interface and distributed conservatively onto the adsorption layer. With this formulation, all the mass of the bulk surfactant to be adsorbed by the interface is already consumed in the adsorption layer before the interface. Hence, the boundary condition at the interface simplifies to be
 $\boldsymbol{n}\boldsymbol{\cdot }\unicode[STIX]{x1D735}^{\ast }C^{\ast }|_{interface}=0$
. This approach is easy to implement and has been found to result in a better mass conservation as compared to directly imposing the boundary condition (i.e. (2.12)) at the interface boundary (Irfan & Muradoglu Reference Irfan and Muradoglu2017).
The flow equations (2.1) and (2.3) are solved fully coupled with the interfacial (2.8) and bulk (2.13) concentration evolution equations using the finite-difference/front-tracking method (Muradoglu & Tryggvason Reference Muradoglu and Tryggvason2008, Reference Muradoglu and Tryggvason2014). The spatial derivatives are discretized using second-order central differences except for the convective term in the bulk surfactant evolution equation for which a fifth-order WENO-Z scheme (Borges et al. Reference Borges, Carmona, Costa and Don2013) is used. A projection method (Harlow & Welch Reference Harlow and Welch1965; Unverdi & Tryggvason Reference Unverdi and Tryggvason1992) is used to solve the discretized equations on a stationary, staggered Eulerian grid. The numerical method is overall second- and first-order accurate in space and time, respectively. Note that it is straightforward to make the numerical method second-order accurate in time but the time-stepping error is generally found to be negligibly small compared to the spatial error mainly due to the small time step imposed by the stability requirements.
The liquid–gas interface is tracked using a separate Lagrangian grid which consists of linked marker points (the front) moving with the local flow velocity interpolated from the stationary Eulerian grid. The piece of the Lagrangian grid between two marker points is called a front element. The interfacial surfactant concentration equation, (2.8), is solved on the Lagrangian grid using second-order centred differences for the spatial derivatives and a first-order Euler method for the time integration. The Lagrangian grid is also used to calculate the surface tension, which is then distributed onto the Eulerian grid points near the interface by using Peskin’s cosine distribution function (Peskin Reference Peskin1977), and added to the momentum equations as a body force as described by Tryggvason et al. (Reference Tryggvason, Bunner, Esmaeeli, Juric, Al-Rawahi, Tauber, Han, Nas and Jan2001).
The indicator function is computed at each time step based on the location of the interface using the standard procedure (Tryggvason et al. Reference Tryggvason, Bunner, Esmaeeli, Juric, Al-Rawahi, Tauber, Han, Nas and Jan2001) and is used to set the fluid properties in the liquid and gas phases. It is also utilized to compute the bulk surfactant concentration near the interface and to distribute the surfactant source terms onto the Eulerian grid in the adsorption layer (Muradoglu & Tryggvason Reference Muradoglu and Tryggvason2008).
The Lagrangian grid is restructured at every time step by deleting the front elements that are smaller than a prespecified lower limit and by splitting the front elements that are larger than a prespecified upper limit in the same way as described by Tryggvason et al. (Reference Tryggvason, Bunner, Esmaeeli, Juric, Al-Rawahi, Tauber, Han, Nas and Jan2001) to keep the front element size nearly uniform and comparable to the background Eulerian grid size. Restructuring the Lagrangian grid is crucial since it avoids unresolved wiggles due to small elements and lack of resolution due to large elements. Note that restructuring the Lagrangian grid is performed such that the mass conservation is strictly satisfied for the surfactant at the interface (Muradoglu & Tryggvason Reference Muradoglu and Tryggvason2008).
Unlike some other one-field approaches such as volume-of-fluid and level-set methods, the topological changes due to breakup and coalescence are not handled automatically in the front-tracking method (see e.g. Tryggvason, Scardovelli & Zaleski Reference Tryggvason, Scardovelli and Zaleski2011). Although it is possible to make it automated using the indicator function (Shin & Juric Reference Shin and Juric2002), we adopt a simpler procedure developed by Olgac, Kayaalp & Muradoglu (Reference Olgac, Kayaalp and Muradoglu2006) and assume that the liquid plug ruptures when the distance between the leading and trailing air fingers is smaller than a prespecified threshold value,
 $l_{th}$
. For this purpose, the distance between air fingers at the centreline is monitored during the simulations and when the distance becomes smaller than
 $\ell _{th}$
, the front element that is closest to the centreline on each air finger is deleted and then a new element is created to merge two air fingers by connecting the hanging marker points. In the present study, the threshold value is taken as
 $\ell _{th}=\unicode[STIX]{x0394}r$
, where
 $\unicode[STIX]{x0394}r$
is the grid size in the radial direction. As shown in appendix B, the results are not very sensitive to the choice of the threshold value as long as it is of the order of the grid size.
The front-tracking method was pioneered by Glimm and colleagues (Chern et al. Reference Chern, Glimm, McBryan, Plohr and Yaniv1986; Glimm et al. Reference Glimm, Graham, Grove, Li, Smith, Tan, Tangerman and Zhang1998) and readers are referred to Chern et al. (Reference Chern, Glimm, McBryan, Plohr and Yaniv1986), Glimm et al. (Reference Glimm, Graham, Grove, Li, Smith, Tan, Tangerman and Zhang1998), Unverdi & Tryggvason (Reference Unverdi and Tryggvason1992) and Tryggvason et al. (Reference Tryggvason, Bunner, Esmaeeli, Juric, Al-Rawahi, Tauber, Han, Nas and Jan2001) for the details of the method. A complete description of the treatment of the soluble surfactant can be found in Muradoglu & Tryggvason (Reference Muradoglu and Tryggvason2008, Reference Muradoglu and Tryggvason2014) and Tasoglu, Demirci & Muradoglu (Reference Tasoglu, Demirci and Muradoglu2008). The method has been rigorously validated and successfully used to study various flows involving thin films similar to the problem considered in this paper; see, for instance, Muradoglu & Stone (Reference Muradoglu and Stone2007) and Olgac & Muradoglu (Reference Olgac and Muradoglu2013a ,Reference Olgac and Muradoglu b ). The method is also validated for clean plug propagation and rupture and the results are presented in appendix A.
3 Problem statement
The physical problem is sketched in figure 1. The flow is assumed to be symmetric about the axis of the channel so the computational domain has dimensions of
 $R^{\ast }$
in the radial direction and
 $L_{z}^{\ast }$
in the axial direction. Flow is initially quiescent and the liquid plug is driven by an applied pressure difference between the front and the rear air fingers,
 $\unicode[STIX]{x0394}p^{\ast }=p_{1}^{\ast }-p_{2}^{\ast }$
. The plug is initially located at the airway centreline close to the inlet section with an initial length of
 $L_{pi}^{\ast }$
. The precursor and trailing liquid film thicknesses far from the plug are denoted as
 $h_{2}^{\ast }$
and
 $h_{1}^{\ast }$
, respectively, and they are initially set to be equal. The initial plug shape is approximated by hemispheres of radii of
 $R^{\ast }-h_{2}^{\ast }$
and
 $R^{\ast }-h_{1}^{\ast }$
for the front and rear menisci, respectively. No-slip boundary conditions are applied at the tube wall. The initial surfactant concentration in the liquid is prescribed to be
 $C_{0}^{\ast }$
and the interfacial surfactant concentration is initially in equilibrium with
 $C_{0}^{\ast }$
. At the precursor film far ahead of the plug, the bulk surfactant concentration is fixed to be
 $C_{0}^{\ast }$
.
The governing equations are solved in their dimensional forms but the results are presented in terms of relevant non-dimensional quantities. Following Fujioka & Grotberg (Reference Fujioka and Grotberg2005), the quantities are non-dimensionalized using the length scale
 ${\mathcal{L}}^{\ast }=R^{\ast }$
, the time scale
 ${\mathcal{T}}^{\ast }=\unicode[STIX]{x1D707}_{l}^{\ast }R^{\ast }/\unicode[STIX]{x1D70E}_{s}^{\ast }$
and the velocity scale
 ${\mathcal{V}}^{\ast }={\mathcal{L}}^{\ast }/{\mathcal{T}}^{\ast }=\unicode[STIX]{x1D70E}_{s}^{\ast }/\unicode[STIX]{x1D707}_{l}^{\ast }$
. Thus the non-dimensional velocity vector, pressure, bulk surfactant concentration and interfacial surfactant concentration are defined as
 $\boldsymbol{u}=\boldsymbol{u}^{\ast }/(\unicode[STIX]{x1D70E}_{s}^{\ast }/\unicode[STIX]{x1D707}_{l}^{\ast })$
,
 $p=p^{\ast }/(\unicode[STIX]{x1D70E}_{s}^{\ast }/R^{\ast })$
,
 $C=C^{\ast }/C_{cmc}^{\ast }$
and
 $\unicode[STIX]{x1D6E4}=\unicode[STIX]{x1D6E4}^{\ast }/\unicode[STIX]{x1D6E4}_{\infty }^{\ast }$
, respectively. Note that
 $C_{cmc}^{\ast }$
is the critical micelle concentration. The relevant non-dimensional numbers are then defined as
 $$\begin{eqnarray}\left.\begin{array}{@{}c@{}}\unicode[STIX]{x1D706}=\unicode[STIX]{x1D70C}_{l}^{\ast }\unicode[STIX]{x1D70E}_{s}^{\ast }R^{\ast }/\unicode[STIX]{x1D707}_{l}^{\ast 2},\quad \unicode[STIX]{x1D712}=\unicode[STIX]{x1D6E4}_{\infty }^{\ast }/(C_{cmc}^{\ast }R^{\ast }),\quad Sc=\unicode[STIX]{x1D707}_{l}^{\ast }/(\unicode[STIX]{x1D70C}_{l}^{\ast }D_{l}^{\ast }),\quad Sc_{s}=\unicode[STIX]{x1D707}_{l}^{\ast }/(\unicode[STIX]{x1D70C}_{l}^{\ast }D_{s}^{\ast }),\\ K_{a}=k_{a}^{\ast }C_{cmc}^{\ast }R^{\ast 2}/D_{s}^{\ast },\quad K_{d}=k_{d}^{\ast }R^{\ast 2}/D_{s}^{\ast },\quad L_{pi}=L_{p}^{\ast }/R^{\ast },\quad \unicode[STIX]{x0394}p=(p_{1}^{\ast }-p_{2}^{\ast })R^{\ast }/\unicode[STIX]{x1D70E}_{s}^{\ast },\end{array}\right\}\qquad\end{eqnarray}$$
where
 $\unicode[STIX]{x1D706}$
is the Laplace number,
 $\unicode[STIX]{x1D712}$
is the dimensionless adsorption depth,
 $Sc$
and
 $Sc_{s}$
are the bulk and interfacial Schmidt numbers, respectively,
 $K_{a}$
and
 $K_{d}$
are the dimensionless adsorption and desorption coefficients, respectively,
 $L_{pi}$
is the non-dimensional initial distance between the leading and trailing air fingers and
 $\unicode[STIX]{x0394}p$
is the dimensionless applied pressure difference.
Our study is focused on modelling plug rupture and airway reopening in adult human lungs. This phenomenon is prominent in surface-tension-dominated flows, i.e. when the airway radius is small enough. Owing to the bifurcation of bronchi and bronchioles, which reduce their radii each time as the airway splits, the required conditions are met from the seventh or eighth generation on, where the gravitational effects become negligible. Following Crystal (Reference Crystal1997), we assume
 $R^{\ast }\in [0.05,0.1]~\text{cm}$
as a typical range for the airway size of an adult lung airway at ninth to tenth generation. Another assumption of our model consists in positing that the bilayer liquid, which lines the airway wall and is formed by mucus and serous, can be conceptually homogenized in a Newtonian fluid with intermediate properties. This approach has recently been followed by Tai et al. (Reference Tai, Bian, Halpern, Zheng, Filoche and Grotberg2011), who took
 $\unicode[STIX]{x1D707}_{l}^{\ast }=0.13~\text{poise}$
,
 $\unicode[STIX]{x1D70C}_{l}^{\ast }=1~\text{g}~\text{m}^{-3}$
and
 $\unicode[STIX]{x1D70E}_{s}^{\ast }=20~\text{dyn}~\text{cm}^{-1}$
. The resulting Laplace number is
 $\unicode[STIX]{x1D706}=O(100)$
. We thus assume
 $\unicode[STIX]{x1D706}=100$
as the reference value.
For the pulmonary surfactants, the adsorption and the desorption kinetics are
 $k_{a}^{\ast }\approx 1.7\times 10^{3}~\text{cm}^{3}~\text{g}^{-1}~\text{s}^{-1}$
and
 $k_{d}^{\ast }\approx 1.7\times 10^{-2}~\text{s}^{-1}$
(Launois-Surpas et al.
Reference Launois-Surpas, Ivanova, Panaiotov, Proust, Puisieux and Georgiev1992; Otis et al.
Reference Otis, Ingenito, Kamm and Johnson1994), whereas the critical micelle bulk concentration
 $C_{cmc}^{\ast }\approx 10^{-3}~\text{g}~\text{cm}^{-3}$
. Agrawal & Neuman (Reference Agrawal and Neuman1988) measured the surface diffusivity of pulmonary surfactants as
 $D_{s}^{\ast }\in [1\times 10^{-7},7\times 10^{-7}]~\text{cm}^{2}~\text{s}^{-1}$
. Based on these values, the reference non-dimensional absorption and desorption rates are set to
 $K_{a}=10^{4}$
and
 $K_{d}=10^{2}$
. The maximum equilibrium interfacial concentration has been estimated by Schurch et al. (Reference Schurch, Bachofen, Goerke and Possmayer1989) for the pulmonary surfactants to be
 $\unicode[STIX]{x1D6E4}_{\infty }^{\ast }\approx 3.1\times 10^{-7}~\text{g}~\text{cm}^{-2}$
. Using this value as a reference, we predict the dimensionless adsorption depth to be
 $\unicode[STIX]{x1D712}\approx 0.01$
. Finally, we assume the elasticity number
 $\unicode[STIX]{x1D6FD}=0.7$
(Otis et al.
Reference Otis, Ingenito, Kamm and Johnson1994) and the Schmidt numbers
 $Sc_{s}=100$
and
 $Sc=10$
(Fujioka & Grotberg Reference Fujioka and Grotberg2005).
The effects of the surface viscosity and the disjoining pressure are not taken into account in the present study. The surface viscosity for the lung surfactant was measured by Meban (Reference Meban1978) to be in the range of
 $\unicode[STIX]{x1D707}^{s}=2\times 10^{-7}$
–
 $2.2\times 10^{-5}~\text{kg}~\text{s}^{-1}$
. More recently, Rudiger et al. (Reference Rudiger, Tolle, Meier and Rustow2005) reported that the surface viscosity of natural lung surfactant preparations is below
 $\unicode[STIX]{x1D707}^{s}\sim 5\times 10^{-6}~\text{kg}~\text{s}^{-1}$
, except for Survanta for which the surface viscosity varies greatly and can increase up to
 $\unicode[STIX]{x1D707}^{s}\sim 18\times 10^{-6}~\text{kg}~\text{s}^{-1}$
in very high concentrations. For
 $R^{\ast }=10^{-3}~\text{m}$
, the Boussinesq number (
 $Bq=\unicode[STIX]{x1D707}^{s}/\unicode[STIX]{x1D707}_{l}R^{\ast }$
) can be estimated to be in the range of
 $0.2<Bq<22$
. More recently, Zell et al. (Reference Zell, Nowbahar, Mansard, Leala, Deshmukh, Mecca, Tucker and Squires2014) have shown that the actual values of surface viscosity for common surfactants are actually several orders of magnitude smaller than those measured earlier, which suggests that it is reasonable to assume
 $Bq<1$
. Thus the effects of surface viscosity are expected to be minor as discussed recently by Gounley et al. (Reference Gounley, Boedec, Jaeger and Leonetti2016). We finally note that an extremely fine grid is required to resolve the effects of disjoining pressure, which is computationally infeasible even in the present axisymmetric simulations.
The elastic nature of airways is another mechanical property neglected in the present study. The entire airway tree consists of elastic tubes that become increasingly more flexible and compliant in the lower generations (Halpern & Grotberg Reference Halpern and Grotberg1992; Grotberg Reference Grotberg2011; Heil & Hazel Reference Heil and Hazel2011). The relative importance of the airway wall elasticity can be characterized by
 $\unicode[STIX]{x1D6E4}_{HH}=\unicode[STIX]{x1D70E}_{s}^{\ast }/R^{\ast }K^{\ast }$
, where
 $K^{\ast }=E^{\ast }/12(1-\unicode[STIX]{x1D708}^{2})(h_{w}^{\ast }/R^{\ast })^{3}$
is the flexural rigidity with
 $E^{\ast }$
,
 $\unicode[STIX]{x1D708}$
and
 $h_{w}^{\ast }$
being Young’s modulus, Poisson’s ratio and the thickness of the airway wall, respectively (Hazel & Heil Reference Hazel and Heil2003). This parameter represents the ratio of the surface tension forces to the bending stiffness of the airway wall. Following Halpern & Grotberg (Reference Halpern and Grotberg1992), the dimensional values for the ninth to tenth generation can be specified as
 $R^{\ast }=5\times 10^{-2}~\text{cm}$
,
 $E^{\ast }=6\times 10^{4}~\text{dyn}~\text{cm}^{-2}$
,
 $h_{w}^{\ast }=2.5\times 10^{-3}~\text{cm}$
and
 $\unicode[STIX]{x1D708}=0.5$
, which yields
 $\unicode[STIX]{x1D6E4}_{HH}=480\gg 1$
. As seen, the elasticity of the airway wall and resulting fluid–structure interactions are likely to be significant and need to be taken into account for more accurate modelling of pulmonary flow in the generations considered in the present study. Note that Halpern & Grotberg (Reference Halpern and Grotberg1992) define another non-dimensional parameter,
 $\unicode[STIX]{x1D6E4}_{HG}=(1-\unicode[STIX]{x1D708}^{2})\unicode[STIX]{x1D70E}_{s}^{\ast }/E^{\ast }h_{w}^{\ast }$
, which represents the ratio of surface-tension forces to elastic forces and is related to
 $\unicode[STIX]{x1D6E4}_{HH}$
as
 $\unicode[STIX]{x1D6E4}_{HG}=(1/12)(h_{w}^{\ast }/R^{\ast })^{2}\unicode[STIX]{x1D6E4}_{HH}$
. Using the same dimensional values, we obtain
 $\unicode[STIX]{x1D6E4}_{HG}=0.1$
confirming the significance of the tube elasticity.
4 Results and discussion
In this section, simulations are performed to examine the effects of surfactant on liquid plug propagation and rupture dynamics. All the computations are performed using tensor-product structured grids that are uniform in the axial direction and slightly stretched in the radial direction in order to better resolve the liquid film regions between the tube wall and air fingers. The stretching is done in such a way that the radial grid size,
 $\unicode[STIX]{x0394}r$
, is two times larger at the centreline than that at the tube wall. The computational domain extends
 $L_{z}^{\ast }=20R^{\ast }$
in the axial direction and the centre of the liquid plug is initially located at
 $z_{c}^{\ast }=2.95R^{\ast }$
. The present numerical method is validated against the previous computational studies of Fujioka et al. (Reference Fujioka, Takayama and Grotberg2008) and Hassan et al. (Reference Hassan, Uzgoren, Fujioka, Grotberg and Shyy2011) for a surfactant-free liquid plug propagation without and with a rupture, respectively. As discussed in appendix A, the present results are found to be in good agreement with the previous simulations performed using different numerical techniques. A comprehensive grid convergence study is also conducted to determine the minimum grid size to obtain grid-independent solutions. As detailed in appendix B, a grid resolution containing 96 cells in the radial direction is found to be sufficient to reduce the spatial discretization error below 3 %. Therefore this grid resolution is used in all the simulations presented here.
Time evolution of interfacial (left-hand part of each panel) and bulk (right-hand part of each panel) surfactant concentration for
 $C_{0}=5\times 10^{-5}$
. Snapshots are taken at times
 $t=$
(a) 49.33, (b) 202.39, (c) 240.90, (d) 241.47, (e) 242.10 and (f) 273.85. The dashed lines show the surface velocity of the interface. The surface velocity is computed with respect to the tip of the leading air finger before rupture (a–c). The intersection of the dashed lines with the interface indicates the stagnation points. (
 $L_{pi}=1.0$
,
 $\unicode[STIX]{x0394}p=1$
,
 $\unicode[STIX]{x1D706}=100$
,
 $\unicode[STIX]{x1D6FD}=0.7$
,
 $\unicode[STIX]{x1D712}=0.01$
,
 $Sc=10$
,
 $Sc_{s}=100$
,
 $K_{a}=10^{4}$
,
 $K_{d}=100$
.)

Time evolution of interface and pressure contours for a clean (left-hand side of each panel) and a contaminated (right-hand side of each panel) plug. Snapshots are taken at times
 $t-t_{rupture}=$
(a)
 $-167.62$
, (b)
 $-36.70$
, (c) 0, (d) 0.55, (e) 1.15, (f) 1.81, (g) 3.71, (h) 10.10 and (i) 39.19, where
 $t_{rupture}$
is the rupture time, which is 218.28 and 240.92 for the clean and contaminated cases, respectively. The dashed black lines show the surface velocity of the interface. The surface velocity is computed with respect to the tip of the leading air finger before the rupture (a–c). The intersection of the dashed lines with the interface indicates the stagnation points. The non-dimensional parameters are
 $L_{pi}=1.0$
,
 $\unicode[STIX]{x0394}p=1$
,
 $\unicode[STIX]{x1D706}=100$
for both the clean and the contaminated cases. The other parameters for the contaminated case are
 $C_{0}=5\times 10^{-5}$
,
 $\unicode[STIX]{x1D6FD}=0.7$
,
 $\unicode[STIX]{x1D712}=0.01$
,
 $Sc=10$
,
 $Sc_{s}=100$
,
 $K_{a}=10^{4}$
,
 $K_{d}=100$
.

The combined effects of the bulk surfactant concentration and the liquid film thickness. Time evolution of (a) plug length (
 $Lp$
), (b) maximum difference in wall pressure (
 $P_{max}-P_{min}$
), (c) minimum wall pressure (
 $P_{min}$
) and (d) maximum difference in wall shear stress (
 $\unicode[STIX]{x1D70F}_{max}-\unicode[STIX]{x1D70F}_{min}$
) is plotted for liquid film thickness of
 $h_{2}=0.05$
and
 $h_{2}=0.07$
, and for
 $C_{0}=0$
(clean) and
 $C_{0}=5\times 10^{-5}$
(contaminated) cases. (
 $L_{pi}=1.0$
,
 $\unicode[STIX]{x0394}p=1$
,
 $\unicode[STIX]{x1D706}=100$
,
 $\unicode[STIX]{x1D6FD}=0.7$
,
 $\unicode[STIX]{x1D712}=0.01$
,
 $Sc=10$
,
 $Sc_{s}=100$
,
 $K_{a}=10^{4}$
,
 $K_{d}=100$
.)

We first designate a baseline case to facilitate a systematic examination of the effects of various flow parameters. Based on the discussions in § 3, the baseline case is defined as
 $\unicode[STIX]{x0394}p=1$
,
 $L_{pi}=1.0$
,
 $\unicode[STIX]{x1D706}=100$
,
 $\unicode[STIX]{x1D712}=0.01$
,
 $Sc=10$
,
 $Sc_{s}=100$
,
 $K_{a}=10^{4}$
,
 $K_{d}=100$
and
 $\unicode[STIX]{x1D6FD}=0.7$
. Only one non-dimensional parameter is varied at a time. The bulk surfactant concentration of
 $C_{0}=5\times 10^{-5}$
is also used as the baseline value unless specified otherwise. Simulations are first performed for the base case and the evolutions of the bulk and interfacial surfactant concentrations are shown in figure 2 before and after plug rupture at non-dimensional times of
 $t=49.33$
, 202.39, 240.90, 241.47, 242.10 and 273.85. This figure shows that the interfacial surfactant accumulates on the front meniscus interface with a maximum concentration located around the stagnation point at the shoulder where the mechanical stresses are expected to be maximum and prone to cause significant damage to epithelial cells (Huh et al.
Reference Huh, Fujioka, Tung, Futai, Paine, Grotberg and Takayama2007). In other words, the interfacial surfactant accumulates where it is needed to protect the epithelium before and after the rupture takes place. In this figure, the surface velocity is also plotted as dashed lines to show the rigidification effect of the surfactant. Note that the surface velocity is defined as
 $U_{s}^{\ast }=\boldsymbol{u}_{r}^{\ast }\boldsymbol{\cdot }\boldsymbol{t}$
, where
 $\boldsymbol{t}$
is the unit tangent vector at the interface and
 $\boldsymbol{u}_{r}^{\ast }$
is the relative velocity of the interface with respect to the frame moving with the tip of the leading air finger and the laboratory frame before and after the rupture, respectively. The surface velocity is non-dimensionalized as
 $U_{s}=\unicode[STIX]{x1D707}_{l}^{\ast }U_{s}^{\ast }/\unicode[STIX]{x1D70E}^{\ast }$
. As seen, the surfactant-induced Marangoni stresses immobilize where the surfactant is accumulated. The interfacial surfactant also accumulates on the interface of the trailing meniscus near the centreline but with a concentration about an order of magnitude smaller compared to that on the front meniscus. The effects of the surfactant on the mechanical stresses are shown in figure 3 where the time evolutions of the constant contours of the pressure in the plug region are plotted side by side for the clean and the contaminated cases. Since the clean plug ruptures earlier, the snapshots are taken at times
 $t-t_{rupture}=-167.62$
,
 $-36.70$
, 0.0, 0.55, 1.15, 1.81, 3.71, 10.10 and 39.19, where
 $t_{rupture}$
is the rupture time, which is 216.41 and 238.54 for the clean and contaminated cases, respectively. This figure qualitatively shows that even a small amount of surfactant can significantly reduce the pressure on the wall, i.e. the maximum magnitude of the wall pressure is reduced as much as 15 % and 22 % before and after the rupture, respectively. In addition, the larger negative wall pressure in the clean case indicates that the surfactant-deficient airways are more prone to collapse during the plug rupture process. The surface velocities are also plotted as dashed lines in this figure. The rigidification effect of the surfactant is better seen in this figure, i.e. the interface velocity reduces in the contaminated case as the surfactant accumulates at the interface and the interface of the leading air finger becomes almost completely immobilized before the plug ruptures. The surfactant-induced rigidification of the interface is believed to be the main mechanism responsible for stabilization of the thinning film and inhibition of coalescence of interfaces (plug rupture) as discussed recently by Soligo, Roccon & Soldati (Reference Soligo, Roccon and Soldati2019).
The effects of the surfactant are quantified in figure 4 where the time evolutions of the plug length, the maximum difference in wall pressure, the minimum wall pressure and the maximum difference in wall shear stress are plotted for the clean and contaminated interfaces. Simulations are performed for precursor film thickness of
 $h_{2}=0.05$
and
 $h_{2}=0.07$
to demonstrate how the precursor film thickness influences the plug motion and rupture in the clean and contaminated cases. As seen, the plug rupture results in sudden jumps in the wall pressure and wall shear stress, and the surfactant reduces the magnitude of the mechanical stresses significantly for both values of the precursor liquid film thickness. The plug ruptures earlier and the wall pressure and wall shear stress variations become larger when the initial precursor film is thinner as also observed by Fujioka et al. (Reference Fujioka, Takayama and Grotberg2008) and Hassan et al. (Reference Hassan, Uzgoren, Fujioka, Grotberg and Shyy2011). It is also interesting to see that the surfactant generally delays the plug rupture, which indicates that excessive surfactant delays and may even prevent airway reopening, as will be discussed in detail below.
Effects of bulk surfactant concentration on plug propagation and rupture in the range
 $C_{0}=0$
(clean) to
 $C_{0}=5\times 10^{-4}$
(highly contaminated). Time evolution of (a) plug length (
 $L_{p}$
), (b) maximum difference in wall pressure (
 $P_{max}-P_{min}$
) and (c) maximum difference in wall shear stress (
 $\unicode[STIX]{x1D70F}_{max}-\unicode[STIX]{x1D70F}_{min}$
). (
 $L_{pi}=1.0$
,
 $h_{2}=0.05$
,
 $\unicode[STIX]{x0394}p=1$
,
 $\unicode[STIX]{x1D706}=100$
,
 $\unicode[STIX]{x1D6FD}=0.7$
,
 $\unicode[STIX]{x1D712}=0.01$
,
 $Sc=10$
,
 $Sc_{s}=100$
,
 $K_{a}=10^{4}$
,
 $K_{d}=100$
.)

Effects of bulk surfactant concentration on (a) the interfacial surfactant concentration and Marangoni stress distributions and (b) surface velocity distribution at
 $t=t_{rupture}$
for
 $C_{0}\leqslant 2.5\times 10^{-4}$
and at
 $t=453.5$
for
 $C_{0}=5\times 10^{-4}$
. (
 $L_{pi}=1.0$
,
 $h_{2}=0.05$
,
 $\unicode[STIX]{x0394}p=1$
,
 $\unicode[STIX]{x1D706}=100$
,
 $\unicode[STIX]{x1D6FD}=0.7$
,
 $\unicode[STIX]{x1D712}=0.01$
,
 $Sc=10$
,
 $Sc_{s}=100$
,
 $K_{a}=10^{4}$
,
 $K_{d}=100$
.)

The time evolution of the minimum radius of the neck and its time derivative (‘snap velocity’) after rupture. (
 $L_{pi}=1.0$
,
 $h_{2}=0.05$
,
 $\unicode[STIX]{x0394}p=1$
,
 $\unicode[STIX]{x1D706}=100$
,
 $\unicode[STIX]{x1D6FD}=0.7$
,
 $\unicode[STIX]{x1D712}=0.01$
,
 $Sc=10$
,
 $Sc_{s}=100$
,
 $K_{a}=10^{4}$
,
 $K_{d}=100$
.)

Wall pressure and wall shear stress distributions for a clean plug (
 $C_{0}=0$
) (a,b), a mildly contaminated plug (
 $C_{0}=5\times 10^{-5}$
) (c,d) and a highly contaminated plug (
 $C_{0}=10^{-4}$
) (e,f). (
 $L_{pi}=1.0$
,
 $h_{2}=0.05$
,
 $\unicode[STIX]{x0394}p=1$
,
 $\unicode[STIX]{x1D706}=100$
,
 $\unicode[STIX]{x1D6FD}=0.7$
,
 $\unicode[STIX]{x1D712}=0.01$
,
 $Sc=10$
,
 $Sc_{s}=100$
,
 $K_{a}=10^{4}$
,
 $K_{d}=100$
.)

Effects of elasticity number on plug propagation and rupture in the range
 $\unicode[STIX]{x1D6FD}=0$
to
 $\unicode[STIX]{x1D6FD}=1.5$
. Time evolution of (a) plug length (
 $L_{p}$
), (b) maximum difference in wall pressure (
 $P_{max}-P_{min}$
) and (c) maximum difference in wall shear stress (
 $\unicode[STIX]{x1D70F}_{max}-\unicode[STIX]{x1D70F}_{min}$
). (
 $L_{pi}=1.0$
,
 $h_{2}=0.05$
,
 $\unicode[STIX]{x0394}p=1$
,
 $\unicode[STIX]{x1D706}=100$
,
 $\unicode[STIX]{x1D712}=0.01$
,
 $Sc=10$
,
 $Sc_{s}=100$
,
 $K_{a}=10^{4}$
,
 $K_{d}=100$
,
 $C_{0}=10^{-4}$
.)

We next examine the effects of bulk surfactant concentration on plug propagation and rupture. For this purpose, simulations are performed for various bulk surfactant concentrations in the range
 $C_{0}=0$
(clean) to
 $C_{0}=5\times 10^{-4}$
(highly contaminated), and the results are shown in figures 5–7. Figure 5 shows the time evolutions of the plug length (
 $L_{p}$
), the maximum difference in the wall pressure (
 $P_{max}-P_{min}$
) and the maximum difference in the wall shear stress (
 $\unicode[STIX]{x1D70F}_{max}-\unicode[STIX]{x1D70F}_{min}$
). As seen, rupture is delayed and the mechanical stresses on the wall are reduced significantly as
 $C_{0}$
is increased, and rupture is prevented completely after
 $C_{0}\geqslant 5\times 10^{-4}$
. The distributions of the interfacial surfactant concentration (
 $\unicode[STIX]{x1D6E4}$
), the Marangoni stress (
 $\unicode[STIX]{x1D70F}_{M}$
) and the surface velocity (
 $U_{s}$
) are also plotted in figure 6 just after the plug ruptures, i.e. at
 $t=t_{rupture}$
with
 $t_{rupture}$
being the rupture time, as a function of the arclength (
 $s$
) measured from the centreline in the clockwise and counterclockwise directions for the leading and trailing fingers, respectively. Note that the arclength of the trailing air finger is made negative to distinguish it from that of the leading air finger as sketched in figure 1. When the liquid plug ruptures, a negative arclength denotes a point on the interface whose axial location
 $z_{p}$
is smaller than the axial location of the rupture point
 $z_{rupture}$
. Note that the Marangoni stress is defined as
 $\unicode[STIX]{x1D70F}_{M}^{\ast }=\unicode[STIX]{x2202}\unicode[STIX]{x1D70E}^{\ast }/\unicode[STIX]{x2202}s^{\ast }$
. As seen, the pressure and viscous shear stress on the tube wall are monotonically reduced when the bulk surfactant concentration is increased mainly due to accumulation of more interfacial surfactant at the rear edge of the leading air finger close to the wall. As
 $C_{0}$
increases, the interfacial surfactant concentration increases on both the front and the trailing meniscus interfaces but the increase is more dramatic for the front meniscus. At low concentrations, the interfacial surfactant is largely accumulated at the back shoulder of the leading air finger and the interfacial surfactant distribution gets wider and eventually covers the entire interface of the front meniscus as the bulk concentration increases. The Marangoni stresses oppose the viscous shear stresses, and thus reduce the mobility of the interface, which is known as the rigidification effect of surfactant as first explained consistently by Frumkin & Levich (Reference Frumkin and Levich1947). The immobilization effect of surfactant is shown in figure 6(b) where the interfacial surfactant concentration and surface velocity distributions are plotted for the various values of bulk surfactant concentration. As can be seen in this figure, the surface velocity decreases monotonically as
 $C_{0}$
increases and the meniscus interface is immobilized almost completely for
 $C_{0}\geqslant 2.5\times 10^{-4}$
. When the plug ruptures, the interface retracts quickly towards the airway wall. The effects of surfactant on the retraction of the interface are shown in figure 7 where the time evolutions of the minimum radius of the interface
 $R_{min}$
and the snap velocity
 $V_{snap}$
defined as
 $V_{snap}=\text{d}R_{min}/\text{d}t$
are plotted after the rupture. This figure shows that the surfactant does not have a significant effect on retraction when
 $C_{0}\leqslant 5\times 10^{-5}$
but the retraction velocity reduces slightly as
 $C_{0}$
is further increased. Figure 8 illustrates the variation of the wall pressure and the wall shear stress at various times before and after the plug ruptures for clean (
 $C_{0}=0$
), mildly contaminated (
 $C_{0}=5\times 10^{-5}$
) and highly contaminated (
 $C_{0}=10^{-4}$
) cases. Since plugs rupture at different axial locations, the axial coordinate is shifted by the rupture point
 $z_{rupture}$
to facilitate a direct comparison. As can be seen in this figure, not only the magnitudes but also the gradients of the wall pressure and wall shear stress become large especially near the leading and trailing menisci and are amplified significantly by the plug rupture. Note that the gradients of the mechanical stresses are as important as their magnitudes in potentially injuring cells (Glindmeyer, Smith & Gaver Reference Glindmeyer, Smith and Gaver2012). Figure 8 also shows that the surfactant generally reduces both magnitude and gradient of mechanical stresses on the wall and its effects are amplified as more surfactant is added to the plug liquid. These results confirm the experimental findings of Bilek et al. (Reference Bilek, Dee and Gaver2003) that flow-induced cell injuries can be abated completely by adding more surfactant into the liquid plug. However, the surfactant comes with a side effect: it also delays the plug rupture significantly implying that an excessive amount of surfactant may even prevent airway reopening. Therefore there must be a just sufficient amount of pulmonary surfactant for the best functioning of the lungs. Note that surfactant reduces the mechanical stresses by two mechanisms: (i) the Marangoni stresses due to surface tension gradient, which effectively rigidifies the interface, and (ii) the reduction in the Laplace pressure due to the reduction in surface tension, which consequently reduces the pressure in the liquid near the plug’s meniscus, as seen in figure 8.
The elasticity number may be considered as the strength of the surfactant, so it is expected to have a similar effect on plug propagation and rupture as does the bulk surfactant concentration. This is verified in figure 9 where the results are plotted for the bulk surfactant concentration of
 $C_{0}=10^{-4}$
and various values of the elasticity number while keeping the other parameters the same as the baseline case. Note that the bulk surfactant concentration is taken to be much larger than the baseline value in order to see significant surfactant effects even for a small value of the elasticity number. As seen in this figure, the mechanical stresses are reduced and plug rupture is delayed as the elasticity number is increased. Figure 10 shows that the interfacial surfactant is accumulated and narrowly distributed on the shoulder of the leading air finger rendering a large part of the interface nearly clean at small elasticity numbers. The distribution gets wider as the elasticity number increases and eventually covers the entire back side of the leading air finger resembling the case with an excessive bulk surfactant concentration in figure 5. The interface mobility is reduced monotonically as
 $\unicode[STIX]{x1D6FD}$
increases, and the interface of the leading and trailing menisci immobilizes almost completely for
 $\unicode[STIX]{x1D6FD}\geqslant 1$
showing the rigidification effect of surfactant.
Effects of elasticity number on the interfacial surfactant concentration and surface velocity distributions at
 $t=t_{rupture}$
for
 $\unicode[STIX]{x1D6FD}\leqslant 1$
and at
 $t=316.2$
for
 $\unicode[STIX]{x1D6FD}=1.5$
. (
 $L_{pi}=1.0$
,
 $h_{2}=0.05$
,
 $\unicode[STIX]{x0394}p=1$
,
 $\unicode[STIX]{x1D706}=100$
,
 $\unicode[STIX]{x1D712}=0.01$
,
 $Sc=10$
,
 $Sc_{s}=100$
,
 $K_{a}=10^{4}$
,
 $K_{d}=100$
,
 $C_{0}=10^{-4}$
.)

We next perform simulations to investigate the effects of the applied pressure difference,
 $\unicode[STIX]{x0394}p$
, and the Laplace number,
 $\unicode[STIX]{x1D706}$
, on the rupture dynamics for the clean and contaminated cases. The pressure difference drives the flow and determines the speed of the plug while the Laplace number accounts for the combination of inertia, tube size (curvature), surface tension and viscous effects. Thus they both influence the fluid dynamics of the plug motion and rupture. First,
 $\unicode[STIX]{x0394}p$
is varied in the range
 $\unicode[STIX]{x0394}p=0.75$
to
 $\unicode[STIX]{x0394}p=3$
while keeping all the other non-dimensional parameters the same as the baseline case. The bulk surfactant concentration is
 $C_{0}=10^{-4}$
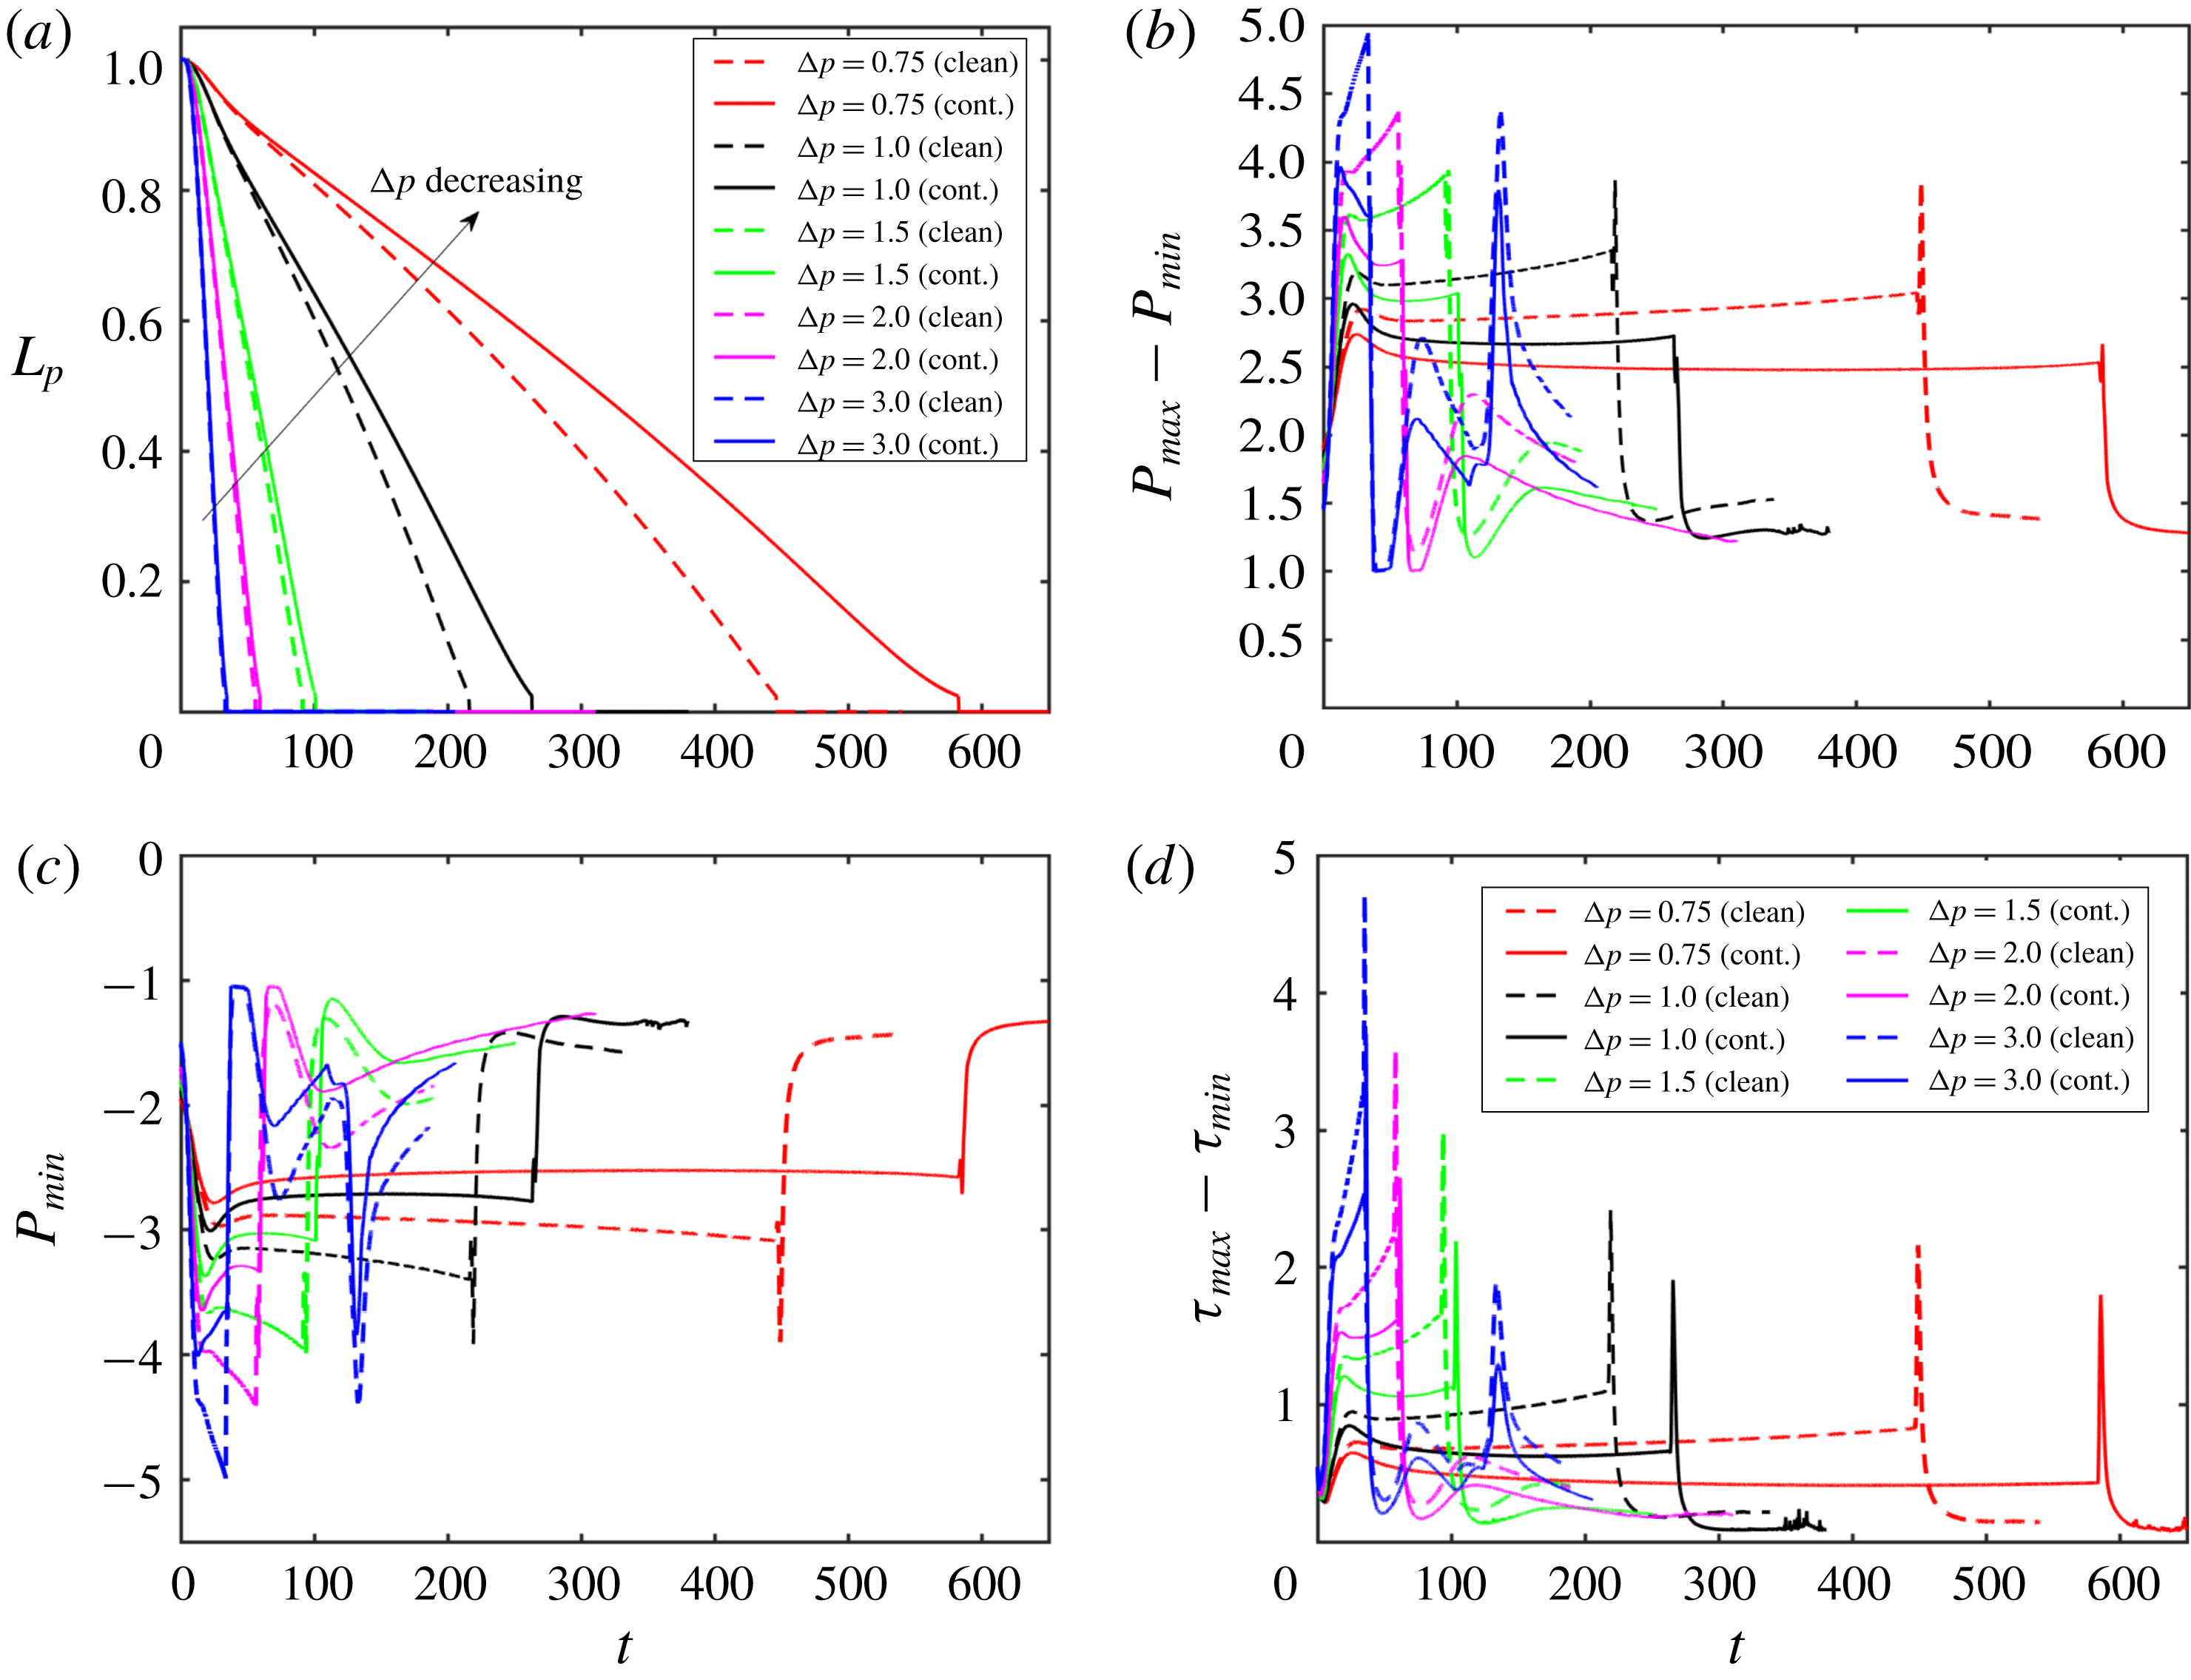
for the contaminated case. Figure 11 shows that both the clean and the contaminated plugs rupture earlier as
 $\unicode[STIX]{x0394}p$
increases. Increasing
 $\unicode[STIX]{x0394}p$
makes the trailing air finger move faster and thus the trailing liquid film thicker, which enhances the volume loss of the liquid plug to rupture sooner. In addition, the mechanical stresses are also intensified monotonically with increasing
 $\unicode[STIX]{x0394}p$
, implying an increased risk of cell injuries during the airway reopening process in deep breathing. Addition of surfactant reduces the mechanical stresses on the tube wall but it also delays plug rupture for all values of
 $\unicode[STIX]{x0394}p$
as expected. It is also interesting to observe that the effects of surfactant are more pronounced as
 $\unicode[STIX]{x0394}p$
is reduced. This can be attributed to the fact that the Marangoni stress becomes more dominant over the viscous stresses as flow velocity and thus viscous stresses decrease with decreasing
 $\unicode[STIX]{x0394}p$
. Plug rupture does not occur at very low values of
 $\unicode[STIX]{x0394}p$
. We then carry out computations to investigate the influence of the Laplace number on clean and contaminated plug rupture dynamics in the range
 $20\leqslant \unicode[STIX]{x1D706}\leqslant 1500$
with the other parameters held constant at their baseline values. The Laplace number is varied by changing the density of the liquid to show the effects of inertia. Figure 12 shows the effects of the Laplace number on rupture time and mechanical stresses on the airway wall. The inertial effects are clearly seen in figure 12(a) especially in the initial stage at high
 $\unicode[STIX]{x1D706}$
values, i.e.
 $\unicode[STIX]{x1D706}\geqslant 500$
. Plug rupture is delayed as
 $\unicode[STIX]{x1D706}$
increases and plug rupture does not occur after about
 $\unicode[STIX]{x1D706}\geqslant 2000$
in the present case. The effects of inertia are better reflected on the retraction of the interface after rupture as shown in figure 13. As seen, the retraction velocity
 $V_{snap}$
decreases significantly as
 $\unicode[STIX]{x1D706}$
increases mainly due to enhanced inertial effects. In general, the mechanical stresses increase as
 $\unicode[STIX]{x1D706}$
increases. The surfactant has effects similar to those before: it reduces the mechanical stresses and slows down airway reopening.
Effects of applied pressure difference (
 $\unicode[STIX]{x0394}p=p_{1}-p_{2}$
) on plug propagation and rupture. Time evolution of (a) plug length (
 $L_{p}$
), (b) maximum difference in wall pressure (
 $P_{max}-P_{min}$
), (c) the minimum pressure on the wall and (d) maximum difference in wall shear stress (
 $\unicode[STIX]{x1D70F}_{max}-\unicode[STIX]{x1D70F}_{min}$
) for the applied pressure difference in the range
 $0.75\leqslant \unicode[STIX]{x0394}p\leqslant 3$
. (
 $L_{pi}=1.0$
,
 $h_{2}=0.05$
,
 $\unicode[STIX]{x1D706}=100$
,
 $\unicode[STIX]{x1D6FD}=0.7$
,
 $\unicode[STIX]{x1D712}=0.01$
,
 $Sc=10$
,
 $Sc_{s}=100$
,
 $K_{a}=10^{4}$
,
 $K_{d}=100$
,
 $C_{0}=10^{-4}$
.)
Effects of the Laplace number (
 $\unicode[STIX]{x1D706}$
) on plug propagation and rupture. Time evolution of (a) plug length (
 $L_{p}$
), (b) maximum difference in wall pressure (
 $P_{max}-P_{min}$
) and (c) maximum difference in wall shear stress (
 $\unicode[STIX]{x1D70F}_{max}-\unicode[STIX]{x1D70F}_{min}$
) for the Laplace number in the range
 $20\leqslant \unicode[STIX]{x1D706}\leqslant 1500$
. The solid and dashed lines show the clean and the contaminated cases, respectively. (
 $L_{pi}=1.0$
,
 $h_{2}=0.05$
,
 $\unicode[STIX]{x0394}p=1$
,
 $\unicode[STIX]{x1D6FD}=0.7$
,
 $\unicode[STIX]{x1D712}=0.01$
,
 $Sc=10$
,
 $Sc_{s}=100$
,
 $K_{a}=10^{4}$
,
 $K_{d}=100$
,
 $C_{0}=10^{-4}$
.)

Effects of the Laplace number (
 $\unicode[STIX]{x1D706}$
) on the retraction of the interface after plug rupture for the Laplace number in the range
 $20\leqslant \unicode[STIX]{x1D706}\leqslant 1500$
. The solid and dashed lines show the clean and the contaminated cases, respectively. (
 $L_{pi}=1.0$
,
 $h_{2}=0.05$
,
 $\unicode[STIX]{x0394}p=1$
,
 $\unicode[STIX]{x1D6FD}=0.7$
,
 $\unicode[STIX]{x1D712}=0.01$
,
 $Sc=10$
,
 $Sc_{s}=100$
,
 $K_{a}=10^{4}$
,
 $K_{d}=100$
,
 $C_{0}=10^{-4}$
.)

Effects of the non-dimensional adsorption and desorption coefficients on plug propagation and rupture. Time evolution of (a) plug length (
 $L_{p}$
), (b) maximum difference in wall pressure (
 $P_{max}-P_{min}$
) and (c) maximum difference in wall shear stress (
 $\unicode[STIX]{x1D70F}_{max}-\unicode[STIX]{x1D70F}_{min}$
). (
 $L_{pi}=1.0$
,
 $h_{2}=0.05$
,
 $C_{0}=10^{-4}$
,
 $\unicode[STIX]{x0394}p=1$
,
 $\unicode[STIX]{x1D706}=100$
,
 $\unicode[STIX]{x1D6FD}=0.7$
,
 $\unicode[STIX]{x1D712}=0.01$
,
 $Sc=10$
,
 $Sc_{s}=100$
.)

Further simulations are performed to examine the effects of the non-dimensional adsorption and desorption coefficients (
 $K_{a}$
and
 $K_{d}$
), Schmidt numbers (
 $Sc$
and
 $Sc_{s}$
) and the dimensionless adsorption depth (
 $\unicode[STIX]{x1D712}$
). The non-dimensional adsorption and desorption coefficients are varied together such that their ratio is constant at
 $K_{a}/K_{d}=100$
and the other parameters are fixed at their baseline values. Note that the vanishing values of
 $K_{a}$
and
 $K_{b}$
correspond to the insoluble case that will be discussed later separately. Simulations are performed for values of
 $(K_{a},K_{d})=(10^{3},10)$
,
 $(10^{4},10^{2})$
and
 $(10^{5},10^{3})$
, and the results are shown in figures 14 and 15. As seen in figure 15, the surfactant concentration is reduced significantly at the interface of the leading meniscus as
 $K_{a}$
and
 $K_{d}$
are increased since the concentration exceeds the equilibrium value (e.g.
 $\unicode[STIX]{x1D6E4}_{eq}\approx 0.01$
) there and is released back into the bulk liquid more quickly at higher values of
 $K_{a}$
and
 $K_{d}$
. As a result, the overall effect of the surfactant is decreased as
 $K_{a}$
and
 $K_{d}$
are increased (figure 14). We then investigate the effects of molecular diffusivity. Enhanced molecular diffusivity smooths the interfacial surfactant distribution more effectively and thus reduces the Marangoni stresses. It is therefore expected that the effect of surfactant increases as the Schmidt number increases, which is confirmed in figure 16 where the simulation results are shown for Schmidt numbers in the range
 $1\leqslant Sc\leqslant 100$
and
 $10\leqslant Sc_{s}\leqslant 1000$
together with the results obtained for the clean case. This figure shows that the plug rupture is delayed and the mechanical stresses are reduced as the Schmidt number is increased. The adsorption depth characterizes the depth beneath the interface diluted by surfactant adsorption and it decreases as the bulk surfactant concentration
 $C_{0}$
increases. Therefore increasing
 $\unicode[STIX]{x1D712}$
is expected to have a qualitatively similar effect to decreasing
 $C_{0}$
. Figure 17 shows the effects of the adsorption depth on the plug rupture and the maximum difference in wall pressure in the range
 $0.001\leqslant \unicode[STIX]{x1D712}\leqslant 1$
. As seen, plug rupture is slightly delayed and the maximum difference in wall pressure is slightly decreased with increasing
 $\unicode[STIX]{x1D712}$
. Although not shown here, the shear stress is also reduced slightly as
 $\unicode[STIX]{x1D712}$
is increased.
Effects of the non-dimensional adsorption and desorption coefficients on interfacial surfactant concentration and surface velocity distributions at
 $t=t_{rupture}$
. (
 $L_{pi}=1.0$
,
 $h_{2}=0.05$
,
 $C_{0}=10^{-4}$
,
 $\unicode[STIX]{x0394}p=1$
,
 $\unicode[STIX]{x1D706}=100$
,
 $\unicode[STIX]{x1D6FD}=0.7$
,
 $\unicode[STIX]{x1D712}=0.01$
,
 $Sc=10$
,
 $Sc_{s}=100$
.)

Effects of the Schmidt numbers on plug propagation and rupture. Time evolution of (a) plug length (
 $L_{p}$
), (b) maximum difference in wall pressure (
 $P_{max}-P_{min}$
) and (c) maximum difference in wall shear stress (
 $\unicode[STIX]{x1D70F}_{max}-\unicode[STIX]{x1D70F}_{min}$
). (
 $L_{pi}=1.0$
,
 $h_{2}=0.05$
,
 $C_{0}=10^{-4}$
,
 $\unicode[STIX]{x0394}p=1$
,
 $\unicode[STIX]{x1D706}=100$
,
 $\unicode[STIX]{x1D6FD}=0.7$
,
 $\unicode[STIX]{x1D712}=0.01$
,
 $K_{a}=10^{4}$
,
 $K_{d}=100$
.)

Time evolution of the plug length (
 $L_{p}$
) for various values of dimensionless adsorption depth (
 $\unicode[STIX]{x1D712}$
). The inset shows time evolution of maximum difference in wall pressure (
 $P_{max}-P_{min}$
). (
 $L_{pi}=1.0$
,
 $h_{2}=0.05$
,
 $C_{0}=10^{-4}$
,
 $\unicode[STIX]{x0394}p=1$
,
 $\unicode[STIX]{x1D706}=100$
,
 $\unicode[STIX]{x1D6FD}=0.7$
,
 $Sc=10$
,
 $Sc_{s}=100$
,
 $K_{a}=10^{4}$
,
 $K_{d}=100$
.)

Effects of surfactant solubility. Time evolution of (a) plug length (
 $L_{p}$
), (b) maximum difference in wall pressure (
 $P_{max}-P_{min}$
) and (c) maximum difference in wall shear stress (
 $\unicode[STIX]{x1D70F}_{max}-\unicode[STIX]{x1D70F}_{min}$
). (d) The interface surfactant concentration and Marangoni stress distributions at
 $t-t_{rupture}=0.52$
for
 $C_{0}\leqslant 5\times 10^{-4}$
, and at
 $t=452.84$
and
 $t=605.89$
for
 $C_{0}=5\times 10^{-4}$
for the soluble and insoluble cases, respectively. For the insoluble cases,
 $C_{0}$
is used to determine the initial equilibrium concentration at the interface. (
 $L_{pi}=1.0$
,
 $h_{2}=0.05$
,
 $\unicode[STIX]{x0394}p=1$
,
 $\unicode[STIX]{x1D6FD}=0.7$
,
 $\unicode[STIX]{x1D712}=0.01$
,
 $Sc=10$
,
 $Sc_{s}=100$
,
 $K_{a}=10^{4}$
,
 $K_{d}=100$
,
 $C_{0}=10^{-4}$
.)

In many theoretical and numerical studies, surfactant solubility is ignored to simplify the analysis. We finally examine the effects of surfactant solubility on plug rupture dynamics. For this purpose, the adsorption and desorption coefficients are set to zero, i.e.
 $k_{a}^{\ast }=k_{d}^{\ast }=0$
, and computations are carried out for the bulk surfactant concentration in the range
 $10^{-5}\leqslant C_{0}\leqslant 5\times 10^{-4}$
. The results are shown in figure 18 where the fully soluble simulation results obtained using the baseline parameters are also plotted to facilitate a direct comparison. As seen, the surfactant solubility becomes more pronounced as the bulk surfactant concentration increases. Since the overall effect of surfactant is small at a very small bulk concentration (e.g. at
 $C_{0}=10^{-5}$
) as seen in figure 5, it is safe to say that the surfactant solubility is generally important and should be taken into account in a plug rupture analysis.
5 Conclusions
Effects of surfactant on liquid plug propagation and rupture in a liquid-lined tube are studied computationally as a model for airway reopening. The flow equations are solved fully coupled with the bulk and interfacial surfactant concentration evolution equations in both phases using a front-tracking method. The numerical method is validated for a clean liquid plug propagation without and with a rupture against the previous numerical studies of Fujioka et al. (Reference Fujioka, Takayama and Grotberg2008) and Hassan et al. (Reference Hassan, Uzgoren, Fujioka, Grotberg and Shyy2011), respectively. Then extensive simulations are carried out to investigate the effects of the bulk surfactant concentration, the elasticity number, the applied pressure difference, the Laplace number and surfactant solubility on liquid plug rupture dynamics and the flow-induced mechanical stresses on the tube wall.
It is found that surfactant generally reduces the pressure and shear stress on the tube wall before and after plug rupture occurs and this effect is more pronounced as either amount or strength of surfactant increases, which confirms the protective role of pulmonary surfactant for epithelial cells. The pre-existing interfacial surfactant adsorbed on the precursor film is swept by the front meniscus as the plug moves through the tube and the surfactant accumulates on the front meniscus interface with the maximum concentration at the stagnation point on the shoulder of the leading air finger. The non-uniform distribution of the interfacial surfactant concentration results in large Marangoni stress on the precursor film near the front meniscus, which counteracts the viscous shear stresses and reduces the mobility of the liquid–air interface. When the interfacial surfactant concentration exceeds the equilibrium value, it is released back into the liquid plug creating high bulk surfactant concentration in the vicinity of the stagnation point at the shoulder. The interfacial surfactant concentration is narrowly distributed near the stagnation point at a low bulk surfactant concentration and its distribution gets wider and eventually covers the entire interface of the front meniscus as bulk surfactant concentration increases. Increasing the elasticity number is found to have an effect similar to that of increasing the bulk surfactant concentration. The mechanical stresses are monotonically reduced as either the bulk surfactant concentration or the elasticity number increases, which strongly supports the hypotheses that the pulmonary surfactant protects the epithelium from flow-induced injury during airway reopening. However, the surfactant comes with a side effect: it generally delays and can even prevent plug rupture and thus airway reopening. The present study shows that neither lack nor excess of pulmonary surfactant is desirable. The lungs perform best in the presence of a just sufficient amount and strength of surfactant.
The applied pressure difference (
 $\unicode[STIX]{x0394}p$
) and the Laplace number (
 $\unicode[STIX]{x1D706}$
) influence the plug rupture dynamics similarly but in an opposite way. The mechanical stresses increase while the rupture time decreases as the applied pressure difference increases or the Laplace number decreases. It is found that the plug does not rupture when
 $\unicode[STIX]{x0394}p$
is reduced below or
 $\unicode[STIX]{x1D706}$
is increased above a critical value. Addition of surfactant reduces the mechanical stresses and delays plug rupture for all values of the applied pressure difference and the Laplace number. The non-dimensional adsorption and desorption coefficients, the bulk and interfacial Schmidt numbers and the adsorption depth are found to have moderate effects on plug rupture dynamics.
Finally the effects of surfactant solubility are investigated. It is found that the solubility is significant whenever the surfactant has a significant influence on the plug propagation and rupture dynamics. Insoluble surfactant model generally results in excessive interfacial surfactant concentration especially near the stagnation point at the shoulder of the leading air finger, which results in underprediction of the mechanical stresses and overprediction of the rupture time.
Acknowledgements
This work is partly supported by the NIH under grant no. HL136141. The first author (M.M.) is supported by the Scientific and Technical Research Council of Turkey (TUBITAK) under grant no. 115M688.
Appendix A. Validation
Validation for the clean interface case. The evolution of (a) plug length, (b) maximum difference in wall pressure (
 $P_{max}-P_{min}$
), (c) maximum difference in wall shear stresses (
 $\unicode[STIX]{x1D70F}_{max}-\unicode[STIX]{x1D70F}_{min}$
) and (d) minimum wall shear stress (
 $\unicode[STIX]{x1D70F}_{min}$
) for precursor film thicknesses of
 $h_{2}=0.05$
and
 $h_{2}=0.07$
. The present results are compared with the computational results of Fujioka et al. (Reference Fujioka, Takayama and Grotberg2008) and Hassan et al. (Reference Hassan, Uzgoren, Fujioka, Grotberg and Shyy2011). (
 $L_{pi}=1.0$
,
 $\unicode[STIX]{x0394}P=1$
,
 $\unicode[STIX]{x1D706}=1000$
.)

The numerical method is first validated for the motion and rupture of a liquid plug in the absence of surfactant, i.e.
 $C_{0}=0$
. To facilitate direct comparison with the previous numerical simulations, the flow parameters are set to
 $\unicode[STIX]{x0394}p=1$
,
 $L_{pi}=1.0$
,
 $\unicode[STIX]{x1D706}=1000$
,
 $\unicode[STIX]{x1D707}_{g}^{\ast }/\unicode[STIX]{x1D707}_{l}^{\ast }=0.01$
and
 $\unicode[STIX]{x1D70C}_{g}^{\ast }/\unicode[STIX]{x1D70C}_{l}^{\ast }=0.02$
. Simulations are performed for precursor film thicknesses of
 $h_{2}=0.05$
and
 $h_{2}=0.07$
, and the results are compared with the computational results of Fujioka et al. (Reference Fujioka, Takayama and Grotberg2008) and Hassan et al. (Reference Hassan, Uzgoren, Fujioka, Grotberg and Shyy2011) for a plug propagation without and with a rupture, respectively. Note that Fujioka et al. (Reference Fujioka, Takayama and Grotberg2008) performed simulations only until the plug ruptures due to the limitations of their numerical method, but their results are expected to be numerically more accurate owing to a body-fitted curvilinear grid used in the simulations. As can be seen in figure 19(a), the present results are in good agreement with the results of Fujioka et al. (Reference Fujioka, Takayama and Grotberg2008) for the time evolution of the plug length until the plug ruptures. Figure 19(b–d) compares the present results with the results of Hassan et al. (Reference Hassan, Uzgoren, Fujioka, Grotberg and Shyy2011) for the time evolution of maximum difference in wall pressure, maximum difference in wall shear stress and minimum wall shear stress, respectively. Figure 19(b–d) shows that the present results are also in reasonable agreement with the computational results of Hassan et al. (Reference Hassan, Uzgoren, Fujioka, Grotberg and Shyy2011). We note that, although not shown here, there is a significant deviation between the computational results of Fujioka et al. (Reference Fujioka, Takayama and Grotberg2008) and Hassan et al. (Reference Hassan, Uzgoren, Fujioka, Grotberg and Shyy2011) for the evolution of liquid plug length and plug rupture time, and the deviation increases with increasing
 $h_{2}$
. In particular, Hassan et al. (Reference Hassan, Uzgoren, Fujioka, Grotberg and Shyy2011) predicted the plug rupture to occur significantly earlier especially for the larger precursor film thickness cases, i.e.
 $h_{2}>0.07$
. Since Fujioka et al. (Reference Fujioka, Takayama and Grotberg2008) use a body-fitted grid and thus resolve the flow field much better, we expect that their results are numerically more accurate. To facilitate a direct comparison, the time is shifted to match the peak values of
 $P_{max}-P_{min}$
,
 $\unicode[STIX]{x1D70F}_{max}-\unicode[STIX]{x1D70F}_{min}$
and
 $\unicode[STIX]{x1D70F}_{min}$
in figure 19(b–d). The pressure and shear stress distributions on the tube wall just before the plug ruptures are compared with the results of Fujioka et al. (Reference Fujioka, Takayama and Grotberg2008) in figure 20. As can be seen in this figure, the present results are in very good agreement with those of Fujioka et al. (Reference Fujioka, Takayama and Grotberg2008) for both quantities.
Appendix B. Grid convergence
Validation for the clean interface case. The variation of (a) pressure and (b) shear stress on the tube wall just before plug rupture for
 $L_{pi}=1.0$
,
 $\unicode[STIX]{x0394}P=1$
and
 $\unicode[STIX]{x1D706}=1000$
.

Grid convergence. The time evolution of plug length (a) and maximum pressure difference on the wall (b) computed using various grid resolutions ranging between
 $32\times 64$
and
 $128\times 2560$
. The symbols in the insets show the respective values computed at the times indicated by dashed vertical lines for various grid sizes while the solid lines are the linear least-squares fits to the numerical value.

A grid convergence study is conducted to determine the minimum grid size required to reduce the spatial discretization error below a threshold value, e.g. 3 % in the present study. For this purpose, simulations are performed for the contaminated case of
 $C_{0}=5\times 10^{-5}$
using five different grid resolutions containing
 $32\times 640$
,
 $48\times 1280$
,
 $64\times 1280$
,
 $96\times 1920$
and
 $128\times 2560$
cells. Figure 21 shows the time evolution of plug length and maximum difference in wall pressure computed using these five grid resolutions. In this figure, the vertical dashed lines indicate the times at which the spatial discretization error is quantified and plotted in the inset of each plot. It is clearly seen in this figure that the difference among the results is decreasing with grid refinement, indicating that grid convergence is achieved. The nearly linear relationship between the flow quantities and the square of the grid size confirms the expected second-order spatial accuracy of the method.
The Richardson extrapolation is used to estimate the relative spatial error for a given grid resolution. For this purpose, the relative error for a flow quantity,
 $Q$
, is defined as
 $$\begin{eqnarray}\unicode[STIX]{x1D716}_{Q}(\unicode[STIX]{x0394}z)=\left|{\displaystyle \frac{Q_{\unicode[STIX]{x0394}z\rightarrow 0}-Q_{\unicode[STIX]{x0394}z}}{Q_{\unicode[STIX]{x0394}z\rightarrow 0}}}\right|,\end{eqnarray}$$
where
 $Q_{\unicode[STIX]{x0394}z}$
denotes the value computed on a grid with a cell size of
 $\unicode[STIX]{x0394}z$
while
 $Q_{\unicode[STIX]{x0394}z\rightarrow 0}$
is the spatial-error-free value predicted using the Richardson extrapolation assuming a second-order accuracy in space. The insets in figure 21 show that the grid resolution containing
 $96\times 1920$
cells is sufficient to reduce the spatial error below 3 % for all three times for both flow quantities. Therefore this grid resolution is used for all the results presented in the present study unless specified otherwise.
Finally, the effects of the threshold distance,
 $\ell _{th}$
, are examined. The plug is ruptured when it gets thinner than
 $\ell _{th}$
at the centreline. For this purpose, simulations are performed and the results are shown in figure 22 for the contaminated case with
 $C_{0}=5\times 10^{-5}$
for the various values of
 $\ell _{th}$
in the range
 $0.5\unicode[STIX]{x0394}r\leqslant \ell _{th}\leqslant 2\unicode[STIX]{x0394}r$
, where
 $\unicode[STIX]{x0394}r$
is the grid size in the radial direction near the centreline. As seen, the rupture is slightly delayed as
 $\ell _{th}$
is reduced but the mechanical stresses are not affected significantly as long as
 $\ell _{th}$
is of the order of
 $\unicode[STIX]{x0394}r$
. Although not shown here, similar results are obtained for all the other flow quantities for both the clean and the contaminated cases.
The effects of the threshold distance (
 $\ell _{th}$
) used to rupture the plug in the range
 $0.5\unicode[STIX]{x0394}r\leqslant \ell _{th}\leqslant 2\unicode[STIX]{x0394}r$
. The insets in the upper right and lower left corners show time evolution of the maximum difference in wall pressure (
 $P_{max}-P_{min}$
) and the enlarged view of
 $L_{p}$
around the rupture time, respectively. (
 $C_{0}=10^{-4}$
,
 $L_{pi}=1.0$
,
 $h_{2}=0.05$
,
 $\unicode[STIX]{x0394}p=1$
,
 $\unicode[STIX]{x1D706}=100$
,
 $\unicode[STIX]{x1D6FD}=0.7$
,
 $\unicode[STIX]{x1D712}=0.01$
,
 $Sc=10$
,
 $Sc_{s}=100$
,
 $K_{a}=10^{4}$
,
 $K_{d}=100$
.)



