INTRODUCTION
Bipolaris sorokiniana (Sacc.) Shoem is a pathogen that causes spot blotch, a foliar fungal disease in wheat. The disease is more prevalent in warmer and humid environments worldwide, causing significant yield losses and reducing grain quality (Acharya et al. Reference Acharya, Dutta and Pradhan2011). Utilization of resistant genotypes to B. sorokiniana is the best approach to manage the disease because it is economical and environmentally friendly. However, breeding for resistance has been slow due to ineffectiveness of selection methods (Duveiller et al. Reference Duveiller, Singh and Nicol2007). Selection of resistant genotypes has been by screening wheat genotypes in several environments, ‘hot spot’ sites, by use of disease phenotyping to identify resistance sources in order to develop new genotypes with improved resistance (Duveiller & Sharma Reference Duveiller, Sharma and Sharma2012). Phenotypic markers such as leaf angle, leaf tip necrosis and stay green have been used as an aid to selection for resistance to B. sorokiniana in wheat (Joshi & Chand Reference Joshi and Chand2002; Joshi et al. Reference Joshi, Chand, Kumar and Singh2004, Reference Joshi, Kumari, Singh, Reddy, Kumar, Rane and Chand2007). The problems associated with phenotypic evaluation of genotypes is that it requires large sample sizes for screening, it is time consuming and laborious, relies greatly on repeated ratings in diverse environments, confounded by environmental factors and incurs high experimental errors (Fernando et al. Reference Fernando, Kajenthini, Rebeira, Bamunuarachchige and Wickramasinghe2015). Nonetheless, molecular markers linked to B. sorokiniana resistance genes can provide an alternative approach to overcome these drawbacks and accelerate identification and development of resistant genotypes (Concibido et al. Reference Concibido, Diers and Prakash2004; Islam et al. Reference Islam, Gregorio, Salam, Collard, Tumimbang-Raiz, Adorada, Mendoza, Singh and Hassan2011). Duveiller & Sharma (Reference Duveiller, Sharma and Sharma2012) and Sharma et al. (Reference Sharma, Duveiller and Jacquemin2007) reported that use of molecular markers linked to B. sorokiniana resistance genes in combination with field selection could increase the efficiency and speed of improving resistance in wheat genotypes. This is because the use of molecular markers saves time, reduces experimental errors and is always reliable and accurate as they are not confounded by environmental factors (Concibido et al. Reference Concibido, Diers and Prakash2004).
Quantitative trait loci (QTLs) and simple sequence repeat markers (SSR) linked with resistance to B. sorokiniana have been identified in wheat. The identification of QTL and SSR markers associated with resistance to B. sorokiniana presented new opportunities for improving resistance in wheat. With utilization of molecular marker-assisted selection (MAS), screening and identification of resistant genotypes in parental and segregating generations could be done in the absence of disease epiphytotic conditions (Mondal et al. Reference Mondal, Badigannavar and Murty2008). Kumar et al. (Reference Kumar, Joshi, Kumar, Chand and Röder2009) identified four QTLs linked to B. sorokiniana resistance genes on chromosomes 2A, 2B, 5B and 6D in Yangmai 6, a resistant parent. Two QTLs located on chromosome 2B and 5B were found to be consistent in a 3-year trial. Awasthi & Lal (Reference Awasthi and Lal2014) indicated that a QTL or a molecular marker that is present in numerous genetic backgrounds is important for marker-assisted breeding. Kumar et al. (Reference Kumar, Joshi, Kumar, Chand and Röder2010) also identified four QTLs on chromosomes 2AS, 2BS, 5BL and 7DS to be linked with resistance to B. sorokiniana. Nonetheless, two markers, Xgwm148 and Xgwm111 closely linked to the QTLs on chromosomes 2B and 7D, respectively, were identified as diagnostic markers for resistance to B. sorokiniana. Kumar et al. (Reference Kumar, Kumar, Tyagi, Chand and Joshi2005) reported two SSR markers on chromosome 7D (Xgwm437) and on chromosome 5B (Xgwm544) linked with resistance to B. sorokiniana in Yangmai 6. Additionally, three SSR markers linked to B. sorokiniana resistance were identified in wheat genotype ‘G162’ on chromosomes 5B (Xgwm67), 6A (Xgwm570) and on 6D (Xgwm469) (Sharma et al. Reference Sharma, Duveiller and Jacquemin2007). Adhikari et al. (Reference Adhikari, Gurung, Hansen, Jackson and Bonman2012) using Diversity Arrays Technology (DArT) markers identified four genomic regions (chromosomes 1A, 3B, 7B and 7D) associated with resistance to B. sorokiniana at the seedling stage.
Validating of molecular markers with another population is required before utilizing them for marker-assisted breeding to determine their effectiveness (Anitha et al. Reference Anitha, Manivannan and Anandakumar2014). It is not known whether any previous studies have been conducted to validate SSR markers linked with resistance to B. sorokiniana. Validation establishes the value of a molecular marker reported to be linked to a particular trait in an independent population with varying genetic background (Sharp et al. Reference Sharp, Johnston, Brown, McIntosh, Pallotta, Carter, Bariana, Khatkar, Lagudah, Singh, Khairallah, Potter and Jones2001; Islam et al. Reference Islam, Gregorio, Salam, Collard, Tumimbang-Raiz, Adorada, Mendoza, Singh and Hassan2011). The present study was carried out to validate Xgwm544, Xgwm437 and Xgwm570 SSR molecular markers for their association with resistance to B. sorokiniana for probable use in marker-assisted breeding.
MATERIALS AND METHODS
Plant material
A total of 66 wheat genotypes comprising 11 parental genotypes and 55 F2 lines were used in screening for resistance to B. sorokiniana. The 11 parental genotypes included three adapted genotypes from Zambia (Coucal, Kwale and Loerrie II) and the rest were introduced from the International Maize and Wheat Improvement Centre (CIMMYT) – Mexico. The 55 F2 progenies were derived from the diallel crosses involving eight parents: Coucal, Kwale, Loerrie II, 30SAWSN5, 30SAWSN10, 30SAWSN18, SB50 and 19HRWSN15. SB50 (Sonalika) was used as a susceptible control, while 19HRWSN6 and 30SAWSN5 were used as resistant controls.
Phenotypic evaluation
Screening for resistance of the 66 wheat genotypes was done under natural epidemics in three sites in Zambia, Mpongwe Seed-Co Research Farm (12°06′S, 28°15′E, 1221 m a.s.l.), Golden Valley Agricultural Research Trust (GART) (14°58′S and 28°05′E, 1148 m a.s.l.) and Mt. Makulu Research Station (13°32′S and 28°03′E, 1216 m a.s.l.) during the 2013/14 season. The experimental field was laid out in a 6 × 11 alpha lattice design with two replications. Each genotype was planted in a 3 m long plot of two rows with an inter-row spacing of 20 and 40 cm between plots. Each row was seeded with 60 plants, which were later thinned out to 30 plants per row. Standard agronomic practices were followed for good crop management. All plants were scored for disease severity on symptom appearance, at 7-day intervals. The disease severity score was based on Saari and Prescott's 0–9 scale for assessing foliar disease (Eyal et al. Reference Eyal, Scharen, Prescott and Van Ginkel1987), where zero = no symptoms, 1 = one or two necrotic spots, 2 = a few small necrotic spots without chlorosis, 3 = a few small necrotic spots with chlorosis, 4 = medium size necrotic spots with distinct but restricted chlorotic margin, 5 = medium to large necrotic spots with distinct but restricted chlorotic margin, 6 = large abundant necrotic spots with distinct chlorotic margin, 7 = necrotic spots linked together with pronounced chlorosis, 8 = extensive necrotic spots fully merge expanding longitudinally with pronounced chlorosis and 9 = many extensive necrotic spots with pronounced chlorosis The genotypes were classified on a 9-point scale using the resistance criterion proposed by Chaurasia et al. (Reference Chaurasia, Joshi, Dhari and Chand1999). Genotypes falling in the 1–3 categories were recorded as resistant, 4 as moderately resistant, 5–6 moderately susceptible and 7–9 as susceptible.
Genotypic evaluation
Genomic DNA extraction
For each genotype, DNA was extracted according to an International Maize and Wheat Improvement Centre protocol (CIMMYT 2005). Twenty seeds for each genotype were ground separately into a fine powder using a pestle and mortar. About 70 mg of seed meal was transferred to 1·5 ml centrifuge tubes and labelled. The extraction buffer of 700 µl (1% SDS (sodium dodecyl sulphate), 700 mm NaCl (sodium chloride), 100 mm Tris (Tris (hydroxymethyl) amino-methane and 50 mm EDTA (ethylenediaminetetra acetate)) was added to the meal and incubated for 10 min at 65 °C. After incubation, 200 µl of 5 M potassium acetate was added to the mixture. The mixture was then vortex and placed on ice for 10 min, before being centrifuged at 12 000 rpm for 10 min at 4 °C. Then 400 µl of the supernatant was placed in a new 1·5 ml tube and 400 µl of iso-propyl alcohol was added. The mixture was mixed gently by inverting the tube three times and then centrifuged at 800 rpm for 3 min at 4 °C. The supernatant was discarded and the DNA pellet washed twice by adding 500 µl ethanol and centrifuging at 8000 rpm for 3 min for each wash. The pellet was dried at room temperature and re-suspended in 50–100 µl of deionized water.
Genotyping with simple sequence repeat markers
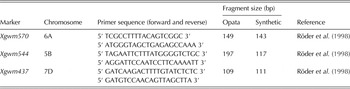
The markers Xgwm570 (Sharma et al. Reference Sharma, Duveiller and Jacquemin2007), Xgwm544 (Kumar et al. Reference Kumar, Kumar, Tyagi, Chand and Joshi2005) and Xgwm437 (Kumar et al. Reference Kumar, Kumar, Tyagi, Chand and Joshi2005) previously reported to be linked to genes for resistance to B. sorokiniana were used in the present study. Primer sequences (Table 1) were obtained from the wheat database GrainGenes, available at http://wheat.pw.usda.gov.
Simple sequence repeat markers linked with resistance to Bipolaris sorokiniana, chromosome location and fragment sizes of Opata and Synthetic wheat

To amplify regions of genomic DNA, polymerase chain reaction (PCR) was performed in a 12 µl volume reaction mixture containing 2 µl of template DNA (10 ng/μl), 1·2 µl deoxynucleoside 5′-triphosphates (dNTPs) (25 U/μl), 0·72 µl magnesium chloride (MgCl2) (50 mm), 1·2 µl buffer (10×), 0·12 µl Taq polymerase (5 U/μl), 6·16 µl PCR grade water, 0·24 µl dye (10 µm), 0·06 µl forward primer and 0·3 reverse primer. The amplification reactions were performed in a heated lid thermal cycle programmed at 93 °C for 1 min for one cycle, followed by 30 cycles of denaturing at 93 °C for 30 s, primer annealing at 60 °C for 30 s and an extension of one cycle of 72 °C for 5 min, followed by a final extension at 72 °C for 10 min. The PCR products were fluorescently labelled and separated by capillary electrophoresis on an ABI 3130 automatic sequencer (Applied Biosystems, Johannesburg, South Africa). Amplification products were scored using GeneMapper 4·1 (CIMMYT 2005).
Data analysis
The phenotypic data were subjected to ANOVA (analysis of variance), using the general linear model procedure (PROC GLM) in SAS version 9.3 (SAS Institute 2011), to determine whether there were significant differences among genotypes.
Single marker analysis using regression analysis in SAS version 9.3 (SAS Institute 2011) was done to determine the association between field spot blotch resistance values and the marker genotype data. The band amplified from each marker data was scored as either 0 to indicate absence of the marker or 1 to indicate presence of the marker for regression analysis (Kuldeep et al. Reference Kuldeep, Nandan, Kumar, Prasad, Chand and Joshi2008; Francis et al. Reference Francis, Merk and Namuth-Covert2011). Significance of the regression coefficient suggests that there is a relationship between the marker and the trait (Anandhan et al. Reference Anandhan, Manivanna, Vindhiyavarman and Jeyakumar2010). The single marker analysis was conducted following the linear model below:
 $$Y\, = \,a\, + \,bX\, + \,{\rm error}$$
where Y = trait value, a = constant, b = slope or regression coefficient of X and X = molecular marker.
A multiple linear regression analysis was conducted in Genstat version 14 (Payne et al. Reference Payne, Murray, Harding, Baird and Soutar2011) to investigate effectiveness of using three markers together in marker assisted breeding. The following linear model was used for multiple linear regression analysis:
 $$Y\, = \,a\, + \,b_1X_1\, + \,b_2X_2\, + \,b_3X_3\, + \,{\rm error}$$
where Y = trait value, a = constant, b 1 = slope or regression coefficient of X 1, X 1 = marker Xgwm570, b 2 = slope or regression coefficient of X 2, X 2 = marker Xgwm544 and b 3 = slope or regression coefficient of X 3, X 3 = marker Xgwm437.
RESULTS
Phenotypic evaluation
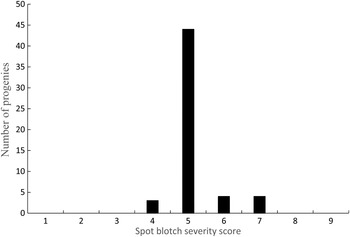
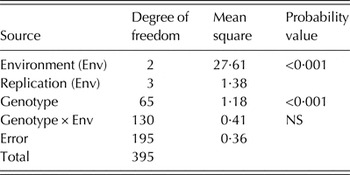
Significant differences (P < 0·001) were observed among genotypic reaction to spot blotch disease (Table 2). Among the 11 parental genotypes, only one (19HRWSN6) was recorded as moderate resistance (score of 4), six as moderately susceptible (Coucal, SB1, 19HRWSN19, 30SAWSN18, 30SAWSN5, 30SAWSN10) (score of 5–6) and four as susceptible (SB50, 19HRWSN15, Kwale and Loerrie II) (score of 7–9) (Fig. 1). Among Zambian genotypes one (Coucal) was moderately susceptible while the other two (Loerrie II and Kwale) were susceptible. Of the 55 F2 progenies, three were recorded as moderately resistant (score of 4), 48 moderately susceptible (score of 5–6) and four susceptible (score of 7–9) (Fig. 2). No genotype was immune to the disease.
Reaction of parental genotypes to spot blotch disease evaluated in three locations in the 2013/14 cropping season.

Reaction of progenies to spot blotch disease in three locations in the 2013/14 cropping season.

Analysis of variance of spot blotch disease reaction evaluated in three locations in the 2014/15 cropping season

NS, not significant.
Molecular marker analysis
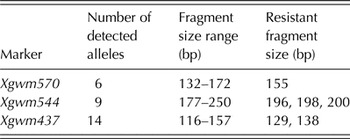
Marker Xgwm570 amplified PCR product of 155 base pair (bp) in the moderately resistant parental genotypes 30SAWSN5, 19HRWSN19 and 30SAWSN8 (Table 3). The 155 bp fragment was also present in 25 moderately resistant F2 progenies from these parental genotypes, which was absent in the susceptible genotypes. A susceptible parental genotype SB50 (Sonalika) and some F2 progenies with SB50 segments showed a 172 bp fragment upon amplification with marker Xgwm570. The 172 bp amplicon was present in all susceptible genotypes and not in the resistant and moderately resistant genotypes.
Simple sequence repeat marker, detected alleles, amplified fragment size range (base pair (bp)) and amplification fragment size (bp) in resistant genotypes

There was no amplification with marker Xgwm544 for moderately resistant parental genotypes 19HRWSN6 and 30SAWSN5. However, 22 F2 progenies derived from these parental genotypes, 30SAWSN5 and 19HRWSN6, showed band sizes of 196, 198 and 200 bp (Table 3). Parents 30SAWSN10 and 30SAWSN18 showed a similar band to that observed in the F2 progenies. Upon screening with marker Xgwm544, a 192 bp fragment was observed in the susceptible parent, SB50. This amplicon only appeared in the susceptible parents, which included Kwale and Loerrie II and some F2 progenies derived from these parents.
Marker Xgwm437 amplified a 121 bp fragment in the susceptible parent SB50 and F2 progenies with fragments of SB50. Marker Xgwm437 amplified an identical fragment size of 129 and 138 bp (Table 3) in the resistant parental genotype 30SAWSN5 and 19HRWSN6, and 11 F2 progenies derived from them.
Single marker regression analysis showed a significant association (P < 0·01) between phenotype trait and associated genotyped results for marker Xgwm570 (Table 4). Marker Xgwm570 accounted for 14·0% of phenotypic variation (R 2). A significant association was also observed between genotype results of molecular marker Xgwm544 (P < 0·05) and the associated phenotypic trait. The R 2 for marker Xgwm544 was 13·0%. The association between genotype results of molecular marker Xgwm437 and the phenotype was significant (P < 0·05). The phenotypic variance explained (R 2) by Xgwm437 was 9·5%.
Single marker and multiple regression accumulated analysis for resistance to Bipolaris sorokiniana in wheat

NS, not significant
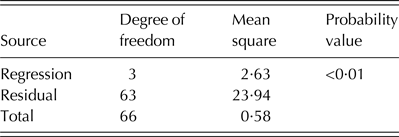
The multiple regression model with all the three markers showed a significant association (P < 0·01) with the phenotypic trait (Table 5). The percentage of phenotypic variation (R 2) explained by all three markers was 18·0%. Marker Xgwm570 contributed more significantly (P < 0·001) to the multiple regression model (Table 4) than molecular markers Xgwm544 and Xgwm437.
Multiple regression analysis of resistance to Bipolaris sorokiniana in wheat using three molecular markers, Xgwm570, Xgwm544 and Xgwm437

DISCUSSION
Significant differences in the phenotypic data implied that the genotypes differed with respect to their resistance to B. sorokiniana at the genotypic level, and hence the population was ideal to use for marker validation.
The results indicated that all the three SSR markers Xgwm570, Xgwm544 and Xgwm437 showed an association with resistance to B. sorokiniana, which causes spot blotch disease. Marker Xgwm570 differentiated between resistant and susceptible genotypes by the amplicon size of 155 bp, which amplified only in the resistant and moderately resistant parental genotypes and their derived 25 F2 progenies but not in the susceptible genotypes. The similarity observed in the amplified fragments in the resistant parental and the F2 progenies, resistant and moderately resistant ones, is one of the indications that the marker was associated with resistance (Reena & Jaiwal Reference Reena and Jaiwal2014; Sehrawat et al. Reference Sehrawat, Yadav, Bhat, Sairam and Jaiwal2016). However, all the susceptible parental genotypes and their derived F2 population showed a 172 bp amplification product, confirming the absence of the gene for B. sorokiniana resistance. Similarly to the present study, Aggarwal et al. (Reference Aggarwal, Gupta, Banerjee and Singh2011) using a sequence characterized amplified regions (SCAR) marker (SCAR600) amplified a 600 bp band in all leaves infected with B. sorokiniana but not in healthy leaves. The significance of the regression coefficient (P < 0·01) showed that marker Xgwm570 was highly associated with resistance to B. sorokiniana. This shows that marker Xgwm570 has a high potential for use in MAS for resistance to B. sorokiniana. These results confirm earlier findings by Sharma et al. (Reference Sharma, Duveiller and Jacquemin2007), who suggested that the Xgwm570 was linked to resistance genes of B. sorokiniana that cause spot blotch disease.
Marker Xgwm544 also discriminated effectively between susceptible and resistant genotypes. Marker Xgwm544 amplified a 192 bp fragment in susceptible parental genotypes and their derived F2 progenies but not in the resistant genotypes, an indication that the gene for resistance to B. sorokiniana was absent in them. Marker Xgwm544 could not produce any amplicons in the moderately resistant parental genotypes 30SAWSN5 and 19HRWSN6. This could be due to the absence of tested linked SSR polymorphism in these genotypes (Mondal et al. Reference Mondal, Badigannavar and Murty2008, Reference Mondal, Badigannavar and D'Souza2012) or due to crossing over between the marker and the allele for resistance in these parental genotypes (Mondal et al. Reference Mondal, Badigannavar and Murty2008). Additionally, it could be due to the marker not being tightly linked to the resistant allele in the corresponding genotypes (Gajjar et al. Reference Gajjar, Mishra, Radhakrishnan, Dodia, Rathnakumar, Kumar, Kumar, Dobaria and Kumar2014) and/or other genetic factors conditioning resistance (Young & Kelly Reference Young and Kelly1997).
On the other hand, F2 progenies from the resistant parental genotypes (30SAWSN5 and 19HRWSN6) and, 30SAWSN10 and 30SAWSN18 upon screening with Xgwm544 produced 196, 198 and 200 bp fragments that were highly associated with resistance (P < 0·05) to B. sorokiniana. This implies that the F2 progenies may have resistance genes in common. Additionally, some F2 progenies that were phenotypically identified as moderately susceptible also showed 196, 198 and 200 bp upon amplification with Xgwm544 suggesting that they had some resistant genes. The significance of the regression coefficient observed from the regression analysis (P < 0·05) shows that marker Xgwm544 had a relationship with resistance to B. sorokiniana. Xgwm544 explained 13% of the observed total phenotypic variation for resistance. This finding confirmed the earlier study by Kumar et al. (Reference Kumar, Kumar, Tyagi, Chand and Joshi2005) that Xgwm544 was linked to B. sorokiniana resistance genes, indicating its usefulness as a tool for identifying resistant genotypes in early breeding generations.
Marker Xgwm437 discriminated resistant from susceptible genotypes in parents and their F2-derived progenies. This was observed from the products of amplification that were identical in the parental and the F2 progenies. That is, marker Xgwm437 amplified a 121 bp fragment that was only present in the susceptible genotypes, thus, suggesting the absence of resistance genes to B. sorokiniana. Aggarwal et al. (Reference Aggarwal, Singh, Shukla, Gurjar, Gupta and Sharma2010) using universal rice primer (URP)-2F observed three bands of 600, 800 and 900 bp only in wheat leaves infected with B. sorokiniana and not in healthy leaves. Marker Xgwm437 amplified identical fragment of 129 bp and 138 in resistant parental genotypes (30SAWSN5 and 19HRWSN6) and F2 moderately resistant progenies confirming the presence of resistance genes to B. sorokiniana. Marker Xgwm437 also displayed a relationship with resistance to B. sorokiniana considering the significance of the regression coefficient (P < 0·05) (Anandhan et al. Reference Anandhan, Manivanna, Vindhiyavarman and Jeyakumar2010). Thus, marker Xgwm437 previously reported by Kumar et al. (Reference Kumar, Kumar, Tyagi, Chand and Joshi2005) to be linked with resistance to B. sorokiniana, was also confirmed in the present study. These results mean that marker Xgwm437 will be useful in screening for resistant genotypes as it would accelerate the identification of resistant genotypes during early generations (Bernardo et al. Reference Bernardo, Bowden, Rouse, Newcomb, Marshall and Bai2013). Multiple regression analysis showed that the addition of markers explained more of the phenotypic variation as observed from the R 2 value. A significant association between the markers and the phenotypic trait implies that there was a positive interaction effect between the markers (Haley & Knott Reference Haley and Knott1992). Hence, therefore, a combination of the markers can be employed during marker assisted breeding to accelerate identification of resistant genotypes.
CONCLUSION
The SSR markers Xgwm570, Xgwm544 and Xgwm437 previously reported to be linked with resistance to B. sorokiniana, which causes spot blotch disease in wheat, were validated in the present study. The results suggest that the markers could be useful in MAS in increasing the efficiency for identification of resistant genotypes in the seedling stage even in the absence of the disease epiphytotic conditions. Since the R 2 values are low, a combination of two or three SSR markers can be employed during MAS. This was evident by the multiple linear equation which gave a combined R 2 value of 18·0%, obtained from inclusion of all the three markers.
The authors would like to thank Alliance for a Green Revolution in Africa (AGRA) through African Centre for Crop Improvement (ACCI) at the University of KwaZulu-Natal for funding the study.