Today, in this year 1879, I, James Croll, want to thank you for the opportunity to present my recently published paper on the thickness of the Antarctic ice (Fig. 1). In this paper (Fig. 2) I address criticisms of my initial estimates of the thickness of the Antarctic ice outlined in my book Climate and time in their geological relations (Croll Reference Croll1875). During the course of my work,
I have endeavoured to show that the thickness of the ice on the Antarctic continent must be far greater than is generally supposed; that whatever its depth at the edge of the continent, where it breaks into bergs, the thickness at the Pole or centre of dispersion must be enormous.
Since the publication of my work in 1875, however, Sir Wyville Thomson, Director of the Scientific Staff of the Challenger Expedition, in a lecture on the condition of the Antarctic regions, delivered at Glasgow, has come to a totally different conclusion. His conclusion is based chiefly on considerations relating to the principle of regelation and the physical nature of ice…. (Croll Reference Croll1879, p. 1)
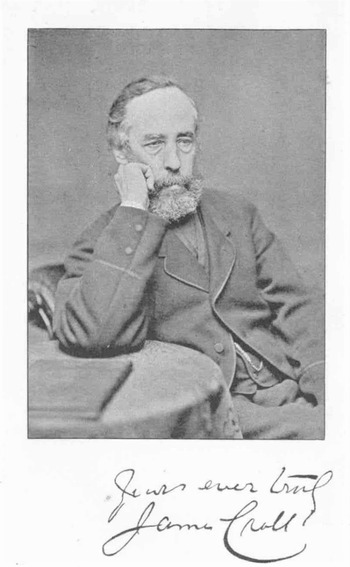
I signed this photograph for my friend James Campbell Irons, who was compiling the Autobiographical Sketch of James Croll (Irons Reference Irons1896).

The title page of my paper on the thickness of the Antarctic ice.

1. Scientific background
Since the visit of Dr Louis Agassiz to view the striations on the undercut and overhanging flanks of Agassiz Rock in Edinburgh, an observation that ruled out the role of floating icebergs as a means of erosion (Scotsman, 7 October 1840), geological observations from Great Britain, North America and Europe have established that continental ice has extended over large areas of the globe in the past. But there have also been observations of embedded vegetation assemblages pointing to warm periods (Geikie Reference Geikie1863). The juxtaposition of these discoveries is puzzling and poses the question of how and why such changes occurred.
In 1864, I proposed a theory that orbital fluctuations in the eccentricity of the Earth's path around the sun, coupled with the precession of the equinoxes, could affect the seasonal distribution of solar radiation received (Croll Reference Croll1864). Later, I showed that the obliquity of the tilt of the Earth's axis also varied predictably and could accentuate the effect (Croll Reference Croll1867a, Reference Crollb, Reference Croll1875, Chapter 25, pp. 398–419). The solar variations are insufficient to directly affect the growth and decay of ice sheets, but I argued that indirect effects can lead to mutual reaction, such as those related to albedo and especially to changes in global winds and ocean currents (Croll Reference Croll1870a, Reference Croll1875, p. 213). Using Leverrier's tables of orbital cycles, I calculated that there were eight ice ages in the last million years and many more over the last three million years (figure in Croll Reference Croll1875, following p. 312). During such glacial episodes great sheets of ice built up over large tracts of NW Europe and northern North America. Importantly, there were interglacial periods of tens of thousands of years, a finding that could explain climatic episodes favouring warmth-loving vegetation in between ice ages.
One important implication of the theory is that the Northern and Southern hemispheres were out of phase. This means that, while one polar area was subject to a minimum of winter insolation and became covered in ice, the opposite polar area was subject to a maximum of winter insolation and enjoyed mild conditions.
When the eccentricity was at a very high value, the hemisphere whose winter occurred in the aphelion…would be under a condition of glaciation, while the other hemisphere, having its winter in perihelion, would be enjoying a warm and equable climate. The effects of eccentricity and obliquity thus combined would probably completely remove the polar ice cap from off the latter hemisphere, and forest trees might then grow at the pole. Again, when the obliquity was at its minimum condition and less heat reaching the poles than at present, the glaciation of the former hemisphere would be increased and the warmth of the latter diminished. (Croll Reference Croll1867a, p. 188)
Such a climatic see-saw means that one or the other hemisphere is losing ice and that conversion of this ice into water will influence global sea level. Since an ice sheet exerts a gravitational attraction to sea level around its peripheries, this will raise its level (Croll Reference Croll1867a, Reference Croll1875, Chapters 23 and 24, pp. 368–397). The implication is that high sea levels will coincide with the presence of an ice sheet in the same hemisphere and be highest at the glacial maximum, whether in the N or S. It is important to note that here theory and observation agree. Raised beaches, reflecting high sea levels, are associated with former glacier margins in Scotland, Canada and Scandinavia. This relationship between the presence of an ice sheet and high sea levels thus comprises further evidence in support of the orbital theory of glaciation.
2. Approach
In this presentation and accompanying paper (Fig. 2), I will devote most effort to consideration of the main arguments raised by Sir Charles Wyville Thomson, especially those concerning the thickness of ice in tabular icebergs and the implications that follow. Then, I will use laws of science to portray the thermal regime of the ice sheet and its implications for regelation. I follow this with a theoretical discussion of the thickness and dynamics of ice flow. Finally, I will compare my conclusions about the Antarctic ice sheet with observations on the ice in Greenland and further observations concerning the thickness of former continental ice masses in North America and Europe.
3. The main arguments
3.1. Ice thickness: tabular icebergs
The following quotation from Sir Wyville Thomson's lecture outlines his argument:
I have mentioned the gradual diminution in thickness of the strata of ice in a berg from the top of the berg downwards. The regularity of this diminution leaves it almost without doubt that the layers observed are in the same category, and that therefore the diminution is due to subsequent pressure or other action upon a series of beds which were at the time of their deposition pretty nearly equally thick…. Now it seems to me that this reduction cannot be due to compression alone, and that a portion of the substance of these lower layers must have been removed…. It seems therefore probable that, under the pressure to which the body of ice is subjected, a constant system of melting and regelation may be taking place, the water passing down by gravitation layer by layer until it reaches the floor of the ice sheet, and finally working out channels for itself between the ice and the land, whether the latter be sub-aërial or submerged…. I should think it probable that this process, or some modification of it, may be the provision by which the indefinite accumulation of ice over the vast nearly level regions of the ‘Antarctic Continent’ is prevented, and the uniformity in the thickness of the ice-sheet is maintained; that, in fact, ice at the temperature at which it is in contact with the surface of the earth's crust within the Antarctic regions, cannot support a column of itself more than 1400 feet high without melting. (Thomson, as quoted in Croll Reference Croll1879, pp. 1–3)
The argument above is a serious challenge to the understanding of ice sheets.
For if Sir Wyville Thomson's conclusions in reference to the thickness of the Antarctic ice be true, they must hold equally true for the ice of the Glacial Epoch…. They are therefore conclusions worthy of discussion, and, as they are diametrically opposed to those arrived at by myself, I have thought of considering the subject in somewhat greater detail. (Croll Reference Croll1879, p. 3)
Since we have no observations from the interior of the continent, ‘the thickness of the ice…has to be determined by purely physical and mechanical considerations, based it is true, on data derived from observation’ (Croll Reference Croll1879, p. 3). Since the centre of the Antarctic ice sheet is near the South Pole, conditions at equal distance from the Pole may be assumed to be the same. ‘Thus, as a purely physical and mechanical problem, the conditions could be hardly more simplified’ (Croll Reference Croll1879, p. 4).
First, we must consider the thickness of icebergs, and I refer to a table of observations from ship masters that I have already published (Croll Reference Croll1875). These mention a tabular berg observed by Captain Clark that was 500 feet high and three miles long, and one seen by Captain Smithers measuring 580 feet high and so large it was mistaken for an island. It has been suggested that
the heights thus recorded are mere guesses, and not the result of actual measurement. But such an opinion is in direct contradiction to the express declaration of Admiral FitzRoy, who collected the evidence on the subject and states ‘by angular and reliable measurements some of them have been found to be six or eight hundred feet high and several miles in circumference’…. But more than this, If Capt. Smithers, for example, did not actually measure the iceberg to which we have referred, he could not have known that its height was 580 rather than 600 feet. The very fact that he stated it to be 580, and not 500 or 600, or even 550 feet, surely implies that he really measured it. (Croll Reference Croll1879, pp. 6–7)
How thick are such tabular icebergs? Sir Charles Wyville Thomson estimates that as much as one-seventh part of the berg may be above the waterline. I think he underestimates the overall density of the ice.
But even if we admit that as much as one-seventh of the berg is above water, still a berg 500 feet in height would be 3500 feet in thickness, and one 600 feet would be 4200 feet thick, while one 720 feet high, of the tabular form, would be 5040 feet, or nearly a mile in thickness…. The testimony from icebergs may therefore be regarded as decisive against the opinion that the Antarctic ice cannot be more than 1400 feet thick. (Croll Reference Croll1879, pp. 6, 8)
Geological evidence from the Northern Hemisphere also shows that continental ice can be much thicker than 1400 feet.
Prof. Dana, for example, has proved that…the thickness of the ice on the American continent must in many places have been considerably above a mile. He has shown that over the northern border of New England the ice had a mean thickness of 6500 feet, while its mean thickness over the Canadian water-shed, between the St. Lawrence and Hudson's Bay, was not less than 12,000 feet, or upwards of 2 1/2 miles (Dana Reference Dana1873)…. Prof. Erdman and Mr. Amund Helland have shown that the ice in some parts of Scandinavia was at least 6000 feet thick…. Mr. Jamieson found that the isolated mountain of Schiehallion in Perthshire, 3500 feet high, is marked near its top as well as on its flanks…by ice passing over it from the north. Dr. James Geikie has shown that the ice between the mainland and the Outer Hebrides was as much as 3700 feet in thickness. (Geikie Reference Geikie1878; Croll Reference Croll1879, p. 8)
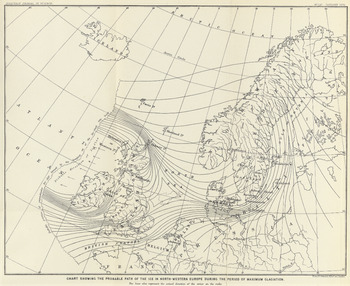
I have used field observations in Northwest Europe to reconstruct the flow of ice during the glacial epoch and it is clear that the sheet must have been thousands of feet thick (Fig. 3).
I compiled this reconstruction of the former ice sheet that covered north-western Europe during the Glacial Epoch and use it in my Antarctic paper as evidence that continental ice can be thousands of feet thick and flow across flattish landscape. Note that the flow lines coincide with field evidence of ice flow directions. The reconstruction explains the onshore flow direction near the tip of Caithness in northern Scotland (Croll Reference Croll1870b, Reference Crollc). Perhaps I have relied too much on theory in south-eastern England and north-western France.

3.2. Temperature of Antarctic ice
‘There are but three quarters from which the ice-cap can receive an appreciable amount of heat, viz., (1) the air above; (2) the earth beneath; and (3) the work of compression. Other sources can yield little, if any at all’ (Croll Reference Croll1879, p. 8). I know that Sir William Thomson has worked on heat derived from the earth's crust and, using his figures,
This amount is sufficient to melt a layer of ice, already at the melting point, one-fifth of an inch in thickness…. At first sight we might be apt to suppose that underground heat ought to travel up through the ice in the same way as through the strata of the earth below…. This, however, is impossible; for (1) the greater part of the heat is spent not in raising the temperature, but in melting the ice; and (2) the ice when melted immediately runs off, carrying the heat along with it…. But if the temperature of the ice be much below the freezing-point, the heat constantly passing into the solid layers at the bottom of the ice sheet, though trifling, ought in the course of ages to pass up through the ice. (Croll Reference Croll1879, p. 9)
Since the ice has a downward and horizontal motion, we can conclude that
not only is internal heat from below carried away by the horizontal flow of the ice, but that the upward motion of the heat is checked by the downward flow of ice from above; and the ice is, in all probability, moving downwards more rapidly than the heat is travelling upwards. (Croll Reference Croll1879, p. 10)
‘What is the temperature of the Antarctic ice?’ (Croll Reference Croll1879, p. 11). In my article, I consider the role of conduction, radiation and heat derived from the work of compression and friction. My conclusion is that these three sources play an insignificant role and, indeed, that
whatever that temperature may be it is not very materially affected either by the heat of compression, or by underground heat, or by that transmitted from the surface either by conduction or melted ice. On what, then, does the temperature of the ice mainly depend? (Croll Reference Croll1879, p. 13)
The answer is that
The temperature of the great mass of ice is mainly determined by the mean temperature of the upper surface of the ice sheet. All the ice down to the bottom of the sheet originally came from the surface…. There is not only a constant motion of the ice from the pole outwards, but a constant downward motion as layer by layer is successively formed on the surface…. As the temperature of the ice, then, cannot be much above the mean temperature of the surface, which is far below the freezing point, it follows that the underlying mass must also be below the freezing point…. And although the mean temperature of the regions around the South Pole has not been ascertained by direct observation, yet it certainly cannot be higher, but is probably much lower than, that of those around the North Pole, which we know is but a few degrees above zero, F. (Croll Reference Croll1879, pp. 13–14)
It is worth making the point that
In regions such as Switzerland where the mean temperature is above the freezing point, the temperature of the ice in the interior of the glacier is not determined by the air above. The tendency of the air in this case is to keep the entire mass of the glacier at the melting point. But as the temperature of the melting-point depends on pressure, the temperature of the glacier at any depth from the surface will depend on the pressure to which the ice at that depth is subjected…. At the depth of a quarter of a mile, where the pressure would be equal to about 36 atmospheres, the temperature would be, not 32°, as at the surface, but 31.5°. (Croll Reference Croll1879, p. 15)
So let me summarise my response to the views of Sir Wyville Thomson concerning the temperature of the ice. His argument that,
owing to internal heat coming through the earth's crust, the bottom of the Antarctic ice-sheet is kept at a temperature of 32°, cannot be sustained. It is this fundamental error, as I conceive it to be, which has led Sir Wyville astray, and induced him to believe that the ice cannot be of excessive thickness…. It is the temperature of the ice that determines that of the floor on which it rests, and not the latter that determines the former…. In short, in determining the thickness of the Antarctic ice, underground heat does not enter as an element into our calculations, and…ice at the Poles may be a dozen of miles in thickness as readily as 1400 feet. (Croll Reference Croll1879, pp. 16–18)
Sir Wyville Thomson relates the thinness of deeper layers in tabular icebergs to melting and regelation due to the pressure of the overlying ice.
I need hardly state, that no amount of pressure, however great, has the least tendency whatever to produce a melting of the ice by heat unless this pressure performs work…. The pressure here referred to, which is supposed to produce the melting, is the weight of the ice, or, in other words, the force of gravity. (Croll Reference Croll1879, p. 19)
3.3. Thinning of strata in an iceberg
It is clear that there is a diminution in the thickness in the layers exposed in icebergs. At a depth of 60 or 80 feet, they are a foot or so in thickness and this reduces to three inches thick near the water line.
Assuming that the latter layers were all originally of the same thickness as the upper, it can nevertheless be shown that the gradual diminution in the thickness of the layers from the top downwards follows independently altogether of compression or the removal of any portion of the substance of the layers, either by melting or by any other means. (Croll Reference Croll1879, p. 21)
There is a peculiarity in Continental ice, that there is a centre of dispersion from which the ice radiates in all directions…. In the case of the Antarctic sheet the centre of dispersion cannot be far from the Pole…. We may therefore in our inquiry safely assume the Pole to be the centre of dispersion. It is obvious that, if the Antarctic ice be radiating in all directions from the Pole as a centre, a portion of a layer which in say latitude 85° covers 1 square foot of surface will on reaching latitude 80° cover 2 square feet. At latitude 70° it will occupy 4 square feet, and at latitude 60° the space covered will be 6 square feet. Then if the layer was 1 foot thick at latitude 85°, it would be only 6 inches thick at latitude 80°, 3 inches thick at latitude 70°, and 2 inches at latitude 60°.
Now the lower the layer the older it is, and the greater the distance which it has travelled. A layer near the bottom may have been travelling from the Pole for the past 10,000 or 15,000 years, whereas a layer near the top may perhaps not be twenty years old, and may not have travelled the distance of a mile…. It follows therefore that, other things being equal, the lower a layer is the thinner it should be, and this is perfectly sufficient to account for the decrease in the thickness of the layers from the top downwards, without assuming any of the ice to have been removed by melting or by any other means. (Croll Reference Croll1879, p. 22)
3.4. Continental ice is thickest at the centre
I should note that in earlier work I have considered the flow of glacier ice and recognised the importance of the deformation of ice crystals en masse as the main means of glacier flow (Croll Reference Croll1869, Reference Croll1875, Chapter 31, pp. 514–527).
Whatever theory we may adopt as to the cause of the motion of ice, it will follow as a necessary consequence that the ice sheet must be thickest at the centre and thinnest at its edge. In a continental sheet like that covering the Antarctic regions we are not warranted, as has already been noticed, in assuming that the surface of the ground under the sheet slopes persistently outwards from the centre or Pole to the edge; in other words, we cannot infer that the Antarctic ice, like an ordinary glacier, rests on an inclined plane.
Now if we adopt the generally accepted theory, that Gravity is the force impelling the ice forward, we must assume the sheet to be thickest at the centre; for unless it were so gravity could have no tendency to produce motion, because the force which moves the ice must not only act horizontally, but act in more in one direction than in another; and this it would not do were the ice of uniform thickness…. If the sheet is to be forced out horizontally along a flat surface by its own weight, then…the sheet, of course, must be thickest at the centre. (Croll Reference Croll1879, pp. 22–23)
That the entire mass of the Antarctic ice down to the bottom is in a state of motion, and not simply the upper layers, as some suppose, is demonstratable from the fact that icebergs are stratified down to their base. The iceberg is simply a piece broken off the edge of the sheet, and the stratified face of the berg is the counterpart of the edge from which it broke off; and as the icebergs are known to be stratified to their base, it proves that the sheet from which they were derived is likewise stratified to the bottom. The fact, therefore, that stratified icebergs are continually breaking off the Antarctic sheet, and have been for ages, proves that the sheet down to the bottom must have been in a state of outward motion. (Croll Reference Croll1879, footnote, p. 23)
3.5. Thickness at the centre is independent of snowfall at that place
An important point to emphasise is that
however small may be the snowfall, and consequent amount of ice formed annually at the Pole, snow and ice must of necessity continue to accumulate year by year till the sheet becomes thickest there…. Supposing there were no snow whatever falling at the Pole, and no ice being formed there, still the sheet would be thicker there than at the edge. For in this case ice forming at some distance from the pole all around would flow back towards the centre, and continue to accumulate there till the resistance to the inward flow became greater than the resistance to the outward; but this state would not be reached till the ice became thickest on the poleward side. (Croll Reference Croll1879, p. 24)
However, it is probable that significant snowfall does occur near the Pole. There is an
inflow of moist winds in all directions towards it; and as the area on which these currents deposit their snow becomes less and less as the Pole is reached, this must, to a corresponding extent, increase the quantity of snow falling on a given area. (Croll Reference Croll1879, p. 24)
3.6. Rates of ice flow of the Antarctic ice
If we knew the rate at which the edge of the Antarctic ice-cap is advancing outwards, we could form a rough estimate of the amount of snowfall on the continent. Or, conversely, knowing the amount of snowfall, we could tell approximately the rate at which the ice is moving outwards.
Dr. Rink calculates that the yearly precipitation on Greenland in the form of snow and rain amounts to about 12 inches. About 2 inches he considers is carried off by ice into the sea, and the remaining 10 inches is carried to the sea in the form of sub-glacial rivers. (Rink Reference Rink1853; Croll Reference Croll1879, p. 25)
Guided by these estimates for Greenland, can we estimate the discharge from the Antarctic? Since there is less melting in the Antarctic,
I can hardly think that it will be regarded as an over-estimate to affirm that at least one-half the precipitation must reach the sea in the form of ice. Assuming the annual precipitation to be no greater than that of Greenland, viz., 1 foot per annum, the quantity carried off in the form of ice would be in this case 6 inches…. If we assume the cap to extend on an average to latitude 70°, its area will be about 5,940,000 square miles, or 165,611,000,000,000 square feet.
The circumference of the cap is 45,300,000 feet, and its thickness at the edge is assumed of course to be 1400 feet. Were the ice, therefore, to move outwards at the rate of 1300 feet per annum,…the quantity of ice discharged annually in the form of icebergs would be 82,446,000,000,000 cubic feet…. Consequently, if 6 inches of ice be carried annually off the Antarctic continent, the edge of the cap must be moving outwards at the rate of about a quarter of a mile annually. Even supposing there were only 2 inches of ice discharged, the rate of motion would require to be between 400 and 500 feet per annum.
A quarter of a mile per annum cannot be regarded as an improbable rate of motion for continental ice, when we reflect that the Greenland ice has in some places a velocity ten times greater. Mr. Amund Helland, for example, found that the glacier of Jakobshaven has a velocity of about 20 metres per diem, which is upwards of 4 miles annually. The exceptional high velocity of the Greenland glaciers is no doubt owing to the fact that the ice-sheet covering that continent has to force its way through comparatively narrow outlets. If the sheet moved off the land in one unbroken mass, like the Antarctic sheet, its rate of motion would be much less. (Croll Reference Croll1879, pp. 25–26)
I think it is important to note that the ice sheet can respond to an increase in snowfall either by changing in thickness or ice velocity. Suppose the snowfall is the equivalent of 12 inches per year rather than six inches per year.
[An] increase in thickness would produce an increase of velocity, and the increase both in thickness and velocity of motion would continue till the quantity of ice discharged would be equal to the 12 inches over the whole area…. Equilibrium being now established, no further increase would take place either in the thickness of the sheet or the velocity of its motion. (Croll Reference Croll1879, p. 27)
I will conclude this section on ice flow by stressing the inter-relationships involved in the system comprising the Antarctic ice.
The area of the sheet, the thickness of its edge, the velocity of its motion outwards, the amount of snowfall, and the temperature of the climate are so related to one another that the value of any one of them can be determined approximately in terms of the rest. (Croll Reference Croll1879, p. 28)
3.7. The probable thickness of the ice at the pole
‘The point which now remains to be determined is, what is the thickness of the ice at the Pole, or centre of dispersion?’ (Croll Reference Croll1879, p. 28). I considered this point in my work of 1875 (Croll Reference Croll1875, pp. 374–386) and I showed how difficult it was for an individual to appreciate an ice sheet of continental scale; a thickness of several miles at the centre would appear extremely thin if viewed at the appropriate scale. I also marshalled a series of arguments in favour of the thickness in the centre being measured in miles rather than a few thousand feet. The thickness of the ice is so crucial to our understanding of the cause of Ice Ages and also to the effects on climate and sea level, that I will go over certain significant points once more.
The thickness of the sheet at the edge is admitted to be about 1400 feet, and this, as has been demonstrated, must be the thinnest part of the sheet. It must gradually thicken inwards towards the Pole as centre of dispersion…. The upper surface of the sheet must slope upwards towards the centre or pole. What is the amount of this slope?…. A slope of 1 degree, continued for 1400 miles, will give 24 miles as the thickness of the ice at the Pole. But would a slope of 1 degree be sufficient to produce the required amount of motion? If the generally accepted theory of the cause of glacier motion to be correct, it certainly would not. But, supposing we assume that one-half or even one-quarter that amount of slope; still we have 6 miles as the thickness of the ice-cap at the Pole. (Croll Reference Croll1879, p. 28)
To those who have not been accustomed to reflect on the physical conditions of this problem, this estimate may doubtless be regarded as somewhat extravagant; but a slight consideration will show that it would be even more extravagant to assume that a slope of less than half a degree would be sufficient to produce the necessary outflow of ice. In estimating the thickness of a sheet of continental ice of one or two thousand miles across, our imagination is apt to deceive us. (Croll Reference Croll1879, p. 28)
But let us compare the ocean where what
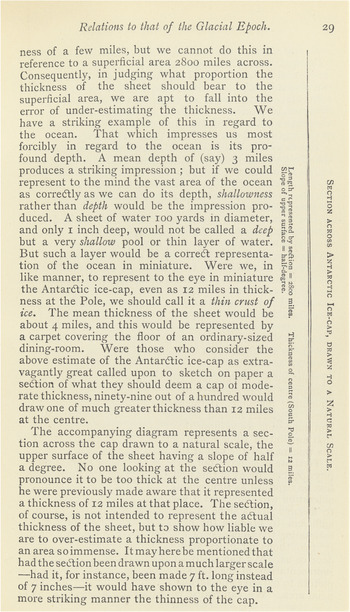
impresses us most forcibly…is its profound depth…if we could represent to the mind the vast area of the oceans as correctly as we do its depth, shallowness rather than depth would be the impression produced. A sheet of water 100 yards in diameter, and only 1 inch deep, would not be called a deep but very shallow pool or a thin layer of water. But such a layer would be a correct representation of the ocean in miniature. Were we, in like manner, to represent to the eye in miniature the Antarctic ice-cap, even as 12 miles in thickness at the Pole, we should call it a thin crust of ice. The mean thickness of the ice would be about 4 miles, and this would be represented by a carpet covering the floor of an ordinary-sized dining-room…. The accompanying diagram represents a section across the cap drawn to a natural scale, the upper surface of the sheet having a slope of half a degree. (Croll Reference Croll1879, p. 29; Fig. 4)
Here I discuss scale and the difficulty of appreciating ice thickness at a continental scale. The cross section on the right assumes a surface ice gradient of half a degree and a thickness of 12 miles at the centre.

3.8. Ice in Greenland
‘Greenland…possesses on a smaller scale a condition of things similar to that of the Antarctic continent…. The Greenland ice-sheet, like the Antarctic, must be thickest at the centre of dispersion and thinnest at the edge’ (Croll Reference Croll1879, p. 31). Greenland is more accessible than the Antarctic, yet few people have penetrated the interior. Nonetheless, several have noted that the ice surface slopes gradually upwards towards the interior. For example, in West Greenland,
Professor Nordenskjöld states that at 30 geographical miles from the coast, the extreme point reached by him, he had attained an elevation of 2200 feet, and that the inland ice continued constantly to rise towards the interior, so that the horizon towards the east, north and south was terminated by an ice-border almost as smooth as that of the ocean. (Nordenskjöld Reference Nordenskjöld1872; Croll Reference Croll1879, p. 31)
‘Again, Dr Rink, found that near Umanak on the W coast at an elevation of 2000 feet the ice surface gradually rises towards the interior’ (Rink Reference Rink1853; Croll Reference Croll1879, p. 32).
‘There is little doubt that an expedition into the interior of Greenland would throw more light on the physical nature of continental ice than one to the North Pole’ (Croll Reference Croll1879, p. 32).
3.9. Ice of the glacial epoch
The same general principles which we have been considering hold equally true in reference to ice of the Glacial epoch. Misapprehensions regarding the magnitude of continental ice lie at the very root of the opposition with which the Land-ice Theory…has had to contend…. For example, to explain the glacial phenomena…we are compelled to infer that the whole of Scotland, Scandinavia, and the greater part of North-western Europe, were not only covered by ice, but covered to a depth of one or two thousand feet…. To explain this by…theory, we have further to assume that the ice sheet which covered the land must have filled the Baltic, the German Ocean [North Sea], and surrounding seas; in short, that all these regions were buried underneath one continuous mass of ice. (Croll Reference Croll1879, p. 32; Fig. 3)
‘That such a condition as this, to which we are led by theoretical considerations, did actually prevail during the Glacial epoch is now established by the facts of observation’ (Croll Reference Croll1879, p. 33).
4. Conclusion
In this presentation, I have first tried to show that Sir Wyville Thomson's view that the Antarctic ice sheet may be only 1400 feet thick is contradicted by the laws of science, especially those concerning ice flow and the temperature of the ice. In particular, the view that melting related to regelation might control ice thickness is not borne out by theory or observation.
There are no land observations in the Antarctic, and I have relied on physical and mechanical theory to predict the nature of a continental ice sheet centred on the pole. I have discussed the morphology, thermal regime and the depth, direction and velocity of ice flow. I must admit that I have struggled with the issue of ice thickness and have had to rely on the application of assumed regular surface gradients (Croll Reference Croll1869, Reference Croll1875, Chapter 21, pp. 435–455). Observations in the centre of the ice in Greenland would be particularly helpful in this regard. Perhaps I should have developed a flow law for ice that could explain the gentler surface gradients in areas of thicker ice; if so, I could have constrained the elevation and thickness of the ice sheet at its centre much more closely. In the final section, I argue that my theoretical conclusions about the Antarctic ice sheet are supported by observations on the ice in Greenland and on landform evidence concerning the thickness of former continental ice masses in North America and Europe.
5. Postscript by David Sugden
It is more than 140 years since my ‘co-author’ penned this imagined presentation in 1879 and 76 years before John Glen published his momentous paper developing a flow law for glacier ice (Glen Reference Glen1955). James Croll, who recognised the importance of ice deformation in glacier flow, is quite likely to have thought about an ice flow law as an alternative way of establishing ice thickness. After all, the range of predicted ice thicknesses in the ice-sheet centre of 3–24 miles would have troubled his incisive mind, especially when seen alongside his quantitative insights into the dynamics, thermal regime and mass balance of ice sheets.
Overall, the powerful quotations from James Croll outlined in this article show just how far his glaciological ideas were ahead of their time. Also novel and impressive is the way he used a systems approach in his search for understanding. James Croll's ideas remain relevant today and, indeed, the abstract to this paper holds to this day.
6. Acknowledgements
David Sugden is humbled to immerse himself in the work of James Croll and realises it is a bit cheeky to write a presentation on his behalf. For further perspective on James Croll, the impact of his path-breaking ice age theory, his assumption that winter insolation was critical, the bi-polar see-saw and the Antarctic connection, see Sugden (Reference Sugden2014). I thank Kevin Edwards and an anonymous referee for their helpful comments on the manuscript.