Introduction
Preparation of an efficient electrolyte layer is one of the most crucial steps in constructing a battery. Electrolyte layer plays a major role because all chemical reactions happen at the electrode–electrolyte interface. They also act as a medium for movement of ions from anode to cathode during discharge and vice-versa during charge cycles, which are monitored using ionic conductivity values. Due to the dependence of battery performance on the electrolyte layer, vast and varied research has been performed for decades. Based on existing research, most flexible batteries use a liquid electrolyte (KOH, NaOH, etc.), which is casted and soaked within the battery. Prolonged dependence on liquid electrolytes with separators for batteries was seen due to the edge obtained from continuous ionic contact between the anode and cathode even when being flexed.[Reference Zhang1] But, liquid electrolytes are toxic, corrosive, unsafe, and there is always a danger of leakage if the battery is misused or physically damaged. Additionally, they also have the tendency to form dendrites that progress until contact, due to the repeated recharge cycles and finally cause the battery to fail.[Reference Gray and Gray2–Reference MacCallum and Vincent5] To avoid manufacturing and packaging complexities and to increase resiliency against extreme conditions such as shock, vibrations, and extreme temperatures, a solid or polymeric electrolyte (ceramics, polymers, etc.) is found to be the best substitute.[Reference Meyer6–Reference Goodenough9] Polymeric electrolytes are also attractive because of their light weight, processing simplicity, and their ease of fabrication.[Reference Song, Wang and Cv Wan7] The reduced content of solvent (or no solvent in some cases) also makes them inherently safe.
A wide variety of polymers such as polyethylene oxide (PEO), polyvinyl alcohol (PVA), polyacrylonitrile, poly(vinyl chloride), poly(vinylpyrrolidone), poly(vinyl sulfone), poly(acrylic acid) (PAA), polyethylene glycol, polymethyl-methacrylate, poly(ethyleneglycol diacrylate), poly(vinylidene fluoride) (PVDF), and gelatin[Reference Tsuchida, Ohno and Tsunemi10–Reference Park, Park, Nam, Lee and Cho21] were used to prepare polymer electrolytes. Wright was the first to garner interest in this particular field through their study of materials based on alkali metal salts complexed with PEO.[Reference Fenton22, Reference Wright23] Later, the use of polymer electrolytes in secondary batteries was demonstrated by Armand et al.[Reference Armand, Chabagno, Duclot, Vashishta, Mundy and Shenoy24] Polymer electrolyte obtained by using PEO along with potassium hydroxide (KOH) as an additive was reported by Fauvarque et al. to exhibit an ionic conductivity (σ i) of approximately 10−3 S/cm, five orders of magnitude higher than pristine PEO (10−8 S/cm) at room temperature.[Reference Fauvarque, Guinot, Bouzir, Salmon and Penneau13, Reference Guinot, Salmon, Penneau and Fauvarque14] This encouraged various groups to explore more possibilities with various additions to different polymers. Yang and Lin investigated the addition of PVA to PEO–KOH system and also the dependence of σ i with temperature and reported conductivity values in the range of 10−2 S/cm.[Reference Yang and Lin16, Reference Gilbert17] Iwakura et al. investigated the addition of various molar amounts of KOH to PAA for potential use in Ni/MH batteries and reported a high σ i of 0.4 S/cm along with a wide potential window.[Reference Iwakura, Nohara, Furukawa and Inoue25] Whereas, Lewandowski et al. performed similar experiments for PVA–KOH–H2O systems. They reported a best room temperature σ i of approximately 10−3 S/cm for 40: 25–30: 30–35 weight ratio PVA–KOH–H2O system.[Reference Lewandowski, Katarzyna and Malinska26] Kumar and Sampath investigated polymer electrolyte comprising PVDF, propylene carbonate, ethylene carbonate, and zinc trifluoromethane sulfonate and reported a maximum σ i of 3.94 × 10⁻³ S/cm.[Reference Kumar and Sampath27] Various researchers also explored the possibility of improving σ i by means of radical polymerization technique. For example, Wu et al. used the technique on PVA–KOH system by addition of PAA and reported a high σ i value of 0.301 S/cm, but this lowered the power density of zinc–air and aluminum–air cells.[Reference Wu, Lin and Yang28, Reference Wu, Lin and Yang29] Park et al. investigated gelatin–KOH system and reported a σ i value of 3.1 × 10⁻³ S/cm.[Reference Park, Park, Nam, Lee and Cho21] Similarly vast amount of research was performed using other polymers as well, but we limit our literature to polymers mostly used.
But, most of the polymer gel preparation processes involve a number of complex stages for synthesis and also are energy intensive in terms of the temperatures used for drying.[Reference Tsuchida, Ohno and Tsunemi10–Reference Zhu, Luo, Ciesielski, Fang, Zhu, Henriksson and Hu31] In this study, we focus on preparing a novel nano-fiber cellulose (NFC) hydrogel-based electrolyte along with various additives. NFC hydrogel is chosen for exploration due to its abundant availability, safety, non-toxicity, inherent ability to be strong, biodegradable and biocompatible, excellent flexibility, lightweight, and its easy chemical accessibility for modification.[Reference Zhu, Fang, Preston, Li and Hu30, Reference Zhu, Luo, Ciesielski, Fang, Zhu, Henriksson and Hu31] Previously, NFC was used in advanced electronics, biomedical, and energy applications such as in organic light-emitting diode devices, light weight paper actuators, bioactive paper, biosensor on NFC-based paper, separators, and as electrode components in a battery but never used as a main component of an electrolyte in a battery.[Reference Zhu, Fang, Preston, Li and Hu30–Reference Zhu, Fang, Wang, Dai, Yao, Shen and Yu32]
During experimentation, the σ i value of pristine NFC hydrogel was measured as 10−6–10−7 S/cm. This value is at least an order of magnitude higher than the conventional pristine polymers (PEO, PVA, etc.)[Reference Tsuchida, Ohno and Tsunemi10–Reference Wu, Lin and Yang29] used for preparing polymer electrolytes. Low concentration of NFCs (0.5–2%) in water forms a semi-stable gel, eliminating the need to base the composition of the electrolyte mostly on non-biodegradable polymers such as PEO, which also have a crystallization behavior.[Reference Zhu, Luo, Ciesielski, Fang, Zhu, Henriksson and Hu31, Reference Huang and Chen33, Reference Golodnitsky, Strauss, Peled and Greenbaum34] This property of forming a semi-stable gel of NFC helps in attaining a more amorphous electrolyte comparatively and result in improving the ionic conductivity.[Reference Huang and Chen33] Initially, in an effort to improve σ i of the pristine hydrogel, varying amounts of KOH were added to hydrogel as an additive and casted to form films, but during preparation they had difficulties with coagulation of fibers. Also, the resulting films were flaky, brittle, and not stable enough to be characterized.
Henceforth we directed our focus on making stable and highly ionic conductive NFC hydrogel electrolytes with addition of varying amounts of polymers such as gelatin, PAA, and KOH in stages. Initially, gelatin is chosen as an additive due to its safety, non-toxicity, biocompatibility due to the presence of a large number of functional groups, and biodegradability.[Reference Huang and Chen33–Reference Jaipan, Nguyen and Narayan36] However, gelatin networks are unstable at temperatures higher than 35 °C, due to the breakage of secondary bonds.[Reference Jaipan, Nguyen and Narayan36, Reference Dash, Foston and Ragauskas37] Previous studies indicate that the mechanical and chemical properties of gelatin can be modified using various kinds of cross-linking agents.[Reference Jaipan, Nguyen and Narayan36–Reference Chang, Chang, Lai and Sung39] PAA is chosen to be cross-linked with gelatin in this paper due to its ease of interpenetration without use of many initiators, resulting from its carboxylic groups.[Reference Koul, Mohamed, Kuckling, Adler and Choudhary35, Reference Burugapalli, Bhatia, Koul and Choudhary40] In addition to it, varying amounts of KOH is used as an additive to polymer systems, due to its proven ability to enhance the ionic conductivities of the system by improving the amorphous nature as a whole and yet remain mechanically strong and stable.[Reference Yang and Lin16, Reference Gilbert17, Reference Park, Park, Nam, Lee and Cho21, Reference Wu, Lin and Yang28, Reference Wu, Lin and Yang29] As mentioned earlier, unlike most other polymer preparation processes that are complex and energy intensive, we prepare the NFC hydrogel electrolyte in much simpler stages and dry at temperatures close to room temperature. The best average σ i value of 96.89 mS/cm was obtained with the hydrogel: gelatin: PAA: KOH system. This value is comparable to the best reported ionic conductivities for gel polymer electrolytes.
Experimental
Material synthesis
PAA (average Mw 1800), KOH (80 wt.% solution), triallylamine and ammonium persulphate (APS) were purchased from Sigma Aldrich (USA). Food grade type A gelatin was purchased from MP Biomedicals (through Fischer Scientific (USA)) and 0.53 wt.% NFC hydrogel was received from Dr. Liangbing Hu's research group. For making various mixtures, the weight ratios were calculated using the wt.% of cellulose nanofibers in the hydrogel rather than that of hydrogel as a whole. All the materials were used as received without any further chemical treatments for purification.
To make flexible and stable gel electrolytes, gelatin and PAA were added, and to improve the σ i KOH was added in varying ratios individually and tested in stages. During the initial stage, varying amounts of gelatin 10.6, 21.2, 31.8, 42.4, and 53 mg were added to 10 g of 0.53 wt.% NFC hydrogel, respectively. These mixtures were denoted as HGx (hydrogel-gelatin) where x = 0.2, 0.4, 0.6, 0.8, and 1. As mentioned earlier, the ratios were made with respect to the wt.% of cellulose nanofibers in the hydrogel. The samples were placed on a hot plate at 60–65 °C for 15 min, for the dissolution of gelatin and mixed using a vortex mixer. The resulting various viscous liquids (HGx) were drop casted into silicon molds (2 cm diameter), due to the ease of extraction involved with them. The silicon molds with polymer liquids were then placed in a vacuum oven for drying at 35 °C for 30–36 h. The dried gel electrolytes were then extracted from the molds and measured for σ i. At least four samples for the same ratio were made and measured to account for minimizing error and plotting error bar chart.
During second stage, the sample with hydrogel: gelatin ratio of 1:1 (HG1) is chosen for further experimentation due to its entailed advantages of enhanced ionic conductivity and better flexibility of gel formed and are discussed later in the manuscript. For easy processing, PAA was made solution processable by dissolving an appropriate amount of PAA polymer crystals in distilled water along with 1 wt.% triallylamine with respect to PAA. This mixture is magnetically stirred at 225 rpm on a hot plate at 70 °C overnight. Now to the HG1 sample, varying amounts 10.6, 21.2, 31.8, 42.4, and 53 mg of PAA were added along with 10 wt.% of APS with respect to PAA and sonicated. APS acts as an interpenetration initiator.[Reference Song, Wang and Cv Wan7] These various ratios were denoted as HGPy where y = 0.1, 0.2, 0.3, 0.4, 0.5, respectively. The resultant viscous liquids (HGPy) were drop casted, dried, and measured for σ i in the same method as the initial stage. Later, for the final stage, a sample with hydrogel: gelatin: PAA ratio of 1:1:0.3 (HGP0.3) is chosen for further experimentation, due to its higher ionic conductivity values. In an effort to further improve ionic conductivity, to this HGP0.3 sample, varying amounts 13.78, 27.56, 41.34, 55.12, 68.9 mg of KOH were added and vortex mixed. The various samples are denoted as HGPKz, where z = 0.1, 0.2, 0.3, 0.4, 0.5, respectively. The various ratios of additives used for experimentation were chosen based on the literature.[Reference Guinot, Salmon, Penneau and Fauvarque14–Reference Zhu, Luo, Ciesielski, Fang, Zhu, Henriksson and Hu31] These samples were also finally measured for σ i after being drop casted and dried.
Measurements
Ionic conductivity measurements at room temperature were performed by AC electrochemical impedance spectroscopy. The sample was placed in-between two blocking electrodes in a swedge lock cell setup created in-house. All the samples were tested against stainless steel (SS) with a geometric surface of ~2.5 cm2, in SS/electrolyte/SS configuration. The frequency range used for the analysis was 0.1–106 Hz with a voltage amplitude of 10 mV. These characterizations were performed using a versastat from Princeton applied research. The thickness of the sample was measured using a Vernier calipers (Mityutoyo), calculated as the difference between the length of the electrodes and length of the electrodes with polymer electrolyte sandwiched between them. This was also confirmed using a micrometer (Mityutoyo). The x-ray diffraction (XRD) analysis was performed on the polymer samples held in a sample holder using a Rigaku Miniflex apparatus, with Cu Kα x-radiation. Fourier transform infrared (FTIR) absorption spectra of the samples were recorded using a Frontier Optica spectroscope from Pelkin Elmer with a resolution of 4/cm, a measuring wave number range of 400–4000/cm and a number of scans of 64.
Results and discussion
Conductivity studies
For ionic conductivity measurement, SS blocking electrodes are used. Due to this, the electrode–electrolyte interface can be considered to be capacitance. It is expected that the impedance spectra is a vertical spike when the capacitance is ideal. However, an ideal scenario is not feasible here due to imperfections in the alignment of electrode–electrolyte interface. So, the spikes yielded in the spectra are generally at an angle <90°. These are the Nyquist plots obtained from ac impedance spectra. The bulk resistance (R b) of the polymer sample can be extracted from the intercept of real axis at higher frequencies, when analyzing these Nyquist plots. Using the bulk resistance (R b) extracted from the Nyquist plots, the ionic conductivity of various samples can be calculated by using the equation, σ i = t/A*R b; where, t is the thickness of the electrolyte and A is the area of the blocking electrodes. Utilizing the above relation, the σ i of pristine NFC hydrogel was measured to be 10−6–10−7 S/cm.
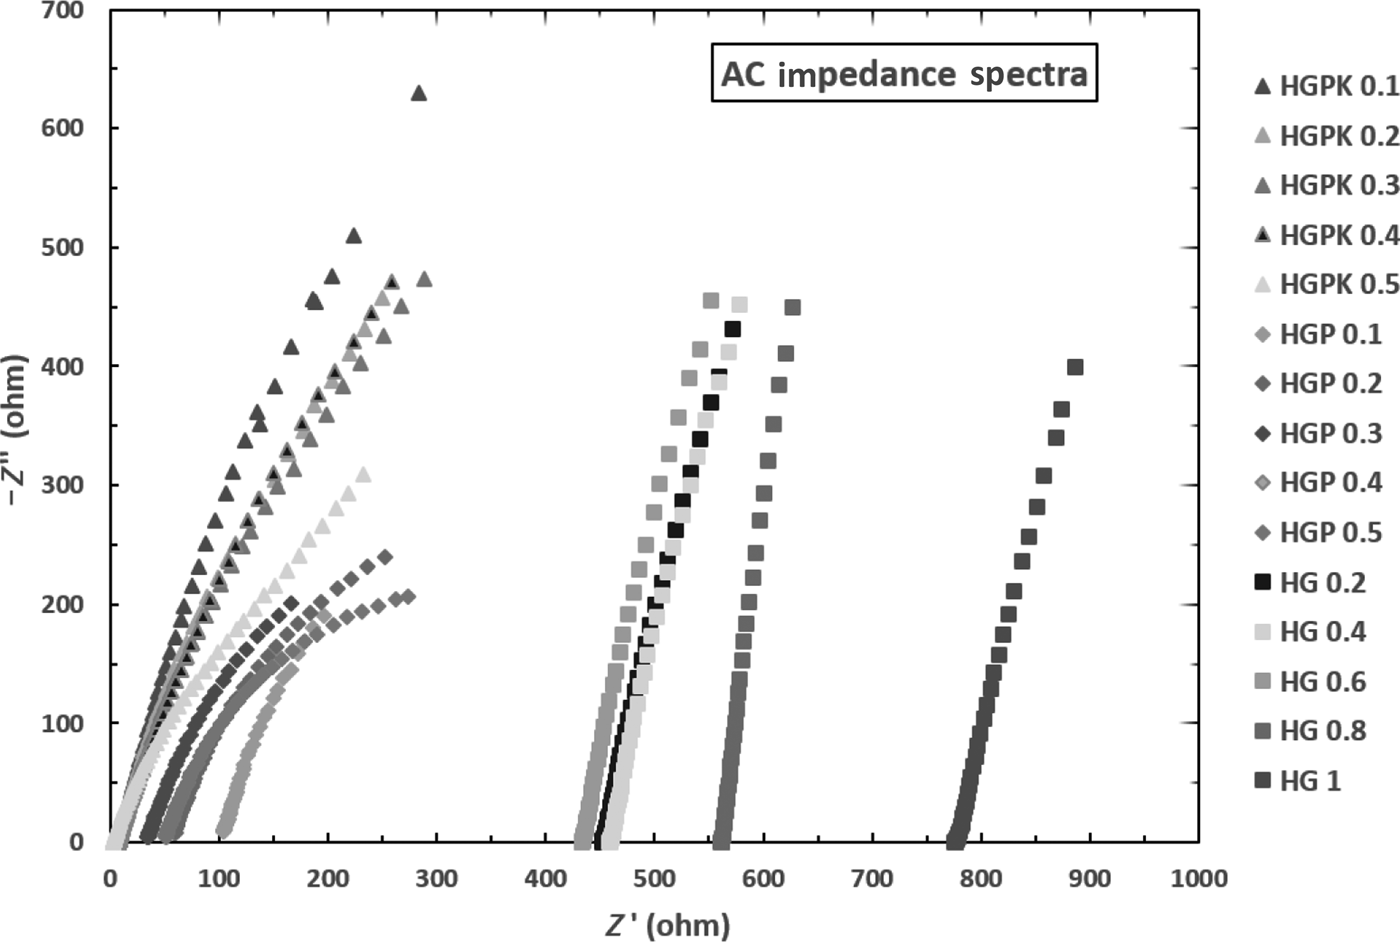
The ac impedance spectra of NFC hydrogel-based electrolytes with varying ratios of Gelatin (HGx), PAA (HGPy), and KOH (HGPKz) at room temperature are shown in Fig. 1. From the x-axes intercepts of Nyquist plots, the R b value ranges obtained for HGx, HGPy, and HGPKz samples were 426.8–773.3, 32.5–104.53, and 1.8–8.7 Ω, respectively. The ionic conductivities were calculated using these R b values along with the thickness value of each of the samples. To minimize the error, a minimum of four samples ionic conductivity were measured for each type of HGx, HGPy, and HGPKz samples.
AC impedance spectra for NFC hydrogel electrolytes with varying ratios of various additives such as gelatin (HGx), PAA (HGPy) and KOH (HGPKz).

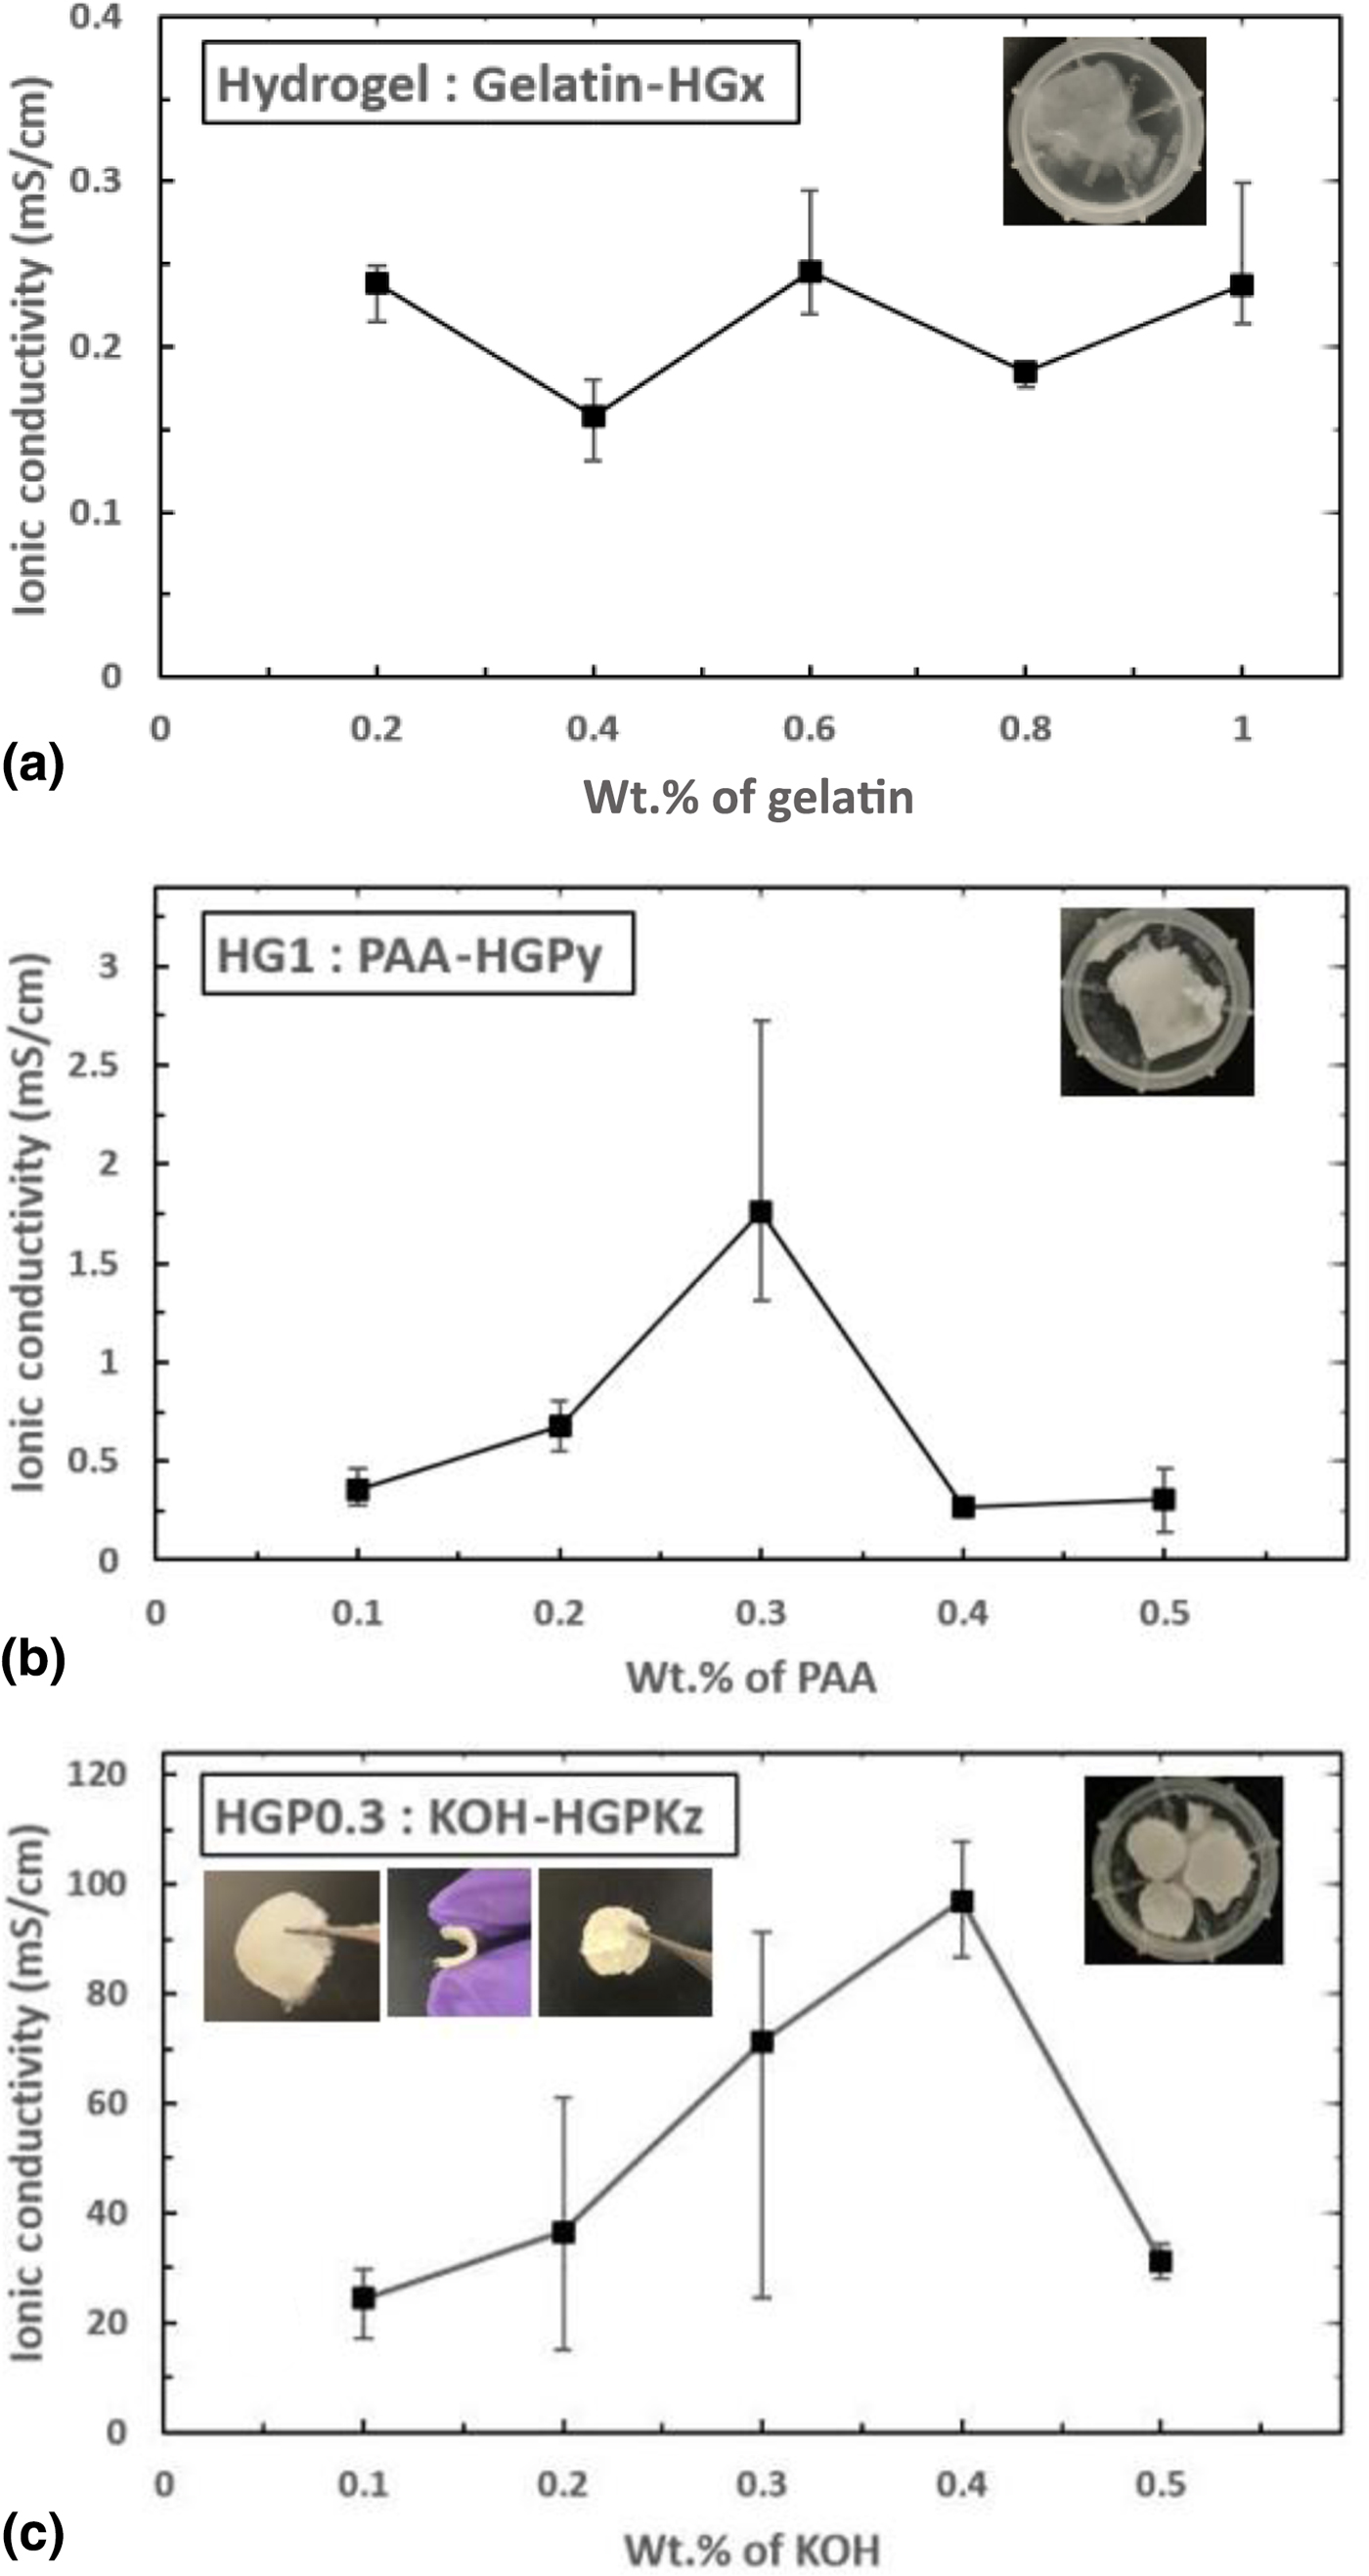
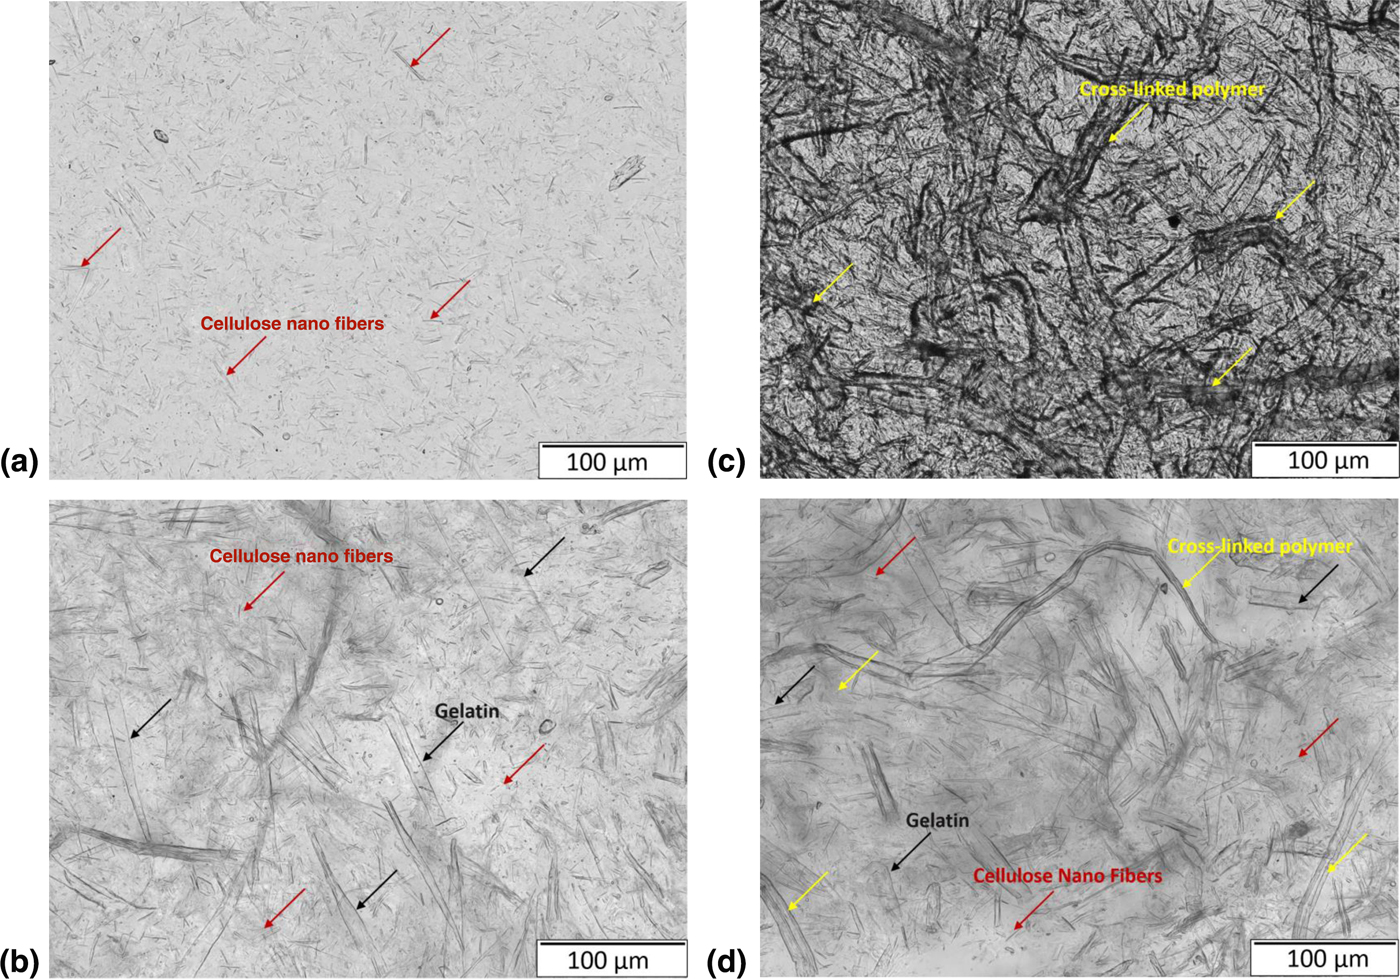
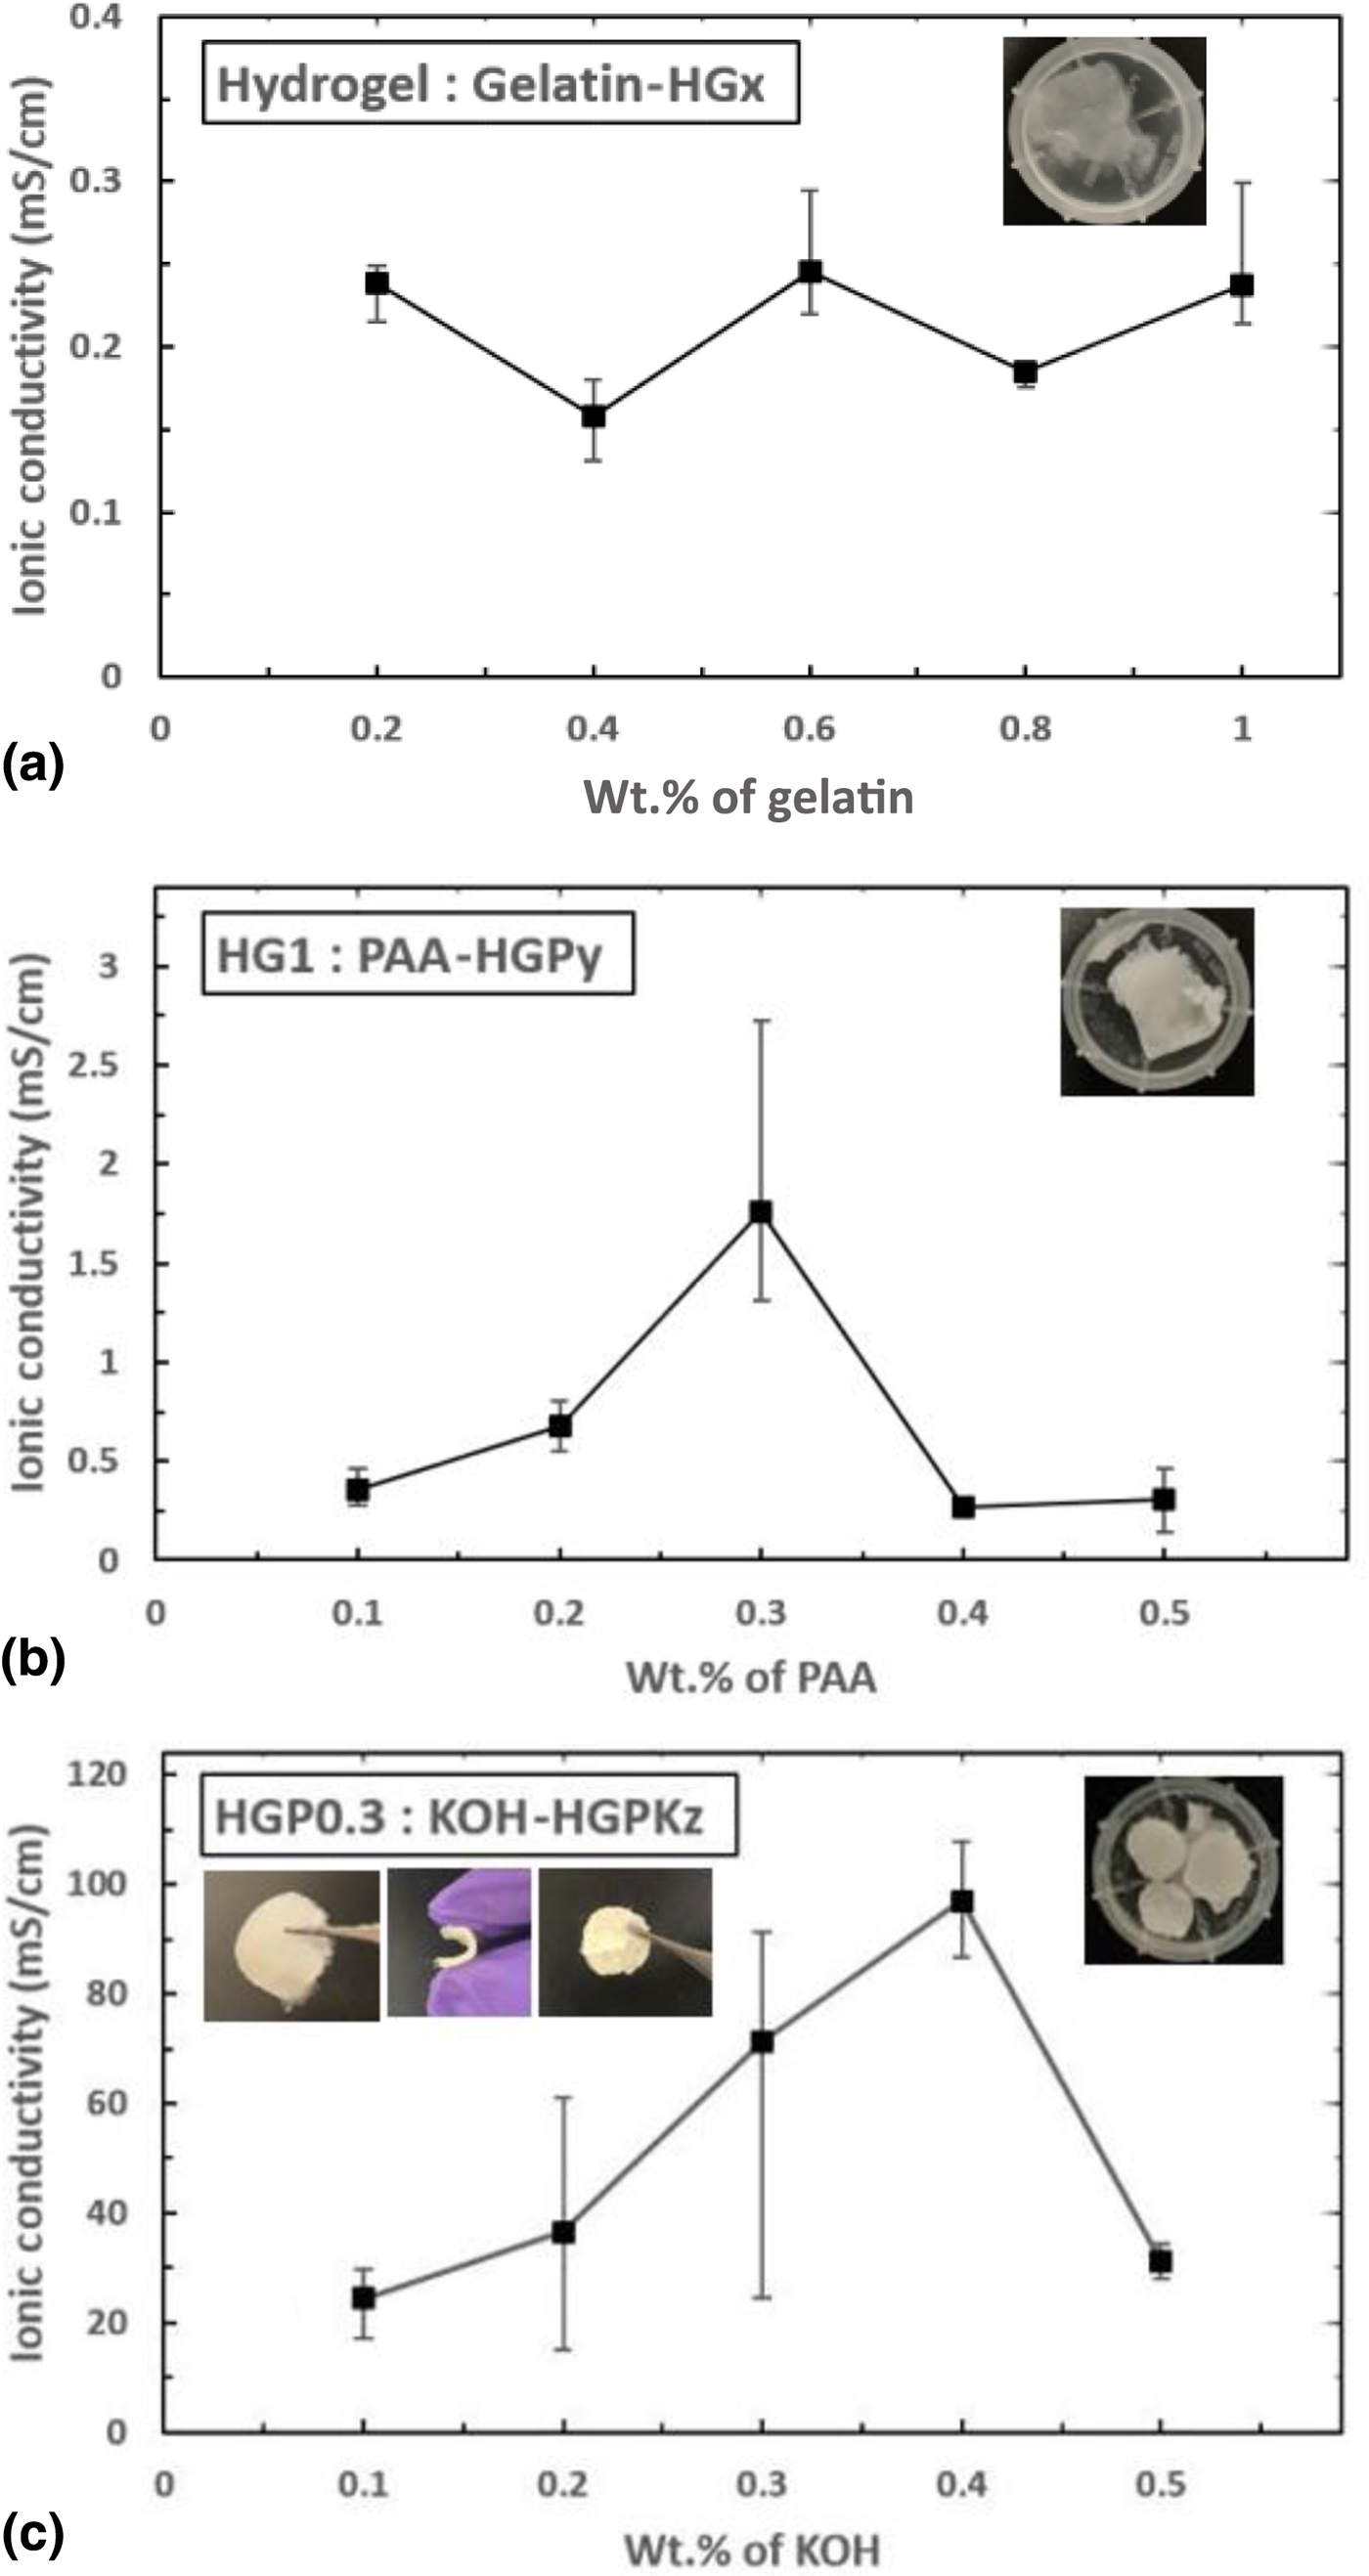
Figure 2 shows the calculated ionic conductivity values for various electrolytes prepared. It can be observed from Fig. 2(a) that, with addition of gelatin, the σ i values increased by three orders of magnitude on a whole irrespective to the amount of gelatin added. This can be attributed to the hydrophilic nature of gelatin.[Reference Huang and Chen33–Reference Jaipan, Nguyen and Narayan36] Due to this, when gelatin is dissolved using temperature; its triple helix structure loosens. This makes it flexible and at the same time help the gel remain amorphous to a certain extent allowing it to transport ions through itself while being mechanically stable at room temperatures.[Reference Park, Park, Nam, Lee and Cho21, Reference Wu, Lin and Yang28, Reference Wu, Lin and Yang29] Now, with varying amounts of gelatin, it can be observed that there is a small reduction in σ i values for 0.4 (HG0.4) and 0.8 (HG0.8) wt.% gelatin in NFC hydrogel when compared with a relatively constant value of 0.237 mS/cm for the other weight ratios. The weight ratio 1:1 hydrogel: gelatin (HG1) as shown in Fig. 2(a) inset is chosen as the best sample among the other gelatin samples, due to its higher mechanically stable convenient gel formation that helps in handling the samples well in terms of cell construction for ionic conductivity measurement and further use. Figures 3(a) and 3(b) show the microscopic images of pristine hydrogel and HG1 sample. The formation of stable gel by means of using gelatin can be clearly observed from it.
Ionic conductivity as a function of the amount of (a) gelatin, (b) PAA, and (c) KOH in the 0.53 wt.% NFC hydrogel sample, HG1 sample, and HGP0.3 sample, respectively.
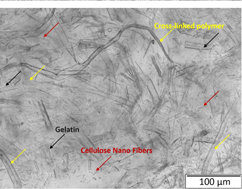
Microscopic images of (a) pristine hydrogel, (b) hydrogel with gelatin (HG1), (c) hydrogel–gelatin with PAA (HGP0.3), and (d) hydrogel–gelatin–PAA with KOH (HGPK0.4).
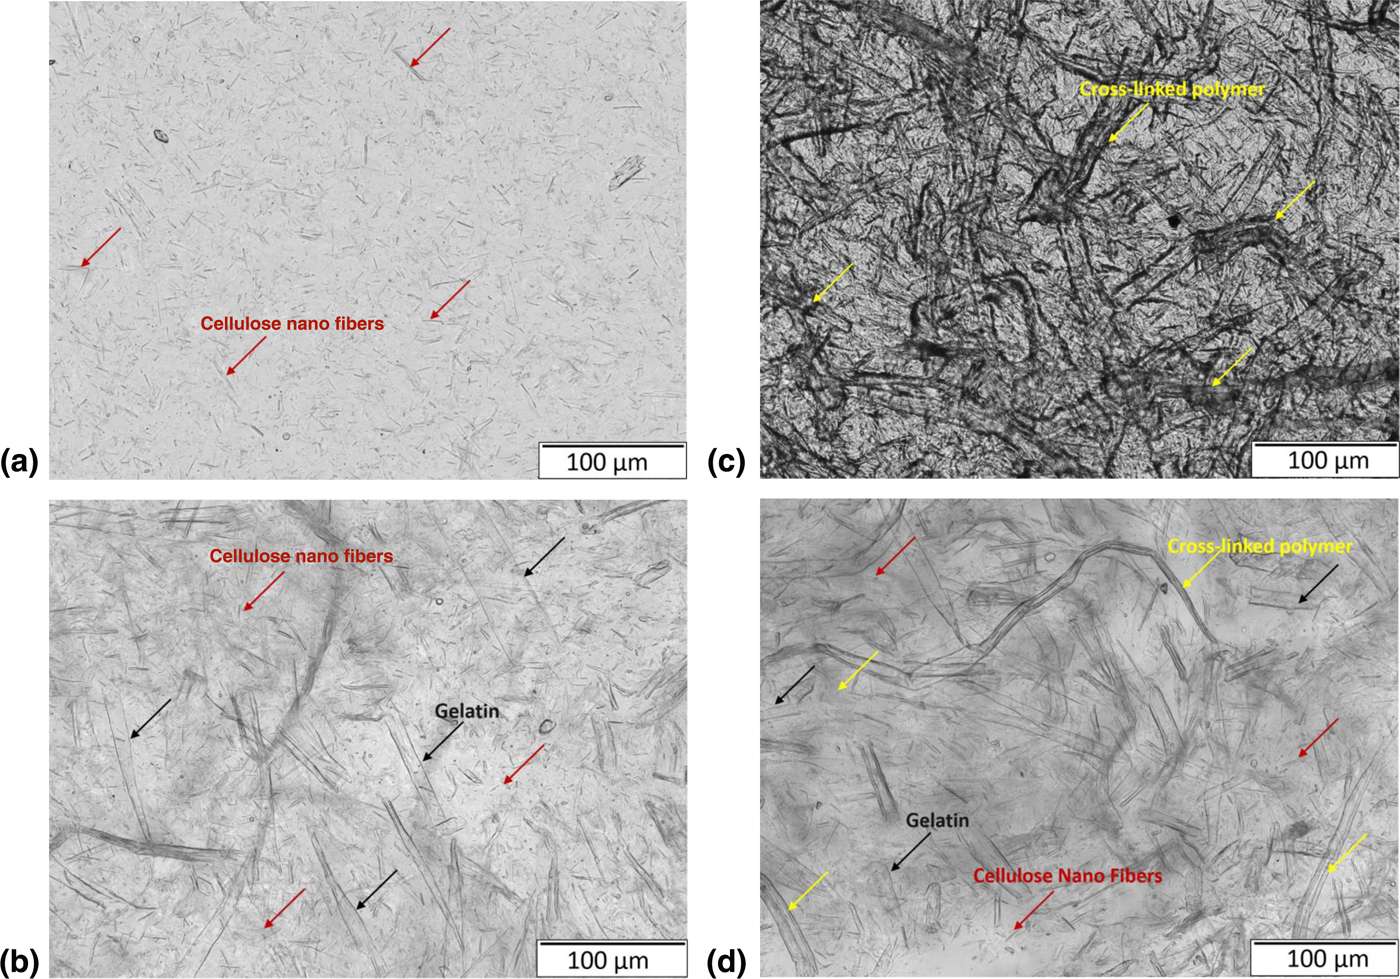
Now, HG1 is used as a base polymer and varying amounts of PAA (HGPy; y = 0.1, 0.2, 0.3, 0.4, 0.5) were added to improve the stability, flexibility of electrolytes, and also to seek to improvement in ionic conductivity values when measured. Figure 2(b) indicates the ionic conductivity values recorded when samples were characterized. It can be observed from Fig. 2(b) that with increasing amount of PAA, there is a steady increase in σ i until it reaches a maximum average value of 1.75 mS/cm for the sample with 0.3 wt.% PAA denoted as HGP0.3, which is seven times higher than HG1. This increase in σ i might be because of the cross-linking of PAA and gelatin polymers.[Reference Wu, Lin and Yang28, Reference Wu, Lin and Yang29] Comparing Figs. 3(b) and 3(c), it can be explicitly seen of how addition of PAA causes interpenetration. This interpenetration of polymers along with producing mechanically strong films also improve the swelling nature of the polymer.[Reference Koul, Mohamed, Kuckling, Adler and Choudhary35, Reference Dash, Foston and Ragauskas37, Reference Burugapalli, Bhatia, Koul and Choudhary40] This allows the cross-linked gel to retain solvents used during processing and make it more amorphous based on the extent of swelling, and in turn act as a medium for ion transportation.[Reference Wu, Lin and Yang28, Reference Wu, Lin and Yang29, Reference Koul, Mohamed, Kuckling, Adler and Choudhary35, Reference Dash, Foston and Ragauskas37, Reference Burugapalli, Bhatia, Koul and Choudhary40] The phenomenon of occurrence of interpenetration is confirmed by FTIR and explained in detail later. On further addition of PAA, there is a decrease in the σ i values. This might be a result of lump formation observed when preparing samples.[Reference Koul, Mohamed, Kuckling, Adler and Choudhary35, Reference Dash, Foston and Ragauskas37, Reference Burugapalli, Bhatia, Koul and Choudhary40] The lumps might act as blockages and hinder the mobility of ions. Due to its higher mechanical and ion conducting properties, HGP0.3 sample, as shown in Fig. 2(b) inset, is chosen for further experimentation. Now to improve the ionic conductivity values, various amounts of KOH are used as an additive to the HGP0.3 sample to make HGPKz (z = 0.1, 0.2, 0.3, 0.4, 0.5) samples. The varying ratios of KOH were chosen based on previous research.[Reference Yang and Lin16, Reference Gilbert17, Reference Park, Park, Nam, Lee and Cho21, Reference Wu, Lin and Yang28, Reference Wu, Lin and Yang29] Figure 2(c) indicates the variation of σ i with KOH. It can be noted that with the addition of varying amounts of KOH, there is a significant increase in σ i values until 0.4 wt.% KOH and then a sharp fall. A highest average σ i of 96.895 mS/cm was achieved for HGPK0.4 system (hydrogel: gelatin: PAA: KOH = 1:1:0.3:0.4). Improvement in the amorphous nature of the electrolyte is observed by addition of KOH as seen on comparing Figs. 3(c) and 3(d).
Due to the swelling of polymer with KOH, there would be an increase in amorphicity along with increase in ionic concentration in the electrolyte, which will result in better ionic conductivity values. This increase in amorphicity is later confirmed by XRD. On further addition of KOH beyond 0.4 wt.%, the σ i values reduce due to crystallization from salt saturation. This salt saturation may cause aggregation of free ions and result in lowering of ionic conductivity.[Reference Kumar and Sampath27, Reference Wu, Lin and Yang28, Reference Reddy, Jin, Han, Zhu, Mai and Chen42] To analyze the strength and flexibility of the gel electrolyte formed, the best sample (i.e., HGPK 0.4) was subjected to a manual cyclic bending test. The sample was bent repeatedly, as can be seen in the inset of Fig. 2(c) until surface deformed. The sample withstood 26 cycles before showing any cracks on the surface.
XRD and FTIR spectra studies
XRD and FTIR analyses were performed on the pristine and best samples to confirm the changes occurring either in the form of amorphicity or in the form of cross-linking during addition of polymers. The following corresponding sections have the detailed description of what changes are taking place.
X ray-diffraction
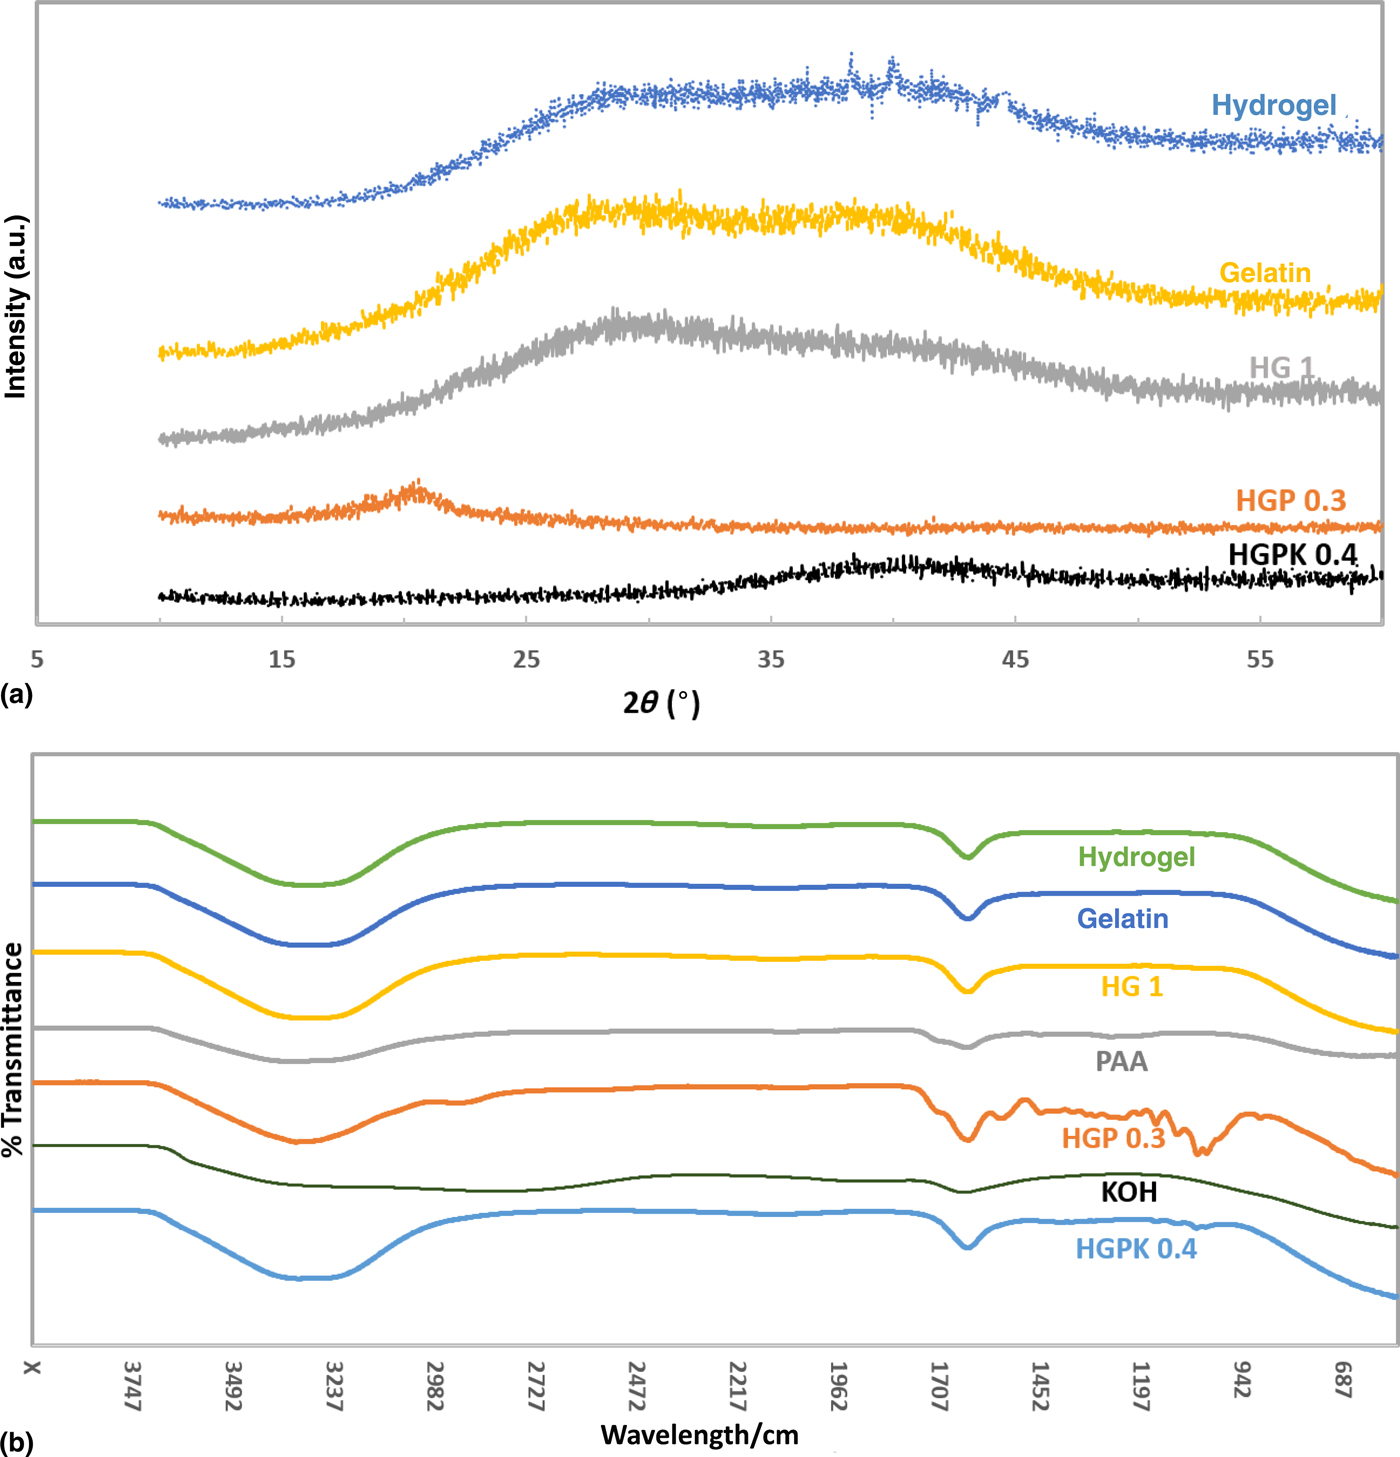
Structural morphology of the gel polymer electrolytes is confirmed by using the XRD analysis data to figure out the degree of crystallinity. Figure 4(a) depicts the XRD pattern for pristine hydrogel, gelatin, and for the best samples of the various additives, that is, HG1 for HGx, HGP0.3 for HGPy, and HGPK0.4 for HGPKz, respectively. As seen from the Fig. 4(a), the addition of gelatin to hydrogel (HG1) broadens the peak when compared with pristine hydrogel, indicating the enhancement of amorphous nature of the gel electrolyte.[Reference Agrawal and Shukla41] On further addition of PAA to HG1, one can observe that the amorphous nature is much more improved but at the same time a low-intensity peak is observed at 2θ ~ 20°. The occurrence of peak on addition of PAA is in accordance with previous research.[Reference Yang and Lin16, Reference Gilbert17] This is due to the induction of slight crystallinity by PAA additive.
(a) XRD patterns and (b) FTIR spectra of pristine hydrogel, gelatin, PAA, KOH, HG1, HGP0.3, and HGPK0.4 samples.
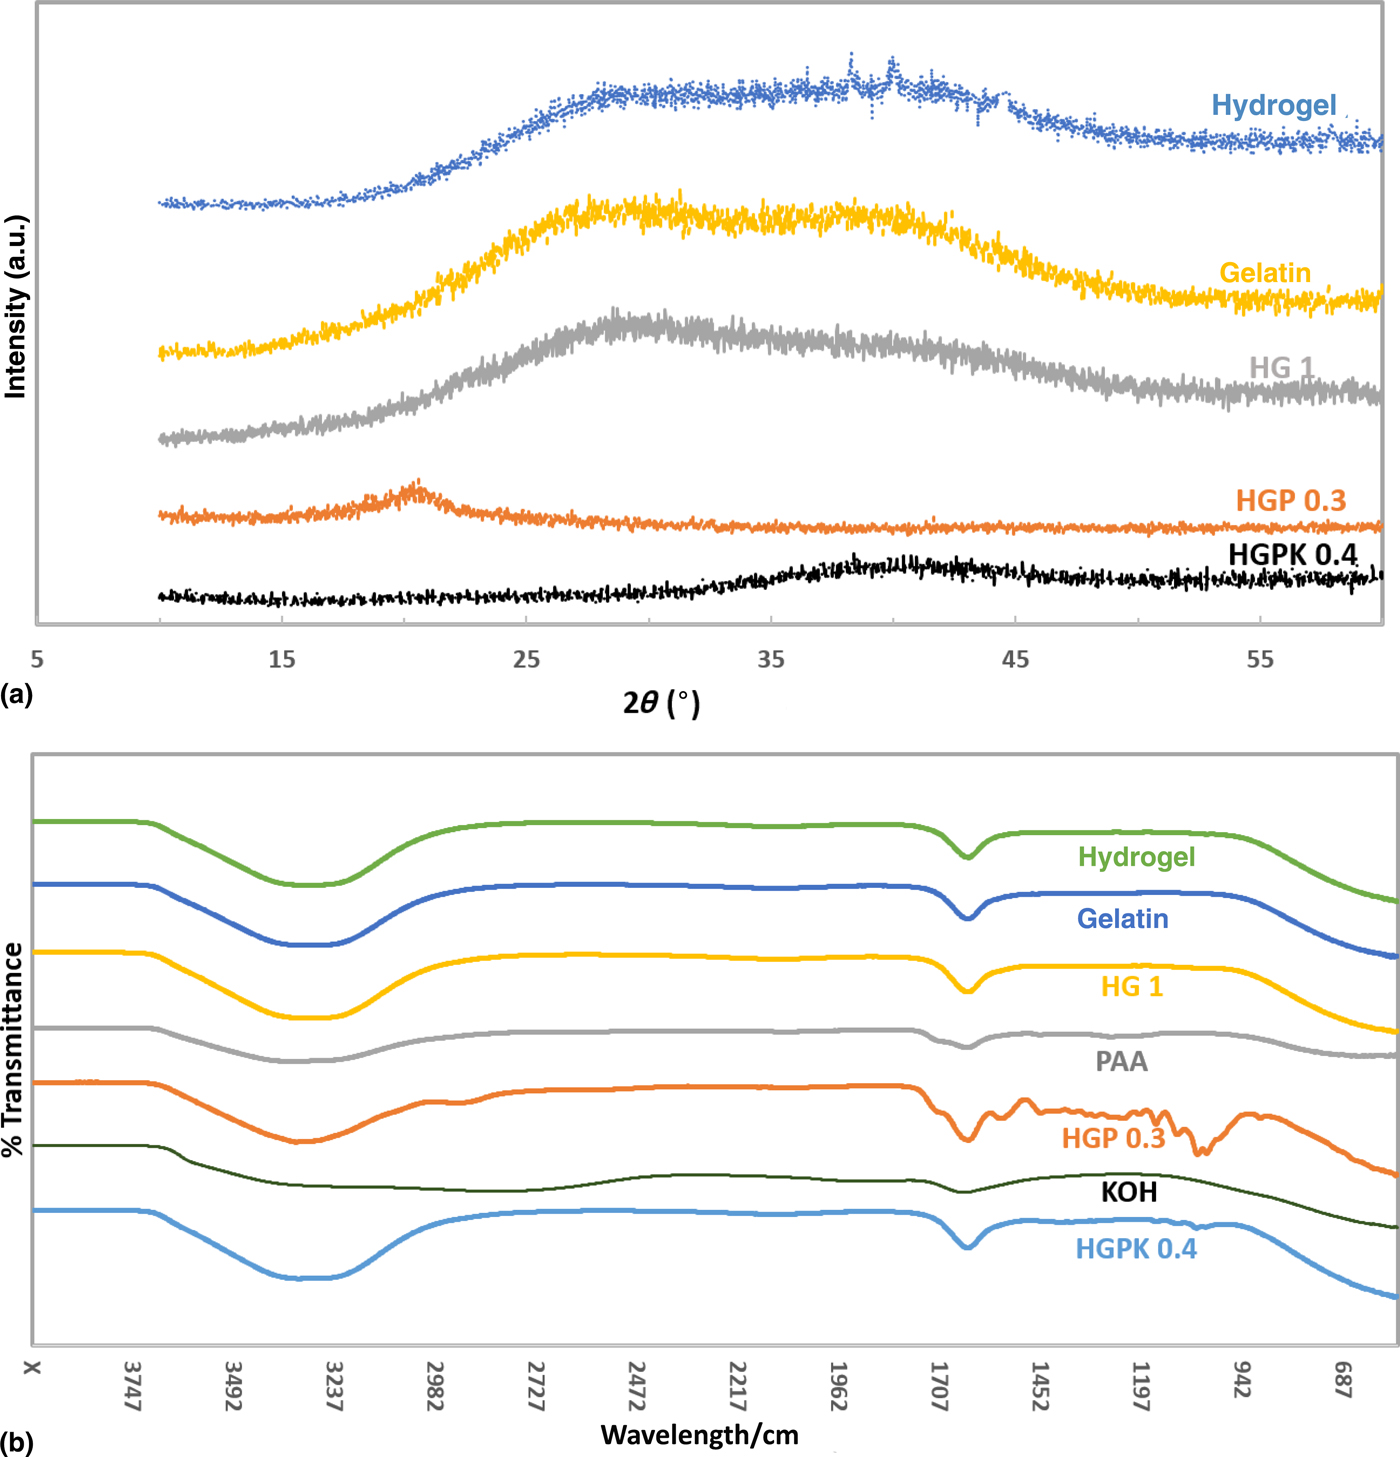
One can also observe that this low-intensity peak disappears on addition of 0.4 wt.% KOH to HGP0.3. Also, the XRD data for HGPK0.4 show no significant peaks indicating it to be the most amorphous. This helps the easy movement of ions without any obstructions in its flow path. This justifies the sample having the best ionic conductivity values, since amorphous nature produces greater ionic diffusivity in polymers with flexible backbone.
Fourier transform infrared
FTIR spectra of various types of samples are shown in Fig. 4(b). The spectra for pure hydrogel was taken in the form it was received. The spectra for gelatin was taken for the liquid form, when gelatin completely dissolves in deionized water. From the spectra, it can be seen that the characteristic peaks of hydrogel and gelatin are fairly the same. There is a broad band at 3415/cm corresponding to the O–H vibration from water[Reference Reddy, Jin, Han, Zhu, Mai and Chen42] that confirms the presence of water in both gelatin and hydrogel. The medium peak at 1656/cm corresponds to the C=C stretching. The characteristic peaks of gelatin obtained agree with the previous research with few missing peaks. We think this is due to the difference in the sample form on which the spectra is performed.
It can be seen that HG1 sample, comprising of hydrogel and gelatin in similar amounts, has the same characteristic peaks without much difference than the pristine samples, even if the sample chosen for spectra is in the gel form. The spectra for PAA exhibits characteristic peaks at 3410, 1720, and 1656/cm; which are assigned to N–H stretching, C=O stretching, and C=C stretching, respectively.[Reference Smitha, Sridhar and Khan43] For the sample HGP0.3, in addition to the peaks of HG1 and PAA samples, a number of additional peaks were recorded, indicating the occurrence of interpenetration/cross-linking causing a number of changes and vibrations. An additional peak at 2900/cm corresponds to stretching of C–H aldehyde bond, at 1554/cm corresponds to C=C stretching, at 1452/cm corresponds to C–H bending, and at 1146, 1095, 1044, and 1018/cm correspond to the combination of C–O bending and stretching. The small disturbances in the spectra in between characteristic peaks indicate occurrence of vibrations in bonds due to interpenetration.[Reference Koul, Mohamed, Kuckling, Adler and Choudhary35–Reference Agrawal and Shukla41] The spectra of KOH most predominantly indicates a very broad peak at ~3410/cm indicating stretched O–H bond. The sample HGPK0.4 obtained by addition of KOH to HGP0.3 indicates the disappearance of various characteristic peaks, indicating the bonds to be in a much more steady state with characteristic peaks similar to pure hydrogel.
Conclusion
In summary, the NFC hydrogel was successfully used as the main constituent for synthesizing a flexible, stable, and high ionic conducting electrolyte. The small amounts of additives helped to improve the mechanical stability and improve the ionic conductivity by means of changing the degree of crystallinity and amount of ionic concentration in the hydrogel layers. Unlike most other gel electrolytes that use non-biodegradable polymers as their base constituents that require high processing stages and temperatures for preparation of gels, the NFC hydrogel electrolytes are cured at temperatures close to room temperature. The best sample obtained after synthesizing and measuring various samples was HGPK 0.4, that is, hydrogel with appropriate amounts of gelatin, PAA, and KOH. It recorded an average ionic conductivity value of 96.89 mS/cm, which is about five orders of magnitude higher than the pristine hydrogel. This is similar to the best ionic conductivity values reported in the literature.
Acknowledgments
The authors would like to thank the University of Maryland, Baltimore County (UMBC) for supporting this research from startup fund. The authors would also like to thank Scott Riley, Karla Negrete, Shiyani Patel, Ryan Lorence, Christopher Gruenke, and Sedzro Tamakloe for their contributions.