Implications
Deterioration of muscle proteins plays a significant role in the loss of quality of fish fillets during frozen storage. This work shows that feed supplemented with essential oils during rainbow trout’s (Oncorhynchus mykiss) breeding prevents oxidative deterioration of particular sarcoplasmic and myofibrillar proteins from the resulting frozen fish fillets in a selectively manner. Such selective effects resulted in a concurrent stabilization of muscle functional properties, the maintenance of water holding capacity (WHC), protein solubility and therefore, texture. The protein stabilization achieved along with a decrease of rancidity and colour loss led to frozen fish fillets with higher organoleptic quality.
Introduction
Recently, great attention has been directed towards the manipulation and control of fish health and production by natural substances as an important area for upcoming developments in aquaculture (Samples, Reference Samples2013). Currently, essential oils from aromatic plants are extensively used in medicine, and food and cosmetic industries (Christaki et al., Reference Christaki, Bonos, Giannenas and Florou-Paneri2012). These oils, which are primarily composed by terpenoids, phenols and aromatic aldehydes, are highly recognized for their antimicrobial and antioxidant activities (Amorati et al., Reference Amorati, Foti and Valgimigli2013). Essential oils have been already included in fish feed for their potential role on disease and immune response and their positive effects on stress and intestinal microbiota regulation in different fish and seafood species (Kim et al., Reference Kim, Nhut, Hai and Ra2011; Giannenas et al., Reference Giannenas, Triantafillou, Stavrakakis, Margaroni, Mavridis, Steiner and Karagouni2012). Previous studies have also shown a possible use of dietary essential oils in aquaculture for preserving quality and shelf life of the final fish products (Álvarez et al., Reference Álvarez, García García, Jordán, Martínez-Conesa and Hernández2012; Hernández et al., Reference Hernández, García García, Jordán and Hernández2015).
Besides their use as antimicrobials, oils added to fish feed seem to increase the oxidative stability of the living fish through maintaining its in vivo redox balance and then, leading to higher oxidative stability of the corresponding fishery products (Rodríguez et al., Reference Rodríguez, Latorre, Gajardo, Bunger, Munizaga, López and Aubourg2015). In agreement to this, rainbow trout (O. mykiss) fed diets supplemented with essential oils consisted of carvacrol and thymol have recently shown to be more protected against flesh lipid oxidation with higher preservation of the activity of glutathione-based enzymes during refrigerated storage (Giannenas et al., Reference Giannenas, Triantafillou, Stavrakakis, Margaroni, Mavridis, Steiner and Karagouni2012).
However, fish muscle is susceptible to suffer protein oxidation as well. A concurrent damage that can seriously affect the organoleptic quality of fishery products, especially during storage and processing of fatty fish species (Kjaersgard et al., Reference Kjaersgard, Norrelykke, Baron and Jessen2006). Lipid oxidation cannot totally explain the development of softening and undesirable textures observed in frozen fish fillets, which have been directly linked to the oxidative modifications and loss of integrity of muscle proteins of meat-based foods by Liu et al. (Reference Liu, Xiong and Chen2009). The oxidative modifications of proteins can be triggered by interactions with lipid oxidation by-products as free radicals, hydroperoxides and aldehydes (Davies and Dean, Reference Davies and Dean1997). Flesh proteins, particularly myofibrillar proteins, are targets of oxidation during fish storage and processing, causing backbone cleavage, formation of intra- and/or inter-cross-links and conversion of some amino acid residues to carbonyl derivatives. Proteins like actin, tropomyosin, myosin light chains 1 and 2, and myosin heavy chain have been found carbonylated in frozen rainbow trout (Kjaersgard et al., Reference Kjaersgard, Norrelykke, Baron and Jessen2006). Pazos et al. (Reference Pazos, Maestre, Gallardo and Medina2013) have reported that fish myofibrillar proteins resulted selectively protected from oxidation during postmortem chilled storage through the external addition of antioxidants to the fillets. Therefore, a specific role of antioxidants on protein carbonylation was suggested. Accordingly, the last outcomes in rodents have demonstrated that muscle protein oxidation is not a random post-translational protein modification but a selective alteration, which specifically affects targeted proteins (Méndez et al., Reference Méndez, Pazos, Gallardo, Torres, Pérez-Jiménez, Nogués, Romeu and Medina2013).
The present study is aimed to investigate the potential postmortem effect exerted by an essential oil mixture included in the feed of rainbow trout (O. mykiss) in protecting specific muscle proteins from oxidation during frozen storage. The contribution of this oriented effect on the quality of the final resulting fishery product was assessed. For that, farmed rainbow trout was fed a conventional diet supplemented with an essential oil mixture containing eucalyptol, carvacrol and thymol, essential oils that are worldwide distributed and have previously used as safe antioxidants and antiseptics in food industry (Christaki et al., Reference Christaki, Bonos, Giannenas and Florou-Paneri2012). The control group was fed commercial feed without supplementation. Then, a comprehensive study of the oxidation occurred on muscle proteins was followed in the corresponding frozen fish fillets stored at –10ºC for 6 months. Protein oxidation was evaluated by using advanced proteomics procedures based on labelling protein carbonyls by fluorescein-5-thiosemicarbazide (FTSC), protein separation on electrophoresis gels and protein identification by MS. This redox technology provides a specific and powerful tool to monitor the oxidative state of each particular protein. Specific oxidized proteins were identified and discussed in terms of the protection exerted by the essential oil mixture and its effect on maintaining the WHC and protein solubility of the frozen fillets. The study was completed with an overview of the organoleptic evaluation and lipid oxidative development in the corresponding frozen fishery product.
Material and methods
Materials
Nonadecanoic acid was purchased from Larodan Fine Chemicals (Malmö, Sweden), FTSC was from Invitrogen (Carlsbad, CA, USA), porcine sequencing-grade modified trypsin was from Promega (Madison, WI, USA) and ProteoBlockTM protease inhibitor cocktail was from Thermo Fisher Scientific (Rockford, IL, USA). Dichloromethane, dithiothreitol, iodoacetamide, ethylenediaminetetraacetic acid (EDTA), trichloroacetic acid, Tris-HCl, sodium phosphate, MgCl2 and bicinchoninic acid (BCA) were purchased from Sigma (St. Louis, MO, USA). Urea, thiourea, SDS, glycine and glycerol were obtained from USB (Cleveland, OH, USA). Bromophenol blue, Coomassie dye PhastGel Blue R-350, ammonium persulphate and 1,2-bis(dimethylamino)ethane were purchased from GE Healthcare Bio-Sciences AB (Uppsala, Sweden). Acrylamide, bis-N,N′-methylene-bis-acrylamide and Bio-Rad protein assay were obtained from Bio-Rad (Hercules, CA, USA). A 33-mm diameter non-sterile syringe filter with a 0.45 µm pore size hydrophilic polyvinylidene difluoride membrane, diethyl ether, methanol and liquid chromatography (LC)-MS grade formic acid, acetonitrile and water for MS/MS analysis were purchased from Merck (Darmstadt, Germany). All other chemicals and reagents used were of analytical reagent grade.
Methods
Preparation of fish samples and storage conditions
Rainbow trout (O. mykiss) were reared in a fish farm located in San Michele all’Adige (Trento, Italy). Eight hundred and sixty-four juveniles (24 weeks old, mean weight 9.50 ± 0.29 g) of rainbow trout (O. mykiss) were randomly distributed into two squared fibreglass tanks (0.7 m3) and allotted to two different dietary treatments. They were fed VITA and ECOFISH (Veronesi S.p.A., Verona, Italy) extruded feeds according to the growing stages and following the producer’s suggestions. Feeds supplemented for 51 weeks with a mixture of essential oils (eucalyptol 3.0%, carvacrol 2.0% and thymol 0.5%) added at a final concentration of 0.02% (w/w) (M samples). Controls were fed the commercial feed without essential oil supplementation (C samples). The commercial feed contained fish meal, soya meal, fish oil, wheat meal, soya oil, pea protein concentrate, wheat, gluten, and additives with a proximate composition and pellet size appropriated for the four growing stages (first stage from weeks 0 to 4; second stage from weeks 4 to 19; third stage from weeks 19 to 25; fourth stage from weeks 25 to 51). The feed composition (g/100 g feed) of the last stage was 42% CP, 22% crude fat, 17% carbohydrates, 7.5% crude ash and 2.2% fibre. Diets were formulated as iso-proteic and iso-lipidic at every stage and feeds were manually distributed according to the manufacturer recommendations as the fish grew. The fish were acclimatized for 6 days before the start of the trial, which was 51 weeks long. During this time, the mean dissolved oxygen was 8.10 ± 1.03 mg/l and the water temperature was 12.58 ± 0.78°C. The maximum rearing density in the experimental tanks was limited to 17.8 kg/m3 during the first stage, 24.4 kg/m3 in the second one, 41.1 kg/m3 in the third one and 41.6 kg/m3 in the last growth stage, equivalent to 110 fish per diet treatment. Water flow and tanks size (up to 12 m3 of volume) were increased accordingly with the growing fish biomass. During the 51 weeks, fish live weight raised up to 1016.5 and 1061.5 g in C and M groups, respectively. The overall feed conversion ratios (total feed consumption/biomass gain) recorded were 0.825±0.018 and 0.817±0.028 for C and M groups, respectively. A low and similar mortality rate was observed, being 0.7% in C and 1.1% in the group M. At the end of the feeding trial, 14 fish for each group (C and M) were sacrificed by percussion and employed for the subsequent analyses. Immediately after slaughtering, fish were gutted, filleted and the fillets were stored at –10°C to evaluate their physical and chemical changes during 6 months of storage. Four fillets for each group were analysed as biological replicates at the initial time of the storage (day 0) and after 30, 45, 75, 105, 135 and 165 days. These time points were selected in order to comprehensively describe the changes in lipids and proteins in fish flesh at –10°C, covering the most common range of storage times for frozen fish.
Protein analyses
Sarcoplasmic and myofibrillar protein extractions
At each sampling time, 400 to 500 mg of muscle from each replicate (four fillets per group) were homogenized with an Ultra-Turrax high-performance disperser (IKA-Werke, Staufen, Germany), in 25 volumes of 20 mM sodium phosphate, pH 6.0, 0.5 mM MgCl2, 1 mM EDTA, 10 μl/ml buffer of ProteoBlockTM protease inhibitor cocktail (100 mM AEBSF HCl, 80 μM aprotinin, 5 mM bestatin, 1.5 mME64, 2 mM leupeptin and 1 mM pepstatin A). Homogenized samples were centrifuged at 100 000×g for 1 h at 4ºC and sarcoplasmic fraction was recovered in the supernatants. Myofibrillar fraction was isolated by homogenization the remaining pellets in 10 volumes of 10 mM Tris-HCl, pH 7.2, 0.6 M NaCl, 1 mM EDTA, 10 μl/ml buffer of ProteoBlockTM protease inhibitor cocktail. After centrifugation at 16 000×g for 15 min at 4ºC, myofibrillar fraction, contained in the supernatants, was filtered by using a 33-mm diameter non-sterile syringe filter with a 0.45 µm pore size hydrophilic polyvinylidene difluoride membrane, in order to eliminate contaminants and improve the subsequent electrophoretic separation. Finally, both protein fractions were maintained at –80ºC until the electrophoretic analysis (Méndez et al., Reference Méndez, Pazos, Gallardo, Torres, Pérez-Jiménez, Nogués, Romeu and Medina2013).
Protein solubility
Protein concentrations were determined in sarcoplasmic and myofibrillar fractions by employing the BCA assay (Smith et al., Reference Smith, Krohn, Hermanson, Mallia, Gartner, Provenzano, Fujimoto, Goeke, Olson and Klenk1985). Concentration curves were built using bovine serum albumin as reference standard. Protein solubility in each experimental storage time was calculated as regards to initial time and expressed in terms of fold-change. This fold-change was calculated as follows:
 $$\eqalignno{ & {\rm Fold}\,{\rm change}\,{\rm protein}\,{\rm solubility}\,{\rm at}\,{\rm Xth}^{{\asterisk}} \,{\rm storage}\,{\rm day}\, \cr & \quad {\equals} {\rm log}_{2} {{\left( {{\rm g}\,{\rm protein}/{\rm kg}\,{\rm flesh}} \right)\,{\rm at}\,{\rm Xth}^{{\asterisk}} \,{\rm storage}\,{\rm day}} \over {\left( {{\rm g}\,{\rm protein}/{\rm kg}\,{\rm flesh}} \right)\,{\rm at}\,{\rm 0th}\,{\rm storage}\,{\rm day}}}$$
X th* = 0, 30, 45, 75, 105, 135 and 165th storage day.
Fluorescein-5-thiosemicarbazide labelling of protein carbonyls
Protein oxidation levels in the sarcoplasmic and myofibrillar protein fractions from flesh muscle were independently measured by following a fluorescence-based assay (Méndez et al., Reference Méndez, Pazos, Gallardo, Torres, Pérez-Jiménez, Nogués, Romeu and Medina2013), which employs the reagent FTSC for selectively labelling carbonyl moieties generated on proteins. After labelling, protein concentration was determined by Bradford assay (Bradford, Reference Bradford1976) and FTSC-labelled proteins were stored at –80ºC until use.
Gel electrophoresis analysis
In total, 25 μg of FTSC-labelled samples was subjected to 1-D SDS-PAGE as suggested by Laemmli (Reference Laemmli1970) and run in a Mini-PROTEAN 3 cell (Bio-Rad). After electrophoresis, carbonlylated proteins were visualized by exposing gels to a UV transilluminator Molecular Imager Gel Doc XR System (Bio-Rad, Hercules, CA, USA), equipped with a 520 nm band-pass filter (520DF30 62 mm). After measuring fluorescent signal, gels were stained overnight with Coomassie dye to visualize total protein level.
Image analysis
Scanned mono-dimensional gels were analysed with the 1-DE gel analysis software LabImage 1D (Kapelan Bio-Imaging Solutions, Halle, Germany). Global and specific protein carbonylation level for each sample was quantified based on the overall optical volume per each lane/band in the FTSC-stained gel. To normalize protein carbonylation level with protein abundance and offsets possible differences in protein loading and protein concentration, the carbonylation index was estimated accordingly to Méndez et al. (Reference Méndez, Pazos, Gallardo, Torres, Pérez-Jiménez, Nogués, Romeu and Medina2013). The carbonylation index was calculated by the densitometric analysis of the gels. This carbonylation index is the result of dividing the fluorescence signal intensity measured in the FTSC-stained gel by the optical signal intensity measured in the corresponding Coomassie blue-stained gel, as follows:
 $$\eqalignno{ & {\rm Protein}\,{\rm carbonylation}\,{\rm index}\,{\rm at}\,{\rm Xth}^{{\rm {\asterisk}}} \,{\rm storage}\,{\rm day} \cr & \quad {\equals}{{{\displaystyle{{\rm Lane/band}\,{\rm fluorescent}\,{\rm intensity}\,{\rm for}\,{\rm the}\,{\rm FTSC{\hbox -}} \atop {\rm stained}\,{\rm gel}\,{\rm at}\,{\rm Xth}^{{\asterisk}} \,{\rm storage}\,{\rm day}}}} \over{\displaystyle{{{\rm Lane}/{\rm band}\,{\rm optical}\,{\rm intensity}\,{\rm for}\,{\rm the}\,{\rm Coomassie}\,{\rm blue{\hbox -}} \atop {\rm stained}\,{\rm gel}\,{\rm at}\,{\rm Xth}^{{\asterisk}} \,{\rm storage}\,{\rm day}}}$$
X th* = 0, 30, 45, 75, 105, 135 and 165th storage day.
To determine how protein carbonylation changed during frozen storage, protein carbonylation index at each storage time was divided to the carbonylation index at initial time (0th) and expressed in terms of fold-change. This fold-change was calculated as follows:
 $$\eqalignno{ & {\rm Fold}\,{\rm change}\,{\rm protein}\,{\rm carbonylation}\,{\rm index}\,{\rm at}\,{\rm Xth}^{{\asterisk}} \,{\rm storage}\,{\rm day}\,\cr & \quad {\equals}{\rm log}_{2} {{{\rm carbonylation}\,{\rm index}\,{\rm at}\,{\rm Xth}^{{\asterisk}} \,{\rm storage}\,{\rm day}} \over {{\rm carbonylation}\,{\rm index}\,{\rm at}\,0{\rm th}\,{\rm storage}\,{\rm day}}}$$
X th* = 0, 30, 45, 75, 105, 135 and 165th storage day.
Identification of proteins by liquid chromatography-tandem MS
Bands corresponding to proteins of interest were excised from gels and digested in situ with sequencing grade bovine trypsin, according to Jensen et al. (Reference Jensen, Wilm, Shevchenko and Mann1998). The chromatographic separation and protein identity were ascertained by a binary LC system model Agilent 1260 Series (Agilent Technologies, Santa Clara, CA, USA), coupled to a linear ion trap mass spectrometer LTQ Velos Pro with an electrospray ionization interface (Thermo Scientific, San Jose, CA, USA) according to Méndez et al. (Reference Méndez, Pazos, Gallardo, Torres, Pérez-Jiménez, Nogués, Romeu and Medina2013). Protein identification was performed using the database searching function of the PEAKS 7 software (Bioinformatics Solutions Inc., Waterloo, ON, Canada) (Ma et al., Reference Ma, Zhang, Hendrie, Liang, Li, Doherty-Kirby and Lajoie2003), to compare experimental MS/MS spectra against reference MS/MS spectra from the UniProtKB/TrEMBL database, which also included their respective decoy sequences.
Water holding capacity and texture
Water holding capacity was determined by calculating the percentage of water loss after centrifugation (Hultmann and Rustad, Reference Hultmann and Rustad2002). Briefly, at each sampling point 2 g of flesh were sampled from each replicate (four fillets per group) and were inserted into plastic cylinders equipped with a filter net. Those cylinders were centrifuged at 210×g for 5 min to remove free water from each sample. Water holding capacity was calculated as difference between the initial gross weight of cylinders with sample and their gross weight after centrifugation, divided by the water content of the minced sample. Water content was determined gravimetrically by weighing 2 g of sample before and after evaporation at 105°C overnight. Three replicates for each sample were analysed.
Texture measurements were performed using a Zwick Roell® texturometer model KAF-TC 0901279 (Zwick GmbH & Co. KG, Ulm, Germany) equipped with a 200 N load cell. One cycle compression test was done using a 10-mm diameter cylindrical probe at a constant speed of 30 mm/min to 50% of total deformation. Textural attributes were measured on the epaxial-cranial parts of the fillets. Data were collected and analysed by the Test-Xpert2 by Zwick Roell® software version 3.0. Hardness, cohesiveness, resilience, gumminess and adhesiveness were calculated as described by Veland and Torrissen (Reference Veland and Torrissen1999).
Lipid content and oxidation items
Lipid content and fatty acid profiles
Total lipids were extracted from fish fillets at the day 0 (four fillets per group) according to Bligh and Dyer (Reference Bligh and Dyer1959) method and quantified gravimetrically. Then, 100 µl of lipid extract were methylated according to Lepage and Roy (Reference Lepage and Roy1986) and nonadecanoic acid (19 : 0) was added as an internal standard. The fatty acid methyl esters (FAMEs) produced were then analysed by gas chromatography (GC) according to Christie (Reference Christie1982). A calibration curve was obtained with the standard Supelco 37 component FAME mix (Sigma-Aldrich, Saint-Louis, MO, USA) and utilized for fatty acid quantification.
Lipid oxidation: 2-thiobarbituric acid reactive substances, conjugated diene hydroperoxides and volatiles
The 2-thiobarbituric acid reactive substances (TBARS) were measured according to Vyncke (Reference Vyncke1970). Results were expressed as milligram of malondialdehyde (MDA-eq) equivalents/kg sample. Conjugated dienes (CDs) were measured according to the American Oil Chemists' Society (1947) method. Results were expressed as millimole hydroperoxides/kilogram lipid. Volatile compounds were extracted by headspace solid phase microextraction and analysed by GC–MS as suggested by Iglesias and Medina (Reference Iglesias and Medina2008). All the mentioned analyses were performed on four fillets per group at each sampling times.
Statistical analysis
The data were submitted to a two-ways ANOVA by the PROC GLM of statistical analysis software SAS® 9.1 (SAS, 2004) for Windows, where the fixed factors were diet (two levels: C and M) and storage (seven levels: 0, 30, 45, 75, 105, 135 and 165 days). The interaction diet × storage was also tested but removed from the statistical model because not significant. Means were compared by the Tukey's Post Hoc Test. Significant difference was set at P < 0.05.
Results
Protein analyses
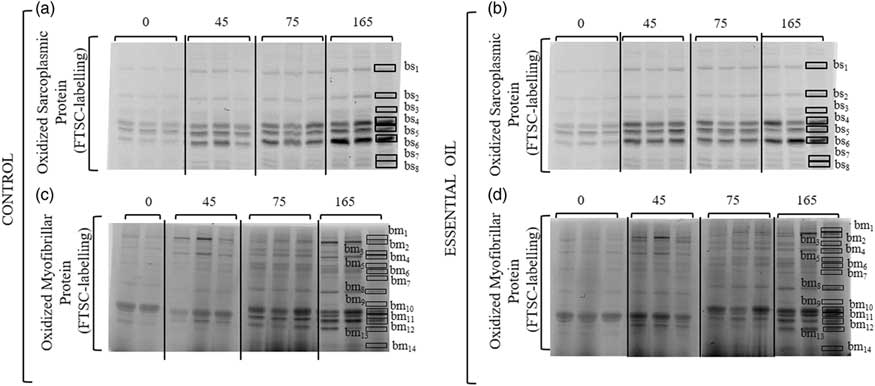
Protein carbonylation in M and C samples is displayed in the FTSC-stained gels of Figure 1 and Supplementary Figure S1 for sarcoplasmic (panels (a) and (b)) and myofibrillar (panels (c) and (d)) proteins during frozen storage, respectively. Data for sarcoplasmic proteins (Supplementary Figure S2) showed a clear increase in protein carbonylation during frozen storage. For both dietary groups of samples protein oxidation was promptly detected from the beginning of the storage and its value was slightly incrementing during the whole trial period. By the 75th day, the values corresponding to C samples were higher than those of M samples, being significantly elevated at the end of the storage (P < 0.05).
Effect of diet and frozen storage on carbonylation level of sarcoplasmic and myofibrillar proteins from rainbow trout (Oncorhynchus mykiss) muscle. (a) Representative mono-dimensional electrophoresis (1-DE) fluorescein-5-thiosemicarbazide (FTSC)-stained gel of sarcoplasmic proteins from control diet during 165 days of frozen storage (–10°C). (b) Representative 1-DE FTSC-stained gel of sarcoplasmic proteins from essential oil diet during 165 days of frozen storage (–10°C). (c) Representative 1-DE FTSC-stained gel of myofibrillar proteins from control diet during 165 days of frozen storage (–10°C). (d) Representative 1-DE FTSC-stained gel of myofibrillar proteins from essential oil diet during 165 days of frozen storage (–10°C).

As regards to the myofibrillar proteins (Figure 1c and d), protein carbonylation levels were kept greatly stable during the first 45 days and significantly lower than those found in the sarcoplasmic fraction. By the 75th day, both C and M proteins increased their carbonylation indices if compared to the initial time. However, this increase was significantly (P < 0.05) lower in M samples than in controls. Therefore, M proteins showed markedly lower carbonylation than C proteins by the day 75 and this beneficial effect was maintained up to the end of frozen storage.
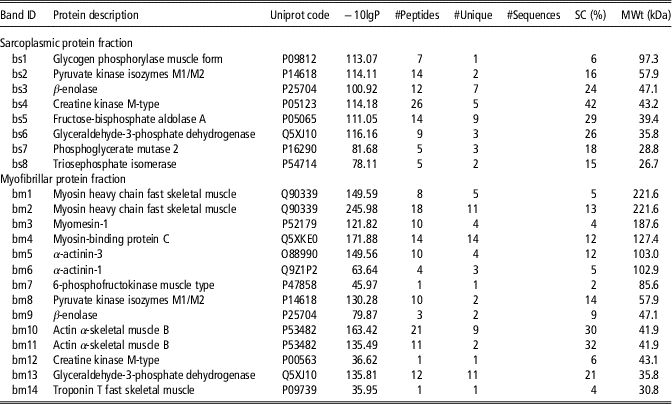
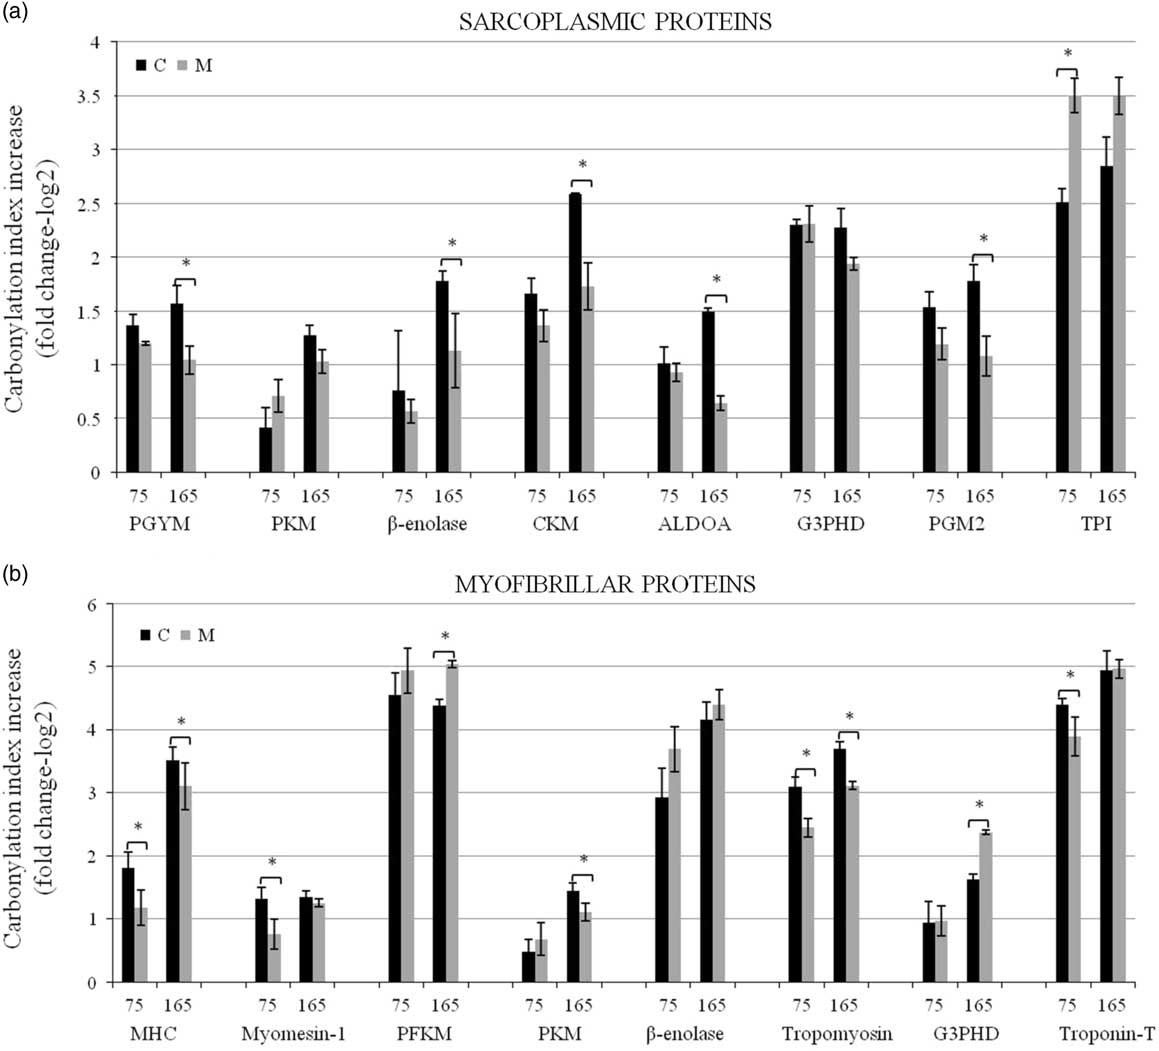
This visualization of protein carbonyls on gels reported a specific increase of carbonylation for some sarcoplasmic and myofibrillar proteins in both C and M groups. Table 1 shows these particular protein targets which were found carbonylated and identified by LC-MS/MS. The initial carbonylation level of sarcoplasmic proteins corresponding to fresh samples (Figure 1a and b), was mainly attributed to three proteins: creatine kinase M-type (CKM) (bs4), fructose-bisphosphate aldolase A (ALDOA) (bs5) and glyceraldehyde-3-phosphate dehydrogenase (G3PDH) (bs6). There were not significant differences (P > 0.05) between the initial carbonylation level between C and M groups (Figure 2a). During frozen storage, a significant (P < 0.05) increase of carbonylation of these three proteins, already significant since the 30th day, was observed in both dietary groups. At the same time, other five proteins increased their carbonylation indices from their initial stage, revealing themselves as early oxidation targets during frozen storage: glycogen phosphorylase muscle form (PYGM) (bs1), pyruvate kinase isozymes M1/M2 (PKM) (bs2), β-enolase (bs3), phosphoglycerate mutase 2 (PGM2) (bs7) and triosephosphate isomerase (bs8). Interestingly, essential oil supplementation of the diet exerted a selective protective effect on the inhibition of protein oxidation of PYGM, PKM, CKM, ALDOA and PGM2, especially visible from the 75th day (Figure 2a).
Proteins identified from mono-dimensional SDS-PAGE gels of both sarcoplasmic and myofibrillar (Figures 1 and 4) protein fractions from the muscle of rainbow trout (Oncorhynchus mykiss) fed control or essential oil diets1

1 Bands of interest were identified by LC-ESI-IT-MS/MS (liquid chromatography-electrospray ionization-ion trap-tandem MS) as described in the experimental procedure. Protein band ID refers to numbered band on Figures 1 and 4. For each protein band, different parameters supporting the protein identification by MS are indicated: Peaks protein score (–10lgP), number of matching total and unique peptides at false discovery rate<1%, peptide sequences, % sequence coverage (SC) and theoretical protein mass (MWt).
Individual carbonylation indices of sarcoplasmic (a) and myofibrillar (b) proteins corresponding to 75 and 165 days of frozen storage (–10°C) in muscle of rainbow trout (Oncorhynchus mykiss) from control (C) and essential oil (M) diets. The values are expressed as fold change regarding to initial time (0 days). PYGM = glycogen phosphorylase muscle form; PKM = pyruvate kinase isozymes M1/M2; CKM = creatine kinase M-type; ALDOA = fructose bisphosphate aldolase A; G3PDH = glyceraldehyde-3-phosphate dehydrogenase; PGM2 = phosphoglycerate mutase 2; TPI = triosephosphate isomerase; MHC = myosin heavy chain fast skeletal muscle; PFKM = 6-phosphofructokinase muscle type. *Represents significant differences (P < 0.05) between diets.

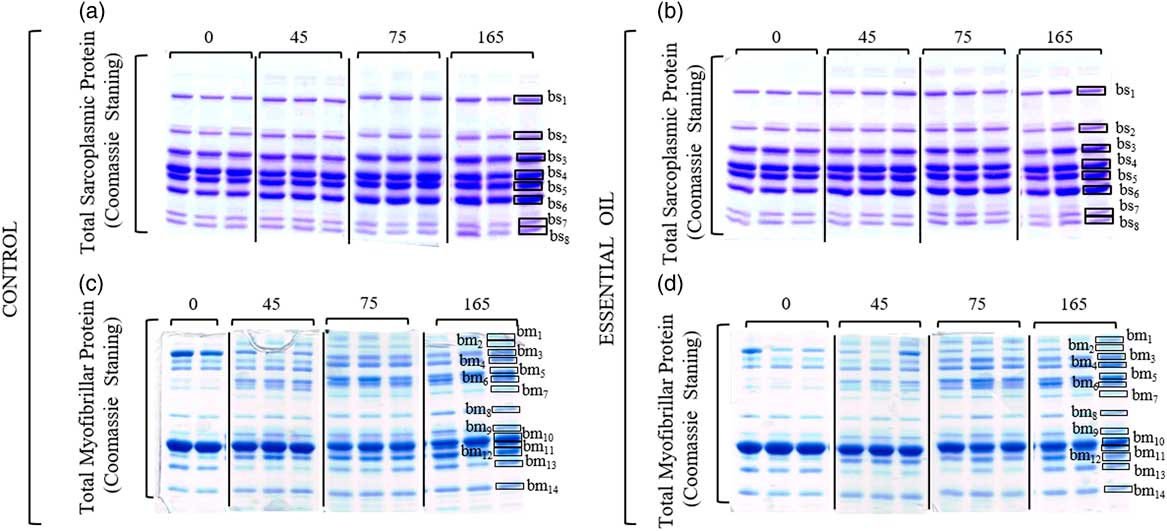
In agreement with sarcoplasmic proteins, no significant (P < 0.05) differences between C and M groups were found in the oxidation of myofibrillar proteins at the first phase of storage. The main protein found oxidized in both groups at 0 day was bm10, identified as actin α skeletal muscle B. To a lesser extent, other proteins were identified as protein oxidation targets in myofibrillar fresh samples, mainly myosin heavy chain fast skeletal muscle (MHC) (bm2), myosin-binding protein C (bm4), α-actinin-1 (bm6), PKM (bm8) and G3PDH (bm13). During the first 45 days of frozen storage, oxidation of MHC and myosin-binding protein C was increased in C and M groups and tropomyosin-α 1 (bm12) was found oxidized as well (Figure 1c and d).
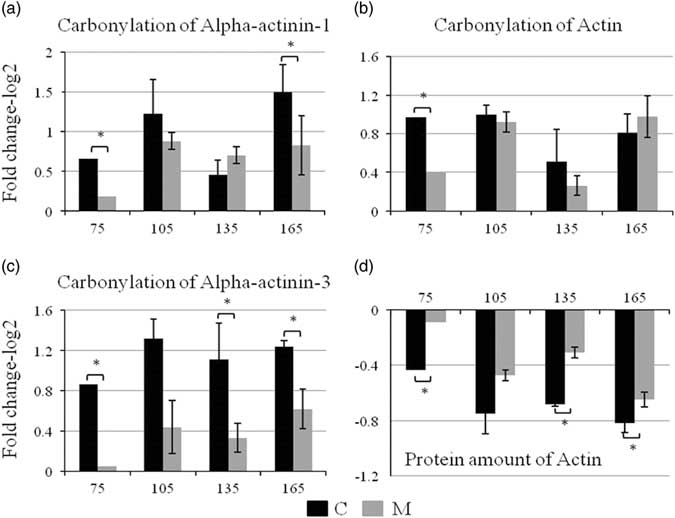
By the 75th day, significant (P < 0.05) increases in the carbonylation indices in myomesin-1 (bm3), α-actinins-1 (bm5) and -3 (bm6), 6-phosphofructokinase muscle type (bm7), PKM, β-enolase, actin α skeletal muscle B, G3PDH and troponin T fast skeletal muscle (bm14) were determined for both C and M groups (Figure 2b). Again, a specific and oriented protection due to essential oils was detected by inducing minor carbonylation indices for actinins, especially for the α-actinin 3, and α-actin (Figure 3a to c). Besides the significant inhibition of actin oxidation, essential oils also protected its stability as well (Figure 3d). Results showed that after 75 days of frozen storage, the amount of actin of C samples was significantly lost. Meantime, feed supplemented with essential oil resulted in a delay of the loss of actin amount in M samples, which was accompanied by its effect in decreasing actin carbonylation.
Evolution of individual carbonylation indices corresponding to the myofibrillar (a) α-actinins-1, (b) -3 and (c) actin from 75 to 165 days of frozen storage (–10°C) in muscle of rainbow trout (Oncorhynchus mykiss) from control (C) and essential oil (M) diets. Evolution in protein amount of (d) actin is also showed for this experimental period. All values are expressed as fold change regarding to the initial time (0 days). *Represents significant differences (P < 0.05) between diets.

Further analyses of Coomassie blue-stained gels concerning protein degradations revealed no changes in sarcoplasmic protein profiles (Figure 4a and b and Supplementary Figure S2a and b). However, an important degradation of several other myofibrillar proteins were observed after 45 days of frozen storage. This was especially evident for the group C (Figure 4c and d and Supplementary Figure S2c and d). There was also detected a decrease in the concentration of MHC from the beginning of the frozen storage in both groups C and M. This finding was supported by the emergence of degradation products bands and the relative increments in the amount of proteins such as myomesin-1, myosin-binding protein C and the isoforms 1 and 3 of α-actinin.
Effect of diet and frozen storage on total protein level of sarcoplasmic and myofibrillar proteins from rainbow trout (Oncorhynchus mykiss) muscle. (a) Representative mono-dimensional electrophoresis (1-DE) Coomassie blue-stained gel of sarcoplasmic proteins from control diet during 165 days of frozen storage (–10°C). (b) Representative 1-DE Coomassie blue-stained gel of sarcoplasmic proteins from essential oil diet during 165 days of frozen storage (−10°C). (c) Representative 1-DE Coomassie blue-stained gel of myofibrillar proteins from control diet during 165 days of frozen storage (–10°C). (d) Representative 1-DE Coomassie blue-stained gel of myofibrillar proteins from essential oil diet during 165 days of frozen storage (–10°C).

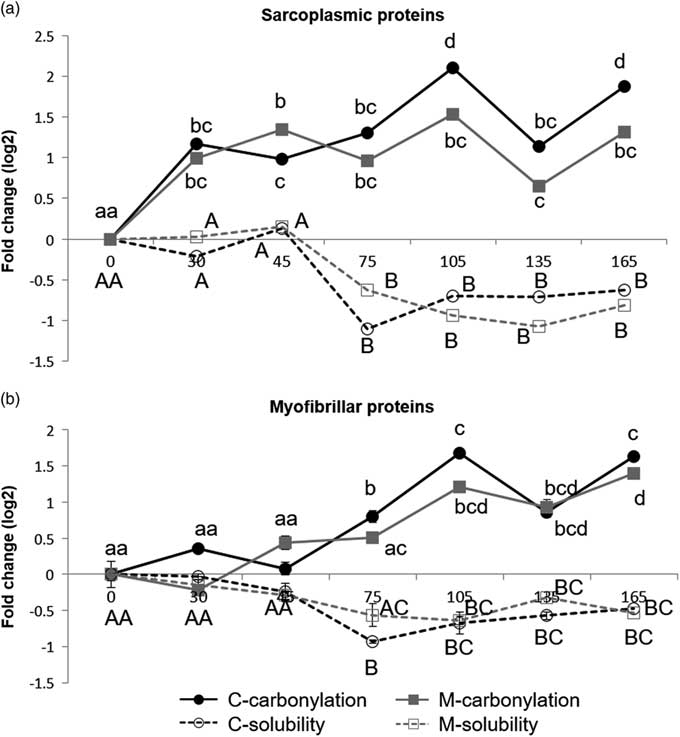
Graphical representations of the fold-change of protein carbonylation indices in each protein fraction, which were calculated after gel analyses as it was described in the ‘Material and methods’ section, are shown in Figure 5a for sarcoplasmic proteins and in Figure 5b for the myofibrillar ones. Besides protein carbonylation fold-changes, Figure 5 also shows the fold-change of protein solubility in each sampling. Results showed a close dependence of the loss of protein solubility on the occurred carbonylation (Figure 5). Protein solubility of sarcoplasmic proteins (Figure 5A) remained stable during the first 45 days in both C and M samples, followed by a significant drop by the 75th day. This decrease was slowed down by the addition of the essential oils, matching with the lower increases in the carbonylation level of these proteins. Moreover, the greater protein oxidation level detected by the 75th day to the end of the experimental period, the lower protein solubility measured. In agreement with sarcoplasmic proteins, protein solubility of myofibrillar proteins (Figure 5b) remained stable during the first 45 days in both C and M samples, followed by a significant drop by the 75th day, concurrent with the increase of carbonylation described above. A significant (P < 0.05) protective effect from essential oils could be seen in the myofibrillar fraction and M proteins remained more soluble than controls by the 75th day.
Evolution of protein solubility and global carbonylation in sarcoplasmic (a) and myofibrillar (b) protein fractions during 165 days of frozen storage (–10°C) in muscle of rainbow trout (Oncorhynchus mykiss) fed control (C) and essential oil (M) diets. The values corresponding to each time are expressed as fold change regarding to initial time (0 days). Means with different lowercase letters are significantly different at P < 0.05 for changes in protein carbonylation values. Means with different capital letters are significantly different at P < 0.05 for changes in protein solubility values. Means with same letters are not significantly different (P > 0.05).

Water holding capacity and texture
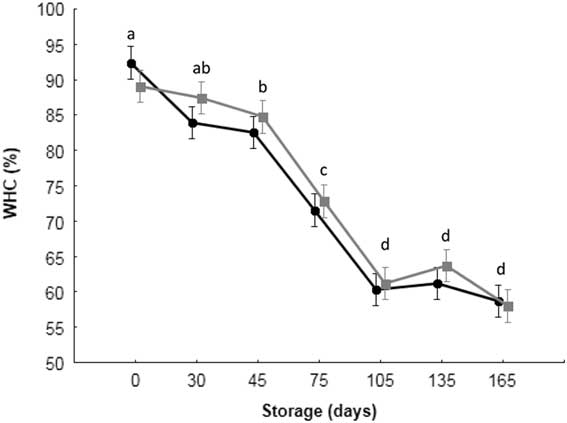
Figure 6 shows the loss of WHC of trout fillets during the whole frozen storage. Water holding capacity of C samples decreased rapidly during the first 30 days and then, by day 45th, a pronounced drop was detected up to the 105th day (P < 0.05). However, WHC of M samples remained more stable during the first 45 days, tending to decrease slower than control samples.
Water-holding capacity (WHC) during 165 days of frozen storage (–10°C) in muscle of rainbow trout (Oncorhynchus mykiss) from control (●) and essential oil ( ) diets. Means with different letters are significantly different at P < 0.05 among days of storage. Means with same letters are not significantly different (P > 0.05).

The textural properties of rainbow trout fillets were affected by frozen storage (P < 0.001) in both groups of samples, C and M (Supplementary Table S1). In general, hardness was constant up to the 45th day and then it slowly decreased in C samples along the storage, reaching values significantly lower (P < 0.05) in C than in M samples at the 165th day. Cohesiveness, resilience and gumminess increased during the 1st weeks and kept rather constant during the whole frozen storage. At the 165th day, resilience values were significantly higher (P < 0.05) in M than in C samples. Interestingly, adhesiveness was also significantly affected by essential oil enriched feed. Indeed, adhesiveness of M fillets was significantly higher (P < 0.05) from the 75th to 105th days of frozen storage. However, after these times M samples showed values significantly (P < 0.05) lower than their C counterparts. At the end of the storage (165 days), M samples showed the highest hardness and resilience values (P < 0.05).
Lipid content and oxidation items
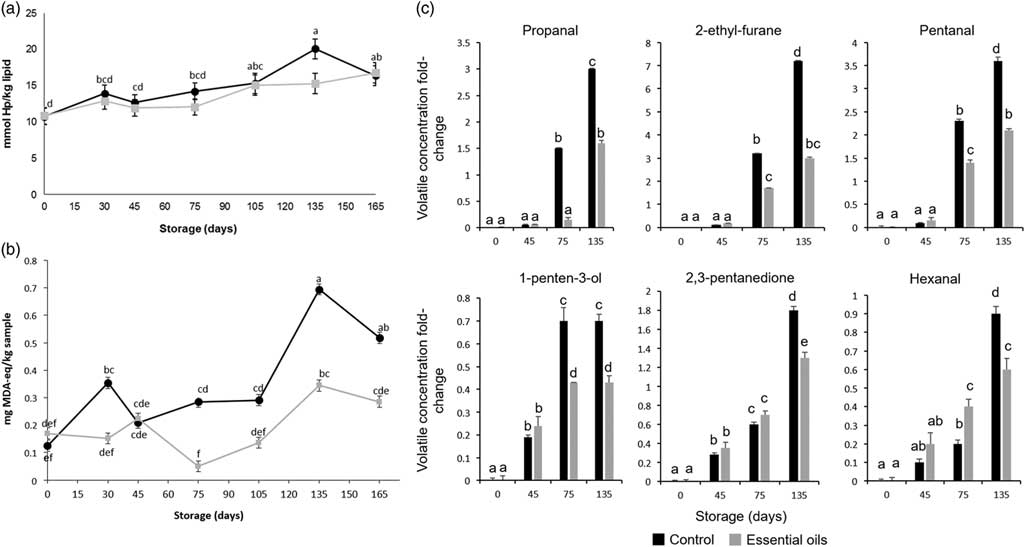
Total lipid content and fatty acid composition (Supplementary Table S2) in farmed rainbow trout muscle were not affected (P > 0.05) by the dietary intervention with essential oil. Regarding lipid oxidation products, Figure 7 shows the formation of CD hydroperoxides (Figure 7a) and TBARS (Figure 7b) during experimental time for both dietary groups. Conjugated diene hydroperoxides and TBARS of C samples revealed an increase of lipid oxidation during the frozen storage time, exhibiting an initiation stage of 45 days followed by an increase in both parameters, especially noted for TBARS values (Figure 7b). No significant differences (P > 0.05) between C and M samples were detected for the first 45 days of frozen storage. There was a trend for M samples towards lower values of CD hydroperoxides (Figure 7a) than C group during the whole storage, being significantly lower (P < 0.05) by 135 day. Moreover, significant lower values (P < 0.05) of TBARS (Figure 7b) were measured in the fillets corresponding to mix oil supplementation after 45th day of storage. These data were in agreement with the sensory detection of the onset of rancidity, which clearly occurs for the 75th day of storage onwards (data not shown).
Conjugated diene hydroperoxides (Hp, expressed as mmol Hp/kg lipid) (a), 2-thiobarbituric acid reactive substances (TBARS expressed as milligram of malondialdehyde (MDA-eq) equivalents/kg sample) (b) and increment of main volatiles (c) during 165 days of frozen storage (–10°C), in muscle of rainbow trout (Oncorhynchus mykiss) fed control or essential oil diets. Means with different letters are significantly different at P < 0.05 among days of storage. Means with same letters are not significantly different (P > 0.05).

Finally, the increment (fold-change) in the concentrations of propanal, pentanal, hexanal, 2-ethyl-furane, 1-penten-3-ol, 2,3-pentanedione and 1-octen-3-ol during the frozen storage is shown in Figure 7c. For both C and M samples, data demonstrated a stable volatile generation for the first 45 days of frozen storage, followed by a significant increase (P < 0.05) in most of them by the between the 45th and 75th days. However, C samples showed significantly bigger increases (P < 0.05) for most of these volatiles than M samples by the 75th day up to the end of the frozen storage.
Discussion
This works demonstrated that the supplementation of rainbow trout’ feed with essential oils improved the postmortem organoleptic quality of the flesh during frozen storage through a highly selective antioxidant protection against carbonylation of target protein in the fillets.
In general terms, the more protein carbonylation level increase during frozen storage, the less protein solubility was. It has been reported that protein carbonylation leads to the formation of insoluble protein aggregates (Nystrom, Reference Nystrom2005), which may explain the loss of protein solubility occurred during storage. Likewise, the protection against protein carbonylation exerted by essential oils on sarcoplasmic and myofibrillar protein may explain the slowdown in the loss of protein solubility, WHC and finally, the improve of texture.
Results showed that both sarcoplasmic and myofibrillar muscle proteins had differential susceptibility to suffer carbonylation during frozen storage. Myofibrillar proteins seemed to be less susceptible to oxidation than the sarcoplasmic ones. Remarkably, they also were very differentially susceptible to the antioxidant protection of essential oil diet. Among the eight sarcoplasmic proteins targets of carbonylation, only three (CKM, PKM and isoforms of enolase) had been previously described as carbonylation targets in rainbow trout muscle after 2 years of frozen storage (Kjaersgard et al., Reference Kjaersgard, Norrelykke, Baron and Jessen2006). Furthermore, the oriented protective impact of essential oil supplementation against the oxidation of PYGM, PKM, CKM, ALDOA and PGM2 can explain the lower values of global sarcoplasmic protein carbonylation and the protection on protein solubility. This finding is strengthened if considering that CKM and ALDOA, which are two of the most abundant proteins in sarcoplasmic fraction, showed the highest carbonylation indices. Sayd et al. (Reference Sayd, Morzel, Chambon, Franck, Figwer, Larzul, Le Roy, Monin, Cherel and Laville2006) have proved that denaturation of sarcoplasmic proteins has a critical impact on meat and fish quality parameters. Previous researches have reported that the enzyme PGM could be an effective biomarker for fish quality losses during storage, due to its high lability to deterioration (Ortea et al., Reference Ortea, Rodríguez, Tabilo-Munizaga, Pérez-Won and Aubourg2010). Therefore, the protection exerted by the essential oils on PGM2 against carbonylation seemed to corroborate the overall beneficial effect of the supplementation of fish feed. Moreover, this selective effect can be related to the improvement of texture parameters reported in this research because the stability of some of them, that is, PYGM and CKM has been previously associated with texture parameters of rainbow trout muscle (Godiksen et al., Reference Godiksen, Morzel, Hyldig and Jessen2009).
In the myofibrillar fraction, we described an early important degradation of MHC. A previous study has indicated a strong vulnerability of MHC to oxidative processes during storage and it is well known that myosin is by far the most sensitive protein to denaturation during frozen storage (Matsumoto, Reference Matsumoto1980). Curiously, tropomyosin, which is considered the most stable myofibrillar protein (Matsumoto, Reference Matsumoto1980), was found as carbonylation target but was not found degraded. The susceptibility of this protein to oxidation during frozen storage of rainbow trout fillets for 2 years without effect on its concentration has been previously reported by Kjaersgard et al. (Reference Kjaersgard, Norrelykke, Baron and Jessen2006). It should be noted that this protein seems to suffer delocalization during the myofilament degradation occurred postmortem, rather than proteolysis (Delbarre-Ladrat et al., Reference Delbarre-Ladrat, Cheret, Taylor and Verrez-Bagnis2006). Our results agreed with these previous findings since Coomassie blue-stained gels did not show any proteolysis of tropomyosin although its oxidation was increased.
The antioxidant effect of essential oils found in this work on actinins might be especially relevant because α-actinins are key components of the vertebrate muscles Z-disk, directly implied in their organization and stability (Lund and Nielsen, Reference Lund and Nielsen2001). Accordingly, the postmortem release of fish white muscle α-actinin from Z-line during postmortem degradation, has been proposed as a marker of muscle disorganization by Papa et al. (Reference Papa, Álvarez, Verrez-Bagnis, Fleurence and Benyamin1996). It is also noteworthy the relevant role of essential oil enriched diet in preventing the loss of actin. A recent study has shown an extensive oxidation of actin in chilled fish mince and the ineffectiveness of a well-recognized natural antioxidant as catechin in protecting this protein from oxidation, with a consequent negative impact on fish texture (Pazos et al., Reference Pazos, Maestre, Gallardo and Medina2013).
Essential oils also affected lipid oxidation products, by retarding the propagation phase of oxidation and inhibiting the level of oxidation products formed. Regarding primary lipid oxidation products, CDs levels are used as an indication of the early stages of rancidity and values ⩽20 mmol/kg are considered acceptable for fish oil supplements (Opperman et al., Reference Opperman and Benade2013). M samples were below the ‘limit of acceptability’, for the whole storage period, but C sample showed values about that limit by the 135 days. These data were in agreement with the secondary lipid oxidation products. Ke et al. (Reference Ke, Linke and Smith-Lall1982) proposed that TBARS values for fish products below 0.58 mg/kg were perceived as not rancid, 0.58 to 1.51 mg/kg as slightly rancid, but acceptable, and values above 1.51 mg/kg were perceived as rancid. The present results revealed that M samples remained below 0.58 mg/kg for all the 165 days of storage, thus underlying the very good quality of the frozen fillets. On the other hand, TBARS values detected in C samples, especially by 135 day, indicate a slightly rancidity, even if the group C remained into an acceptable limit until the end of the trial. Choubert et al. (Reference Choubert, Brisbarre and Baccaunaud2011) and Özyurt et al. (Reference Özyurt, Özkütük, Şimşek, Yeşilsu and Ergüven2015) reported that TBARS concentration changed significantly during storage at –18°C of rainbow trout fillets for 6 or 3 months, respectively, but showing values always under the acceptability limit. It is important to mention that TBARS values per se might not give actual grades of lipid oxidation, since MDA could also interacts with other biomolecules (Aubourg, Reference Aubourg1993). The specific reduction of propanal, pentanal, hexanal, 2-ethyl-furane, 1-penten-3-ol, 2,3-pentanedione and 1-octen-3-ol due to essential oil diet is especially noteworthy because they are well-known indicators to lipid oxidation of fish lipids and rancidity (Iglesias and Medina, Reference Iglesias and Medina2008). Baron et al. (Reference Baron, Kjaersgard, Jessen and Jacobsen2007) have pointed out these volatiles as development of oxidation marker during frozen storage of rainbow trout (O. mykiss). Furthermore, it is important to note that the initiation stage of oxidation for lipids is longer than for proteins. In previous studies, proteins from chilled fish muscle were found as the first target of oxidation since protein carbonylation were detected before the onset of lipid oxidation (Pazos et al., Reference Pazos, Maestre, Gallardo and Medina2013). In conclusion, specific muscle proteins have been targeted of the postmortem protection exerted by the inclusion of essential oil in the basal feed of rainbow trout (O. mykiss). This oriented effect resulted in a better preservation of the organoleptic quality of the final frozen fish fillets. A particular inhibition of protein oxidation, especially notable in the myofibrillar fraction, and a protection of the loss of protein solubility were found together to a prevention of flesh changes in adhesiveness and loss of WHC. Interestingly, the inhibition exerted by essential oil mixture was specifically evident for PYGM form, CKM, PGM2 and ALDOA, in the sarcoplasmic fraction, and for α-actinins-1 and -3, MHC, myomesin-1, PKM, tropomyosin, troponin-T and actin, in the myofibrillar fraction. Results also remarked an important effect of essential oils on the overall stability of actin, revealing a specific role of this post-translational modification on the loss of flesh WHC. Moreover, essential oils seemed to retard the propagation phase of lipid oxidation and to inhibit the level of oxidation products, such as TBARS and volatiles as well. This investigation highlights the importance of the right design of the antioxidant compounds to be added to animal feed considering the whole chain approach and the desired quality of the final food products. Likewise, this research supports the usefulness of essential oils as novel, safe, inexpensive and simple strategy to assure fish muscle quality during frozen storage, bring into being high-quality products having less postmortem processing.
Acknowledgements
The authors gratefully acknowledge the Erasmus Placement Project for Giulia Secci’s grant, the Foundation Carlo e Giulio Marchi for Roberta Martelli’s grant, the AWP International for the project financial supporting and the Fondazione Edmund Mach for kindly providing rainbow trout. The authors thank Lorena Barros for her excellent technical assistance.
Declaration of interest
The authors declare no conflicts of interest.
Ethics statement
The experiment was performed according to ‘The Regulations in Animal Experimentation’ of the Department of Agri-Food Production and Environmental Sciences (University of Florence, Italy) and conducted by certified personnel.
Software and data repository resources
None of the data were deposited in an official repository.
Supplementary materials
To view supplementary material for this article, please visit https://doi.org/10.1017/S1751731119000016