Emotional eating is a clinically and socially significant behavioural pattern in which emotional distress is transformed into unhealthy eating behaviours; it is defined as the tendency to eat in response to emotional states rather than physiological hunger and often leads to adverse psychological outcomes(Reference van Strien, Herman and Verheijden1). It has been increasingly associated with disordered eating symptoms, stress reactivity and deficits in self-regulation(Reference Yavorivski, Walker and de Mello2). Given that emotional eating is not a homogeneous behaviour, identifying the psychological mechanisms underlying it is crucial for recognising at-risk individuals and designing targeted interventions(Reference López-Montón, Aonso-Diego and Estévez3).
One of the key psychological determinants of emotional eating is difficulty in emotion regulation, which refers to the processes by which individuals manage and respond to emotional experiences(Reference Nolan, Halperin and Geliebter4). Individuals with impaired emotion regulation may engage in maladaptive coping strategies, such as using food to alleviate emotional distress. Studies have shown that difficulties in regulating emotions, particularly when coupled with impulsive tendencies and diminished affective control, significantly heighten the risk of emotional eating(Reference Mitchell, Baugher and Coifman5–Reference Lyvers, Kelahroodi and Udodzik7).
Cognitive flexibility, the capacity to shift cognitive strategies in response to changing demands, also plays a significant role in emotional eating. Individuals with reduced cognitive flexibility tend to rely on habitual and rigid behaviours, including dysfunctional eating patterns when under stress or facing uncertainty(Reference Gabrys, Tabri and Anisman8). Such cognitive inflexibility undermines the ability to adopt adaptive emotional responses, thereby increasing the possibility of using food as a means of self-regulation during emotional distress.
Similarly, cognitive control, which refers to the capacity to regulate attention, inhibit impulses and maintain goal-directed behaviour, plays a complex role in emotional eating. While generally adaptive, overly rigid or excessively effortful control strategies may reduce psychological flexibility and increase reliance on suppression-based regulation, especially under emotional stress, thereby paradoxically supporting restrictive or obsessive eating patterns. In such cases, heightened self-monitoring and suppression of emotional responses may tax and eventually deplete regulatory resources, thereby intensifying compensatory or dysregulated eating behaviours(Reference Gabrys, Tabri and Anisman8,Reference Godet, Fortier and Bannier9) .
Another key factor influencing emotional eating is perceived stress, which refers to the subjective experience of stress, regardless of the objective severity of life events. High perceived stress has been found to predict increased emotional eating, particularly when individuals perceive their coping resources as insufficient(Reference El-Zayat, Sultan and Alharthi10,Reference Adam and Epel11) . Moreover, perceived stress interacts with both emotion regulation capacity and cognitive flexibility, potentially exacerbating emotional vulnerability and increasing reliance on food for comfort. Thus, perceived stress serves as both a direct and indirect driver of emotional eating tendencies(Reference Carpio-Arias, Solís Manzano and Sandoval12).
Despite a growing literature, most existing assessment tools fail to capture the full spectrum of emotional eating. They tend to focus on overeating in response to negative affect, neglecting the influence of positive emotions, or under-eating responses(Reference Barnhart, Kalantzis and Gaggiano13). The Comprehensive Emotional Eating Scale (CEES) was developed to address these limitations. Unlike traditional tools, it measures both over- and under-eating in response to positive and negative emotions. This multidimensional structure allows a more precise understanding of emotional eating patterns(Reference Hooper, Dixit and Ahlich14). However, no validated Turkish version of the CEES currently exists. This presents a critical gap, as culturally specific emotion expression, eating behaviour norms and regulatory tendencies may influence emotional eating patterns differently across populations.
Against this background, the present study had two main aims. First, it aimed to adapt the CEES into Turkish and to examine its psychometric properties, including its factor structure, reliability and convergent validity, in an adult sample covering a wide age range. Second, it aimed to investigate the extent to which difficulties in emotion regulation, cognitive control, cognitive flexibility and perceived stress, as well as key socio-demographic and health-related variables (e.g. gender, BMI, region, chronic illness, smoking and income), predict different dimensions of emotional eating. By integrating scale validation with an examination of psychological and contextual correlates, this study seeks to provide a comprehensive framework for assessing and understanding emotional eating in Turkish adults.
Method
Research design
This study is a methodological and cross-sectional research aimed at scale adaptation and psychometric evaluation.
Participant characteristics
Individuals aged 18–74 years with the ability to communicate verbally or in writing were considered eligible for participation. Conversely, individuals under 18 or over 74 years of age, those unable to communicate verbally or in writing, those with any psychiatric diagnosis and those who declined to participate were excluded from the study.
The study included 1521 participants, with 68 % female (n 1035) and 32 % male (n 486). The majority were married (55·6 %), followed by single (31·4 %), widowed (8·6 %) and divorced (4·4 %). Education levels varied, with 41·1 % holding a university degree, while 20·3 % had only primary education. Geographically, 49 % resided in the Mediterranean region, followed by Central Anatolia (20·8 %) and the Aegean (16·3 %). Economically, 35·8 % earned below the minimum wage, and 22 % earned 50 000 or above. Regarding lifestyle, 52·5 % never smoked, while 32 % were current smokers. Alcohol consumption was low, with 69 % abstaining and only 5·9 % drinking frequently. Drug use was rare (5·7 %), and 24·2 % reported having a chronic disease.
Linguistic validity
This study was conducted in accordance with the cross-cultural adaptation guidelines proposed by Beaton et al. (Reference Beaton, Bombardier and Guillemin15). During the process of adapting the scale into Turkish, steps including translation, linguistic appropriateness review, back-translation and approval from the original scale developer were followed. Initially, the CEES items were translated into Turkish by a qualified health sciences linguist. Subsequently, the translated text was thoroughly evaluated by another linguist proficient in Turkish for linguistic consistency, semantic integrity and cultural relevance, with necessary revisions made. Following this, an independent linguist performed a back-translation, converting the text back into English and comparing it with the original version. The back-translation results were submitted to the original scale author, and upon their approval, the final Turkish version of the scale was finalised.
Following the forward and backward translation procedures, the pre-final Turkish version of the scale was reviewed by an expert committee consisting of specialists in public health and nutrition. The committee evaluated the items in terms of semantic, conceptual and cultural equivalence, as well as clarity and comprehensibility. Based on their feedback, minor wording revisions were made to improve clarity and cultural appropriateness before finalising the Turkish version. For example, minor adjustments were made to some emotion descriptors to ensure that their Turkish equivalents reflected the same emotional intensity and everyday usage, and slight rephrasing was applied to a few items to improve sentence fluency and comprehensibility without altering their original meaning. No items were removed at this stage, as all items were considered conceptually consistent with the original version. The linguistic validity of the CEES is shown in Figure 1.
Steps of the linguistic validation of the Comprehensive Emotional Eating Scale.

Figure 1. Long description
The image illustrates a six-step process for the linguistic validation of the Comprehensive Emotional Eating Scale. The steps are as follows: 1, Original English items translated into Turkish by a linguist specialized in health sciences; 2, Linguistic, semantic, and cultural review by a linguist proficient in Turkish; 3, Back-translation by an independent linguist from Turkish to English; 4, Review and approval by the original scale developer; 5, Pre-test with the target population and collection of expert feedback; 6, Final revisions and preparation of the finalized version. Each step is represented by a numbered circle connected by a dotted line, with descriptions below each circle.
Sampling adequacy and data collection procedures
The data collection process was conducted between 28 June and 28 July 2025. Participants were able to take part in the survey only after providing electronic consent. During the consent procedure, participants were informed that completing the survey would take approximately 15–20 min, no personal information would be collected and their responses would be used solely for scientific purposes. The survey and scale questions were prepared using the Google Forms platform, and the generated links were distributed to participants across Türkiye via email and mobile phone to facilitate data collection. Initially, the survey link was sent to volunteer university students, who were then asked to share the link with acquaintances aged 18–74 years. Similarly, respondents were encouraged to disseminate the link within their social networks to eligible individuals, thereby expanding the sample through a snowball sampling method. According to Comrey and Lee (1992), sample sizes are classified as ‘adequate’ for 300 participants, ‘good’ for 500 participants and ‘excellent’ for 1000 or more participants(Reference Comrey and Lee16). In this study, data collection was concluded upon reaching 1522 participants, which exceeds the ‘adequate’ threshold. The literature emphasises that an increase in the number of factors necessitates a larger sample size(Reference DeVellis17), and Tinsley and Tinsley (1987) recommend 5–10 participants per item(Reference Tinsley and Tinsley18). Accordingly, considering the number of items in this study, the participant-to-item ratio was calculated as 38·05.
Since the survey was administered anonymously via Google Forms, technical restrictions such as Internet Protocol or device-based response limits were not applied. However, the dataset was carefully screened for potential duplicate or suspicious entries (e.g. identical sociodemographic profiles and unrealistically short completion times), and one case was identified and removed before the final analyses.
Measures
Participants were presented with sociodemographic questions as well as the CEES, Emotional Appetite Questionnaire (EMAQ), Difficulties in Emotion Regulation Scale-Brief Form (DERS-16), Cognitive Control and Flexibility Questionnaire (CCFQ) and Perceived Stress Scale (PSS).
Comprehensive emotional eating scale
The CEES, developed by Hooper et al. (2025), assesses the influence of both positive and negative emotions on overeating and undereating. It comprises four factors: Undereating – Positive Emotions, Undereating – Negative Emotions, Overeating – Positive Emotions and Overeating – Negative Emotions. The scale includes forty items covering responses to ten positive (e.g. confident, cheerful and determined) and ten negative (e.g. anxious, distressed and tense) emotional states, capturing tendencies toward both overeating and undereating. Participants indicate whether their eating increases or decreases in response to specific emotions, using statements such as ‘I eat more when I feel anxious’ or ‘I eat less when I feel sad,’ rated on a six-point Likert scale (0 = strongly disagree to 5 = strongly agree). Cronbach’s α coefficients ranged from 0·93 to 0·94, demonstrating high reliability(Reference Hooper, Dixit and Ahlich14). During the translation process, no items were removed or conceptually modified; only minor wording revisions were made to improve clarity and cultural appropriateness. These revisions were purely linguistic (e.g. improving the naturalness and clarity of certain expressions) and did not affect the conceptual content of any item.
Emotional appetite questionnaire
The EMAQ, developed by Nolan et al. to assess emotional eating behaviour(Reference Nolan, Halperin and Geliebter4), was culturally adapted and validated in Turkish by Demirel et al. (2014). It includes twenty-two items rated on a nine-point Likert scale, with endpoints indicating ‘much less’ and ‘much more,’ and the midpoint representing ‘the same.’ Fourteen items assess emotional responses, and eight items assess situational responses, which are combined to calculate EMAQ negative and positive total scores. The scale demonstrated good internal consistency (α = 0·730)(Reference Demirel, Yavuz and Karadere19).
Difficulties in emotion regulation scale-brief form
The DERS-16, developed by Bjureberg et al., assesses multidimensional difficulties in emotion regulation(Reference Bjureberg, Ljótsson and Tull20) and was adapted into Turkish by Yigit and Guzey Yigit (2019). It comprises five subscales: emotional awareness, goal-directed behaviour, impulse control, use of coping strategies and non-acceptance of emotions. Items are rated from 1 (almost never) to 5 (almost always), with higher scores indicating greater difficulties. The scale demonstrated high reliability (α = 0·92) and validity in the Turkish sample(Reference Yigit and Guzey Yigit21).
Cognitive control and flexibility questionnaire
The Cognitive Control and Flexibility Questionnaire (CCFQ), developed by Gabrys et al. (Reference Gabrys, Tabri and Anisman8) and adapted into Turkish by Demirtaş (2019), assesses the ability to regulate unwanted thoughts and emotions and to adapt flexibly to stressful situations. It includes eighteen items rated from one (strongly disagree) to seven (strongly agree) and comprises two factors: assessment and coping flexibility and cognitive control over emotions. While subscale scores can be calculated, the total score reflects overall capacity for cognitive control and flexible coping. Higher scores indicate greater proficiency in managing unwanted thoughts and emotions, whereas lower scores suggest limited control and flexibility. The scale demonstrated high internal consistency (α = 0·91)(Reference Demirtas22).
Perceived stress scale
The PSS, developed by Cohen et al. (Reference Cohen, Kamarck and Mermelstein23) and validated in Turkish by Eskin et al., measures perceived stress. It includes fourteen items rated on a five-point Likert scale from ‘Never (0)’ to ‘Very Often (4),’ with higher total scores indicating greater stress. The scale demonstrated good reliability (α = 0·84)(Reference Eskin, Harlak and Demirkıran24).
Statistical analysis
Data analyses were conducted using IBM SPSS Statistics 26.0 and AMOS 24.0 software. To examine the construct validity of the CEES, a confirmatory factor analysis (CFA) was performed. For descriptive data, frequency and percentage were reported for categorical variables, while mean and standard deviation were provided for continuous variables. Model fit was evaluated using the chi-square/degrees of freedom ratio (CMIN/df), comparative fit index, Tucker-Lewis Index (TLI), root mean square error of approximation (RMSEA) and standardised root mean square residual. A comparative fit index value of 0·90 or higher indicates acceptable fit, while values of 0·95 or above indicate good fit. For standardised root mean square residual, values of 0·08 or below, and for RMSEA, values of 0·06 or below indicate good fit; an RMSEA of 0·05 or lower reflects excellent fit(Reference Beran and Violato25,Reference Hu and Bentler26) . The internal consistency of the scale was assessed using factor loadings, corrected item-total correlations and Cronbach’s α coefficients. According to established guidelines in the literature, internal consistency values can be interpreted as follows: values below 0·60 are considered unacceptable; 0·60–0·65 indicate a level below the desired threshold; 0·65–0·70 are minimally acceptable; 0·70–0·80 are regarded as respectable; and values between 0·80 and 0·90 reflect excellent reliability(Reference DeVellis17). The convergent validity of the scale was examined by calculating Pearson correlation coefficients between the subscales of the CEES and those of the EMAQ. To investigate the effects of sociodemographic variables on the CEES total and subscale scores, univariate analyses were first conducted using independent samples t tests and one-way ANOVA, where appropriate. Variables with a significance level of P < 0·05 in univariate analyses were included in the multiple linear regression analyses. To assess the risk of multicollinearity in the regression models, variance inflation factor values were examined, and only subscale scores were included in the models. The level of statistical significance was set at P < 0·05 for all analyses.
Results
Confirmatory factor analysis and reliability
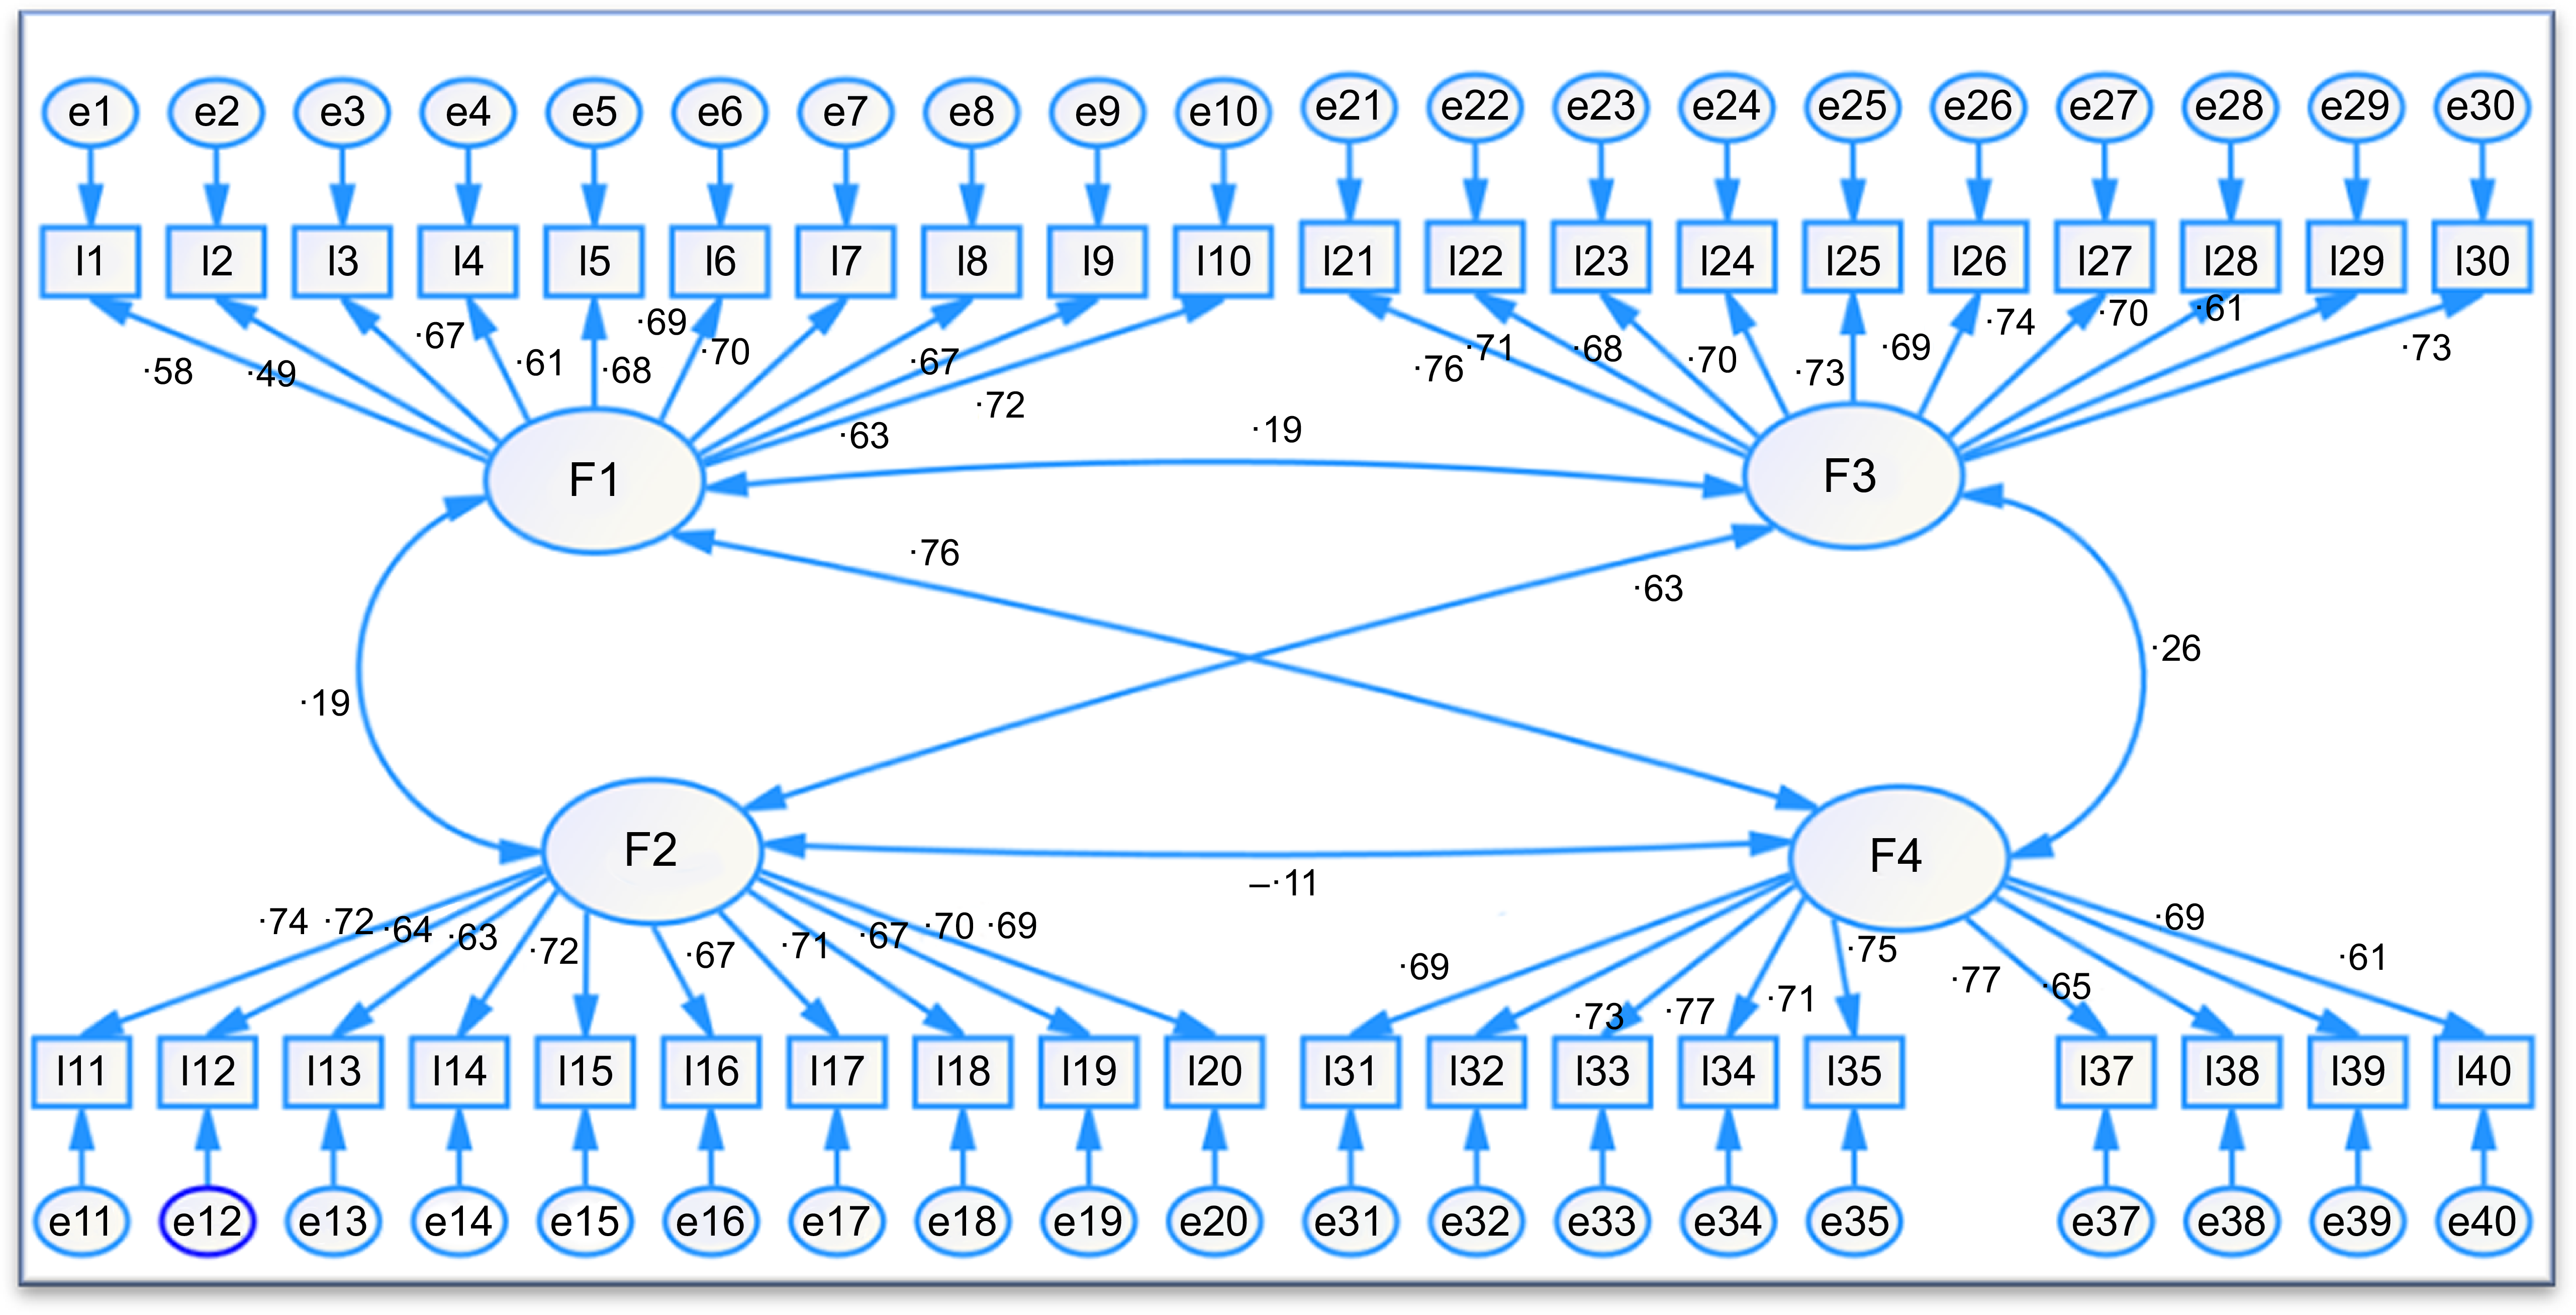
The CEES has a robust structure consisting of four factors: Undereating – Positive Emotions, Undereating – Negative Emotions, Overeating – Positive Emotions and Overeating – Negative Emotions. In the CFA, all item loadings ranged between 0·48 and 0·77, indicating strong item-factor relationships. However, the item ‘scared’ in Factor 4 was removed from the scale due to its low factor loading (0·031). Additionally, reliability analysis showed that removing this item increased the Cronbach’s α coefficient of Factor 4 from 0·867 to 0·900, further supporting its exclusion. Importantly, the reverse item ‘I eat less when I feel scared’ loaded satisfactorily on the Undereating – Negative Emotions factor (loading = 0·672), indicating that the poor performance of the original item was not due to a translation issue but rather to its conceptual irrelevance to the Overeating – Negative Emotions factor in this sample. The subscales (factors 1, 2, 3 and 4) demonstrated high internal consistency, with Cronbach’s α coefficients of 0·88, 0·90, 0·91 and 0·90, respectively. The item-total correlations ranged from 0·46 to 0·73, supporting the coherence of each factor with its respective items. Additionally, removing any single item did not negatively affect the reliability of the subscales (Table 1).
Standardised factor loadings and reliability statistics for the final scale

Table 1. Long description
The table presents standardized factor loadings and reliability statistics for a final scale, focusing on emotional undereating and overeating of positive and negative emotions. It includes four factors: Emotional Undereating Positive Emotions, Emotional Undereating Negative Emotions, Emotional Overeating Positive Emotions, and Emotional Overeating Negative Emotions. The table has 40 rows and 7 columns, with headers including Factor, Item, Lambda, Mean, Standard Deviation, Alpha, Corrected Item-Total Correlation, and Cronbachʼs Alpha if Item Deleted. Each row lists specific items and their corresponding statistical values, highlighting the relationships between items and factors, as well as the reliability of the scale.
In the CFA conducted after removing one item (‘scared’ – item 36), the model’s χ 2/degrees of freedom ratio (CMIN/df) was 3·5, and considering comparative fit index = 0·90, TLI = 0·89, RMSEA = 0·08 and standardised root mean square residual = 0·07, the model demonstrated borderline acceptable fit, as shown in Figure 2.
Confirmatory factor analysis of the Comprehensive Emotional Eating Scale.

Figure 2. Long description
The line graph presents the relationships between four factors (F1, F2, F3, and F4) and various items (I1 to I40) and emotions (e1 to e40) related to emotional eating. Each factor is connected to multiple items and emotions with specific correlation values indicated by arrows. Factor F1 connects to items I1 to I10 and emotions e1 to e10 with values ranging from -58 to -70. Factor F2 connects to items I11 to I20 and emotions e11 to e20 with values ranging from -74 to -69. Factor F3 connects to items I21 to I35 and emotions e21 to e35 with values ranging from -76 to -61. Factor F4 connects to items I36 to I40 and emotions e36 to e40 with values ranging from -75 to -61. The graph also shows interconnections between the factors themselves, with values ranging from -26 to -11. All values are approximated.
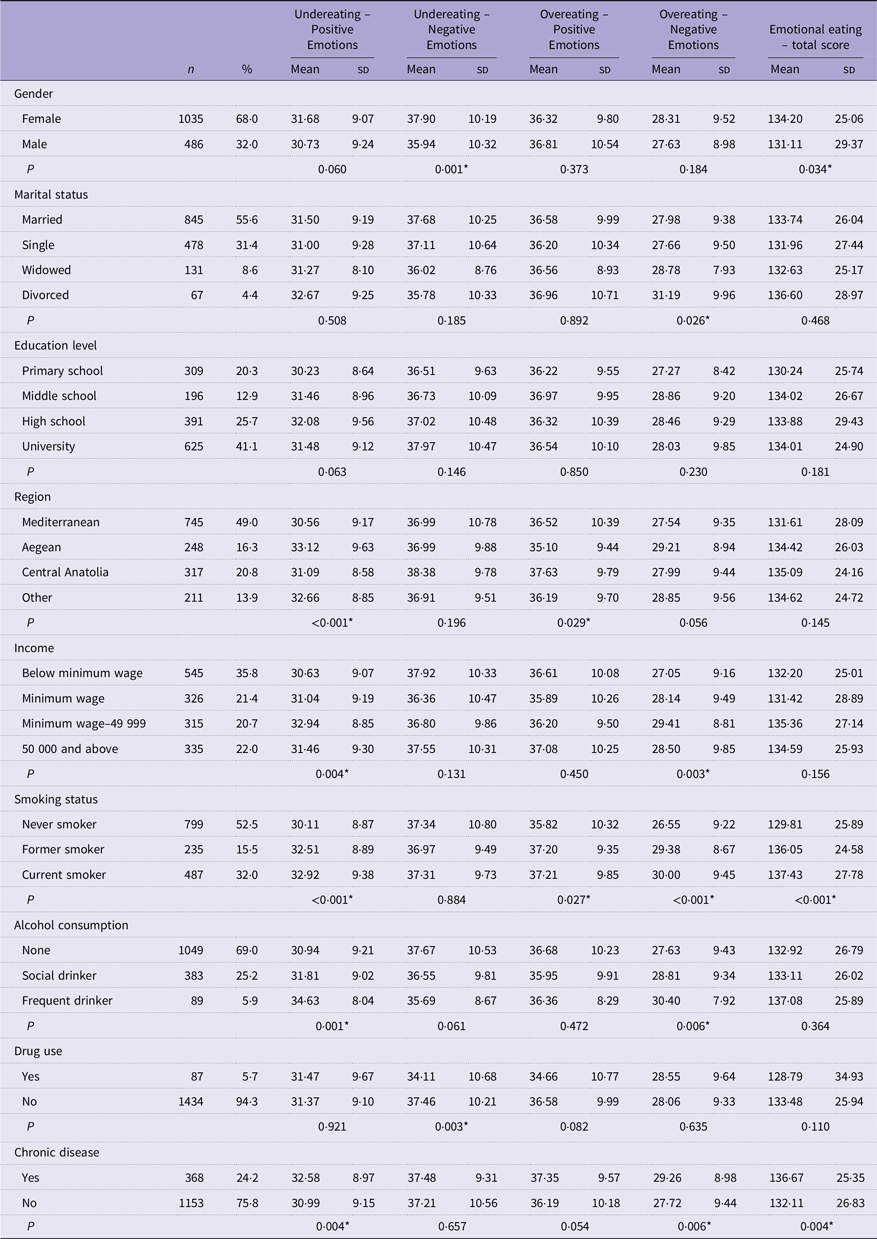
The study revealed significant variations in emotional eating behaviours across demographic and socio-economic groups, with women scoring higher than men in undereating associated with negative emotions (P = 0·001) and total emotional eating scores (P = 0·034). Divorced individuals exhibited greater overeating linked to negative emotions (P = 0·026), while regional differences showed the Aegean region with the highest Undereating – Positive Emotions scores (P < 0·001) and Central Anatolia with elevated Overeating – Positive Emotions (P = 0·029). Higher income correlated with increased Undereating – Positive Emotions (P = 0·004) and Overeating – Negative Emotions (P = 0·003). Current smokers and frequent alcohol consumers demonstrated higher emotional eating across multiple subscales (all P < 0·05), as did individuals with chronic diseases (P = 0·004 for total score). Participants with chronic diseases showed heightened emotional eating tendencies, particularly for undereating with positive emotions (P = 0·004), overeating with negative emotions (P = 0·006) and total scores (P = 0·004) (Table 2).
Factors affecting the comprehensive emotional eating scale total score and subscales

Table 2. Long description
The table presents data on 1521 participants, detailing gender distribution with 68% female and 32% male. Marital status shows 55.6% married, 31.4% single, 8.6% widowed, and 4.4% divorced. Education levels include 41.1% with a university degree and 20.3% with primary education only. Geographical distribution shows 49% from the Mediterranean region, 20.8% from Central Anatolia, and 16.3% from the Aegean. Income levels indicate 35.8% earn below the minimum wage and 22% earn 50000 or above. Lifestyle factors reveal 52.5% never smoked, 32% are current smokers, 69% abstain from alcohol, and 5.9% drink frequently. Drug use is reported by 5.7%, and 24.2% have a chronic disease. The table includes mean and standard deviation values for under-eating, over-eating, and emotional eating total scores across these demographics.
* Numerical values indicate statistically significant values.
Convergent validity assessment
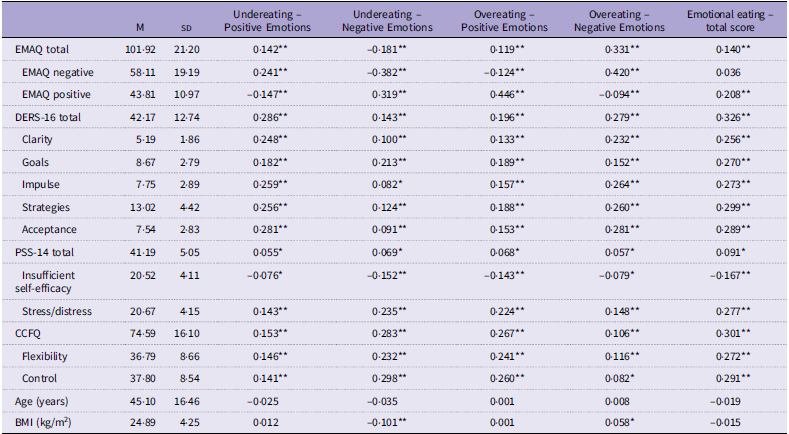
The study evaluated convergent validity by demonstrating the relationships between the subscales of the CEES and the total score and subscales of EMAQ. The finding of a moderate positive correlation (r 0·420) between CEES’s ‘overeating-negative emotions’ subscale and EMAQ’s negative subscale, as well as a strong positive correlation (r 0·446) between CEES’s ‘Overeating − Positive Emotions’ subscale and EMAQ’s positive subscale, indicates that these scales, which theoretically measure similar constructs, yield consistent results and that the relevant subscales of CEES have convergent validity with EMAQ. Similarly, the presence of a moderate positive relationship (r 0·319) between CEES’s ‘undereating-negative emotions’ subscale and EMAQ’s positive subscale also supports a significant overlap between constructs measuring similar emotional responses. On the other hand, although the correlations between the CEES total score and the EMAQ total score (r 0·140), EMAQ negative subscale (r 0·036) and EMAQ positive subscale (r 0·208) were relatively weak, their positive direction suggests that they measure the same conceptual construct, albeit to a limited extent. The observation of higher correlations particularly in the context of negative and positive emotional eating indicates that CEES’s subscales show greater overlap with the detailed constructs of EMAQ and that convergent validity is supported primarily at the subscale level. These results demonstrate that CEES reliably measures the construct of emotional eating and establishes consistent relationships with EMAQ subscales, which are theoretically similar in structure.
The study also explored correlational patterns between CEES and key measurement variables that may influence emotional eating tendencies. The analysis of relationships between the CEES and other psychological measures revealed that difficulties in emotion regulation (DERS-16) demonstrated the most prominent associations. The CEES total score showed strong positive correlations ranging between 0·256 and 0·326 with all subscales of Difficulties in Emotion Regulation Scale (DERS-16) (emotional clarity, goal-directed behaviour, impulse control, strategic regulation and acceptance). In stress assessment, the stress/distress subscale of PSS-14 exhibited a positive correlation of 0·277 with the CEES total score, while self-efficacy scores showed a negative correlation of –0·167. Significant positive relationships were also found between CEES and CCFQ, with correlations of 0·272 for flexibility and 0·291 for control. Regarding demographic factors, BMI demonstrated statistically significant yet weak relationships with emotional eating: a slight negative association with Undereating – Negative Emotions (r −0·101) and a minimal positive association with Overeating – Negative Emotions (r 0·058). No significant relationships were observed between age and any CEES subscales or total score (Table 3).
Correlation of the comprehensive emotional eating scale total score and subscales with other measurement variables

Table 3. Long description
The table presents correlation coefficients between the comprehensive emotional eating scale (CEES) total score and subscales with other measurement variables. It includes data on under-eating and over-eating associated with positive and negative emotions. The table has 15 rows and 11 columns, with headers such as EMAQ total, EMAQ negative, EMAQ positive, DERS-16 total, and more. Each row lists correlation values for different subscales and variables, indicating the strength and direction of relationships. Notable trends include strong positive correlations between CEES total score and DERS-16 subscales, and a negative correlation with self-efficacy scores. BMI shows weak relationships with emotional eating subscales.
EMAQ, Emotional Appetite Questionnaire; DERS-16, Difficulties in Emotion Regulation Scale-Brief Form; PSS-14, Perceived Stress Scale-14; CCFQ, Cognitive Control and Flexibility Questionnaire.
*< 0·05, **< 0·001.
Predictors of Comprehensive Emotional Eating Scale total score and subscales
Multiple linear regression analysis was conducted to examine the multivariate effects of variables influencing the CEES total score and subscales, whose validity and reliability in Turkish had been previously established. Variables that were statistically significant in the univariate analyses (P < 0·05) were entered into the multiple regression models. For Undereating – Positive Emotions, these variables included region, income, smoking status, alcohol consumption, presence of chronic disease, EMAQ negative and positive scores, all DERS-16 subscales (clarity, goals, impulse, strategies and acceptance), both PSS-14 subscales (insufficient self-efficacy and stress/distress), and CCFQ flexibility and control. The model for Undereating – negative emotions comprised gender, drug use, EMAQ negative and positive scores, all DERS-16 subscales, both PSS-14 subscales, CCFQ flexibility and control and BMI. For Overeating – Positive Emotions, region, smoking status, EMAQ negative and positive scores, all DERS-16 subscales, both PSS-14 subscales, and CCFQ flexibility and control were included. The overeating-negative emotions model incorporated marital status, income, smoking status, alcohol consumption, chronic disease, EMAQ negative and positive scores, all DERS-16 subscales, both PSS-14 subscales, CCFQ flexibility and control and BMI. Finally, the regression model for the emotional eating total score included gender, smoking status, chronic disease, EMAQ negative and positive scores, all DERS-16 subscales, both PSS-14 subscales and CCFQ flexibility and control.
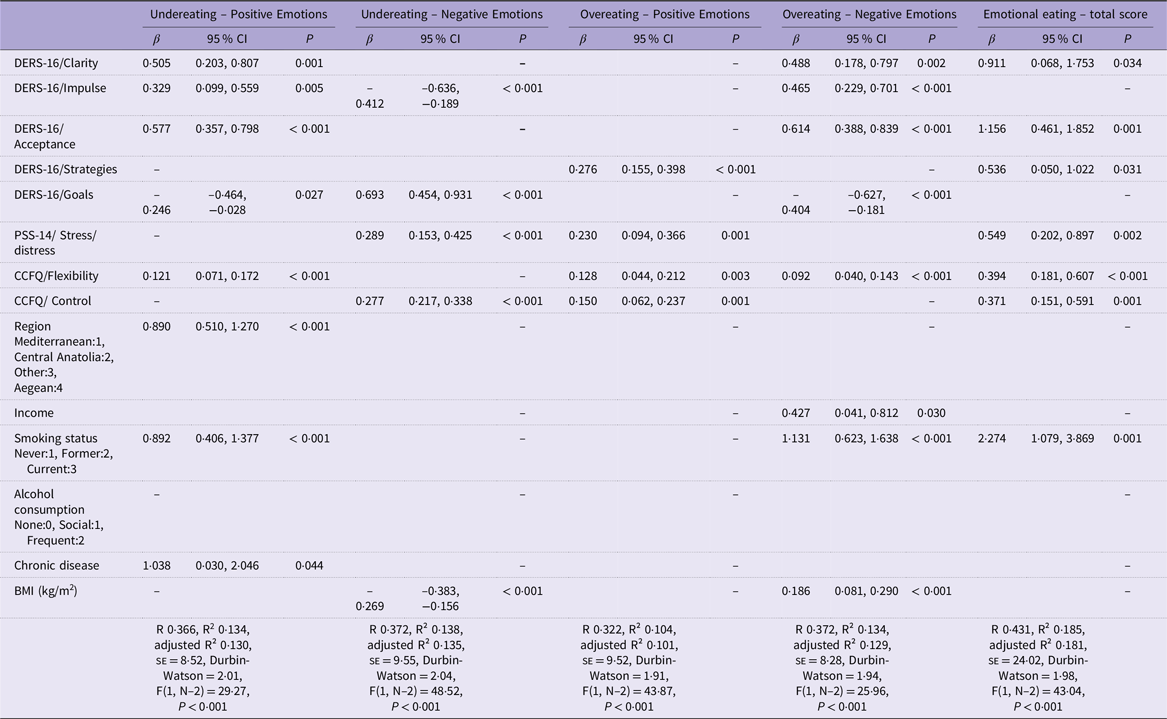
The results of the multiple regression analyses are summarised in Table 4. Significant predictors of Undereating – Positive Emotions included difficulties in emotional clarity, impulse control, acceptance and goal-directed behaviour, as well as cognitive flexibility, region, smoking status and presence of a chronic disease (P < 0·05). For Undereating – Negative Emotions, impulse control difficulties, difficulties in goal-directed behaviour, use of emotion regulation strategies, perceived stress/distress, cognitive control and BMI were significant predictors. In the Overeating – Positive Emotions model, perceived stress/distress, cognitive flexibility and control and income level were significantly associated with the outcome. For Overeating – Negative Emotions, difficulties in emotional clarity, impulse control, acceptance, strategies and goal-directed behaviour, along with perceived stress/distress, cognitive flexibility, smoking status and BMI, emerged as significant predictors. Finally, the Emotional Eating Total Score was significantly predicted by difficulties in emotional clarity and acceptance, perceived stress/distress, cognitive flexibility and control and smoking status. All regression models were statistically significant and explained between 10 % and 19 % of the variance in emotional eating outcomes (see Table 4). To assess multicollinearity, variance inflation factor values were examined, and only subscale scores (rather than total scale scores) were included in the regression analyses to ensure statistical robustness. Variance inflation factor values are presented in the Supplementary Material (online Supplementary Table 1). According to the regression results: Emotional eating – total score was increased by the clarity, acceptance and strategies subscales of DERS-16, the stress/distress subscale of PSS-14, the flexibility and control subscales of CCFQ and smoking status. Undereating – Positive Emotions subscale was increased by the clarity, impulse and acceptance subscales of DERS-16, the flexibility subscale of CCFQ, smoking, presence of a chronic disease and living in the Aegean region. The goals subscale was negatively associated with this subscale. Undereating-negative emotions subscale was increased by the goals subscale of DERS-16, the stress/distress subscale of PSS-14 and the control subscale of CCFQ, whereas the impulse subscale of DERS-16 and BMI were negatively correlated with this subscale. Overeating– Positive Emotions subscale was increased by the strategies subscale of DERS-16, the stress/distress subscale of PSS-14 and the flexibility and control subscales of CCFQ. Overeating-negative emotions subscale was increased by the clarity, impulse and acceptance subscales of DERS-16, the flexibility subscale of CCFQ, monthly income level, smoking and BMI, while the goals subscale had a negative effect on this subscale (Table 4).
Multiple linear regression analysis of factors influencing the comprehensive emotional eating scale total score and subscales

Table 4. Long description
The table presents a multiple linear regression analysis of factors influencing various emotional eating scales. It includes columns for different subscales such as Undereating Positive Emotions, Undereating Negative Emotions, Overeating Positive Emotions, Overeating Negative Emotions, and Emotional Eating Total Score. Each subscale is analyzed with beta coefficients, 95% confidence intervals, and p-values for various predictors like DERS-16, PSS-14, CCFQ, region, income, smoking status, alcohol consumption, chronic disease, and BMI. The table highlights significant predictors for each subscale, indicating how different factors influence emotional eating behaviors. For instance, difficulties in emotional clarity, impulse control, and acceptance are significant predictors across multiple subscales. The analysis also includes statistical measures like R-squared and Durbin-Watson values to assess the model fit and multicollinearity.
DERS-16, Difficulties in Emotion Regulation Scale-Brief Form; PSS-14, Perceived Stress Scale-14; CCFQ, Cognitive Control and Flexibility Questionnaire.
Discussion
Psychometric properties of the Comprehensive Emotional Eating Scale
The present study evaluated the psychometric properties of the Turkish version of the CEES and examined its associations with demographic, socio-economic and psychological variables. CFA supported a four-factor structure reflecting Undereating −Positive Emotions, Undereating – Negative Emotions, Overeating – Positive Emotions and Overeating – Negative Emotions. Item loadings ranged from 0·48 to 0·77, indicating strong item-factor relationships. One item (‘scared’) was removed due to a low factor loading (0·031); this is not unexpected, as in complex scales with numerous items and factors, some variations in the factorial structure can occur, particularly due to sample-specific characteristics(Reference Beaton, Bombardier and Guillemin15,Reference Borsa, Damásio and Bandeira27) . In the present study, this item was excluded during the CFA to preserve the structural validity and reliability of the scale. Beyond a purely statistical issue, this finding may reflect a culturally and physiologically grounded difference in how fear is experienced in relation to eating behaviour in the Turkish context. Fear is more commonly associated with bodily tension, stomach discomfort and appetite suppression rather than with increased food intake. Therefore, this item may not have been sufficiently meaningful or discriminative for this sample, as it does not represent the dominant behavioural response to fear. In contrast, the reverse item (‘I eat less when I feel scared’) appears to be more consistent with participants’ subjective and bodily experience and thus showed an acceptable factor loading. The adequate loading of the reverse item (loading = 0·672) further indicates that this issue is not attributable to a translation problem, but rather to a conceptual mismatch between fear and overeating in this cultural context.
Comparing the CFA results of the Turkish CEES with the original scale and the USA adaptation reveals consistency in the structural validity. The original CEES study reported excellent model fit indices (RMSEA = 0·048, comparative fit index = 0·925, TLI = 0·920)(Reference Hooper, Dixit and Ahlich14), while the USA adaptation study also demonstrated strong fit for a four-factor solution (RMSEA = 0·059, TLI = 0·91, standardised root mean square residual = 0·03)(Reference Dixit, Barnhart and Ahlich28). In the present study, model fit indices indicate an acceptable fit, slightly lower than the original and USA adaptation, which may be related to sample-specific or methodological factors rather than distinct cultural or linguistic influences(Reference Beran and Violato25,Reference Hu and Bentler26) . Although the CFA fit indices were at the lower bound of commonly accepted thresholds, these findings should be interpreted with caution. Modification indices were examined; however, no theoretically justifiable error covariances or cross-loadings were identified that could be added without compromising the conceptual integrity of the original scale. Therefore, no post hoc modifications were applied in order to preserve the theoretical structure of the instrument. The scale assesses a multidimensional construct, and modest reductions in incremental fit indices such as the TLI may be expected in models involving multiple correlated factors and Likert-type items. Furthermore, the RMSEA and CMIN/df values remained within acceptable ranges reported in applied research, suggesting that the proposed factor structure is reasonably supported despite some limitations. These findings are consistent with recommendations in scale development literature, suggesting that minor differences in fit indices are expected across different populations without compromising the structural validity of the instrument(Reference Beaton, Bombardier and Guillemin15,Reference Borsa, Damásio and Bandeira27) .
The internal consistency of the Turkish CEES was excellent, with Cronbach’s α coefficients ranging from 0·88 to 0·91 and item-total correlations between 0·46 and 0·73. These values, although slightly lower than the original scale (α = 0·93–0·94)(Reference Hooper, Dixit and Ahlich14) and the USA adaptation (α = 0·94)(Reference Dixit, Barnhart and Ahlich28), remain within an acceptable range and reflect the robustness of the scale across different samples. The reliability remained stable even when individual items were removed, supporting the coherence of items within each subscale and aligning with general psychometric principles, which indicate that internal consistency increases with the number of items and inter-item covariance(Reference DeVellis17,Reference Nunnally and Bernstein29,Reference Tavakol and Dennick30) .
Convergent validity of the Turkish CEES was confirmed through moderate to strong correlations with EMAQ subscales, particularly for Overeating – Positive Emotions and Overeating – Negative Emotions (r 0·446 and r 0·420, respectively). These results are in line with the original scale development(Reference Hooper, Dixit and Ahlich14) in which the negative over- and under-eating subscales demonstrated convergent validity with measures of body image-focused eating disorders and ARFID symptoms, while exploratory analyses addressed positive over- and under-eating behaviours. The correspondence between the Turkish adaptation and prior findings indicates that the CEES reliably captures emotional eating patterns at the subscale level across diverse contexts. Furthermore, the CEES adds unique value beyond existing Turkish emotional eating measures, such as the EMAQ, by assessing both overeating and undereating in response to positive and negative emotions, offering a more comprehensive and multidimensional evaluation of eating behaviours. Although the CEES total score showed a relatively weak correlation with the EMAQ total score (r 0·140), stronger correlations were observed at the subscale level, particularly for Overeating − Positive Emotions and Overeating − Negative Emotions (r 0·446 and r 0·420, respectively). This indicates that while both scales broadly measure emotional eating, the CEES captures more nuanced subtypes, differentiating between overeating and undereating across distinct emotional contexts. Therefore, the weak total score correlation reflects the CEES’s multidimensional assessment rather than a limitation in validity. This divergence between total scores can be explained by differences in the conceptual frameworks of the two scales. While the EMAQ primarily assesses general tendencies to eat in response to positive or negative emotions, the CEES differentiates between overeating and undereating behaviours and further separates these responses according to positive and negative emotional contexts. Therefore, although both scales measure emotional eating broadly, the CEES captures more nuanced subtypes of emotional eating, which are not reflected in the overall EMAQ score, explaining the relatively weak correlation at the total score level.
Overall, the Turkish CEES demonstrates psychometric properties consistent with both the original and previously adapted versions. Minor variations in model fit and reliability indices are within the normal range for cross-cultural adaptations and do not indicate meaningful cultural or linguistic differences. These findings suggest that the Turkish CEES is a valid and reliable instrument for assessing emotional eating in adults, suitable for both research and clinical applications.
Determinants of emotional eating
Following the examination of the psychometric properties of the Turkish CEES, multiple linear regression analyses identified several psychological, demographic and contextual factors influencing emotional eating across its subscales. Building on these results, the discussion focuses on the broader implications of these predictors, highlighting the combined role of emotion regulation, cognitive processes and lifestyle variables in shaping emotional eating behaviours.
Notably, difficulties in emotional clarity were positively associated with Undereating – Positive and Overeating – Negative, aligning with prior findings that individuals who struggle to identify their emotions may exhibit emotion-driven eating – either overeating or undereating – due to emotional confusion or reactivity(Reference Svaldi, Griepenstroh and Tuschen-Caffier31). Impulse control difficulties predicted both Undereating – Positive and Overeating – Negative, consistent with research showing that emotion dysregulation, particularly impulsivity, contributes to both restrictive and binge-type eating patterns(Reference Benzerouk, Djerada and Bertin32). Similarly, nonacceptance of emotions and limited access to strategies were linked to increased emotional eating, supporting meta-analytic evidence on the maladaptive effects of suppression and poor emotion coping(Reference Aldao, Nolen-Hoeksema and Schweizer33). Goal-setting difficulties showed a dual effect: under negative affect, they increased the likelihood of undereating, whereas during positive affect, they reduced restraint, reflecting models in which emotion regulation failure can lead to both restrictive and overeating behaviours depending on emotional context(Reference Lyvers, Kelahroodi and Udodzik7,Reference Smith, Serier and Belon34) .
Both cognitive flexibility and cognitive control were significant predictors of overall emotional eating and its subscales. While flexibility is generally protective, it may contribute to emotion-driven shifts in eating when emotion regulation is poor. Those with high flexibility but low emotional stability may oscillate between overeating and undereating depending on emotional cues, reflecting flexibility’s context-dependent role(Reference Nicholls, Vartanian and Faasse35). Similarly, strong cognitive control was linked to restrictive eating under stress. Elevated control, especially with obsessive–compulsive tendencies, can promote structured eating as a coping mechanism(Reference Gabrys, Tabri and Anisman8,Reference Johnson, Pratt and Wardle36) . However, cognitive control may sometimes lead to overregulation, which in emotional contexts can backfire and manifest as maladaptive coping, including emotional overeating(Reference Mitchell, Huckstepp and Allen37). This clarification indicates that our findings do not contradict the protective roles of flexibility and control but rather underscore their complex, context-specific interactions with emotion regulation in shaping eating behaviours. These findings highlight the interactive effects of cognitive processes and emotion regulation, showing that both flexibility and control shape eating patterns in complex, context-specific ways. Although this study emphasised the importance of culturally specific emotional expression in its rationale, interpretations of the findings primarily drew upon Western-based literature due to limited local research on emotional eating in Türkiye; future studies should expand culturally grounded frameworks to better contextualise these behaviours.
Stress-related distress emerged as one of the strongest predictors of emotional eating, reinforcing the well-established link between stress and the tendency to overeat in response to negative emotions(Reference Hill, Conner and Clancy38,Reference Tomiyama39) . Stress can undermine emotional clarity and impulse regulation, which may lead individuals to use food as a coping mechanism for managing emotions(Reference Van Strien, Herman and Anschutz40). Moreover, low perceived self-efficacy was associated with higher emotional eating, suggesting that individuals who feel less capable of handling stress effectively may be more prone to relying on eating to regulate their emotions(Reference Lavender, Wonderlich and Engel41).
The regression also highlighted health and lifestyle factors influencing emotional eating. Smoking was associated with both undereating-positive and overeating-negative behaviours, consistent with research linking behavioural disinhibition and shared neural pathways for food and substance rewards to compensatory eating(Reference Konttinen, Männistö and Sarlio-Lähteenkorva42). Higher BMI was related to increased overeating-negative and reduced undereating-negative, supporting findings that emotional and stress-related eating cycles are more common in individuals with elevated body weight(Reference van Strien, Herman and Verheijden1). Income level influenced overeating-negative, reflecting potential socio-economic effects on food access and coping strategies(Reference Faith, Butryn and Wadden43). Additionally, chronic illness and living in the Aegean region predicted undereating-positive, which may reflect culturally shaped or illness-related appetite changes, regional lifestyle patterns or context-specific attitudes towards food and emotions. These region-specific differences highlight the importance of considering local cultural and environmental factors when interpreting emotional eating patterns, though further research is needed.
Together, these findings support the understanding of emotional eating as a complex phenomenon shaped by affective dysregulation, impaired cognitive processing, perceived stress and lifestyle factors. The CEES demonstrates strong potential in distinguishing these influences across various emotional states and eating responses, underscoring its value in both research and clinical applications.
Nevertheless, it should be noted that the regression models explained between 10 % and 19 % of the variance in emotional eating outcomes, indicating that a substantial proportion of the variance remains unaccounted for. This is not unexpected given the multifactorial nature of eating behaviour. Emotional eating is influenced not only by psychological and cognitive factors but also by biological (e.g. genetic vulnerability, hormonal regulation and appetite-related neuroendocrine mechanisms), environmental (e.g. food availability, cultural norms and social context) and behavioural factors (e.g. habitual dietary patterns, sleep and physical activity), which were not assessed in the present study. Therefore, the current models should not be interpreted as exhaustive explanatory frameworks, but rather as focused models capturing the contribution of key psychological and cognitive processes. From a clinical perspective, even modest explained variance is meaningful in complex, multifactorially driven phenomena such as eating behaviour, and the CEES may be particularly useful for identifying emotionally driven eating tendencies rather than for fully predicting eating behaviour. Future studies integrating biological, behavioural and contextual variables are likely to achieve more comprehensive explanatory models.
Limitations and strengths
This study has some limitations. Its cross-sectional design prevents causal inferences between emotional eating and predictors. Although the sample was large, snowball sampling may limit representativeness, and the online recruitment strategy may have contributed to a sample that is not fully representative of the general population. Specifically, the sample included a relatively high proportion of university-educated participants (41·1 %) and a majority of female participants (68 %), which may limit the generalisability of our findings to Turkish men, particularly as gender was a significant predictor of total CEES scores. Caution is, therefore, warranted when interpreting these results for male populations, and future studies should aim for more gender-balanced samples. Interpretations should, therefore, be made with caution, particularly for subpopulations underrepresented in the sample. In addition, because the data were collected via an anonymous online survey, technical restrictions to prevent multiple submissions (e.g. Internet Protocol- or device-based limits) could not be applied; although the dataset was carefully screened and one duplicate/suspicious case was removed, this should still be considered a methodological limitation. Some CFA fit indices (particularly the TLI) were at the lower bound of recommended thresholds, indicating that the structural validity of the Turkish version, while acceptable, should be interpreted with caution and further examined in future studies. Future research could use longitudinal designs, including clinical populations and test interventions targeting emotional eating.
Nevertheless, the study has notable strengths. It used a large, geographically diverse sample (n 1521), enhancing generalisability across Türkiye. Cross-cultural adaptation procedures, including translation, back-translation, expert committee review and developer approval, strengthened the linguistic and conceptual validity of the Turkish CEES. The study assessed both overeating and undereating in response to positive and negative emotions, alongside psychological constructs such as emotion regulation, cognitive control, cognitive flexibility and perceived stress. High reliability and convergent validity with EMAQ subscales confirm the scale’s psychometric soundness. Overall, these strengths highlight the study’s contribution to understanding multidimensional emotional eating and its potential to inform targeted interventions.
Conclusion
The present study confirms that the Turkish CEES is a valid and reliable tool for assessing emotional eating in adults, capturing both overeating and undereating in response to positive and negative emotions. Multiple regression analyses showed that difficulties in emotion regulation, higher perceived stress, lower cognitive control and flexibility, smoking, higher BMI and chronic disease increased emotional eating on specific subscales and total scores. Women had higher Undereating – Negative Emotion and total scores. These findings highlight the multidimensional and context-dependent nature of emotional eating, emphasising the need to consider psychological and socio-demographic factors in research and clinical practice. Overall, the Turkish CEES provides a robust basis for interventions targeting at-risk populations in Türkiye.
Supplementary material
For supplementary material/s referred to in this article, please visit https://doi.org/10.1017/S0007114526107491
Acknowledgements
We sincerely thank the authors of the Comprehensive Emotional Eating Scale, especially the corresponding author Hana F. Zickgraf, for granting permission to adapt the scale into Turkish, and we are grateful to all participants who voluntarily completed the surveys.
This research did not receive any specific grant from funding agencies in the public, commercial or not-for-profit sectors.
All authors have read and approved the final version of the manuscript and agree to be accountable for all aspects of the work, including ensuring the accuracy and integrity of any part of the study. B. A.: Conceptualisation, Data curation, Investigation, Methodology, Validation, Project administration, Resources, Supervision, Visualisation, Writing – original draft and Writing – review and editing. F. T.: Conceptualisation, Writing – original draft, Resources. Ö. Ö.: Validation, Formal analysis.
The authors declare that they have no known competing financial interests or personal relationships that could have appeared to influence the work reported in this paper.
Ethical approval for the study was obtained from the Suleyman Demirel University, University Ethics Committee, Health Sciences Ethics Committee, with meeting number 98 and decision number 16 (Date: 27 June 2025). Additionally, permission for the use of the CEES scale, whose validity and reliability were established, was obtained from the responsible author, as well as from the individuals who conducted the Turkish adaptations of the other scales used in the study.
Before taking part, participants electronically provided consent. At the start of the online survey, they were given an information sheet and consent form, and only those who agreed could proceed to complete the questionnaire.
This manuscript has not been published elsewhere and is not concurrently under consideration for publication elsewhere.
In this study, the data collection process involved distributing survey questions that did not contain personal information such as names through a link, therefore ‘Consent for Publication’ is ‘Not applicable’.
The datasets generated and/or analysed during this study are available from the corresponding author upon reasonable request.
The authors confirm that no artificial intelligence tools were used in the research or writing of this manuscript.