I. INTRODUCTION
During the last decade, the growth of highly strained semiconductor heterostructures has been studied extensively, especially those systems that exhibit a Stranski–Krastanov (SK) growth mode. The SK growth mode, in fact, represents an appealing approach for obtaining defect-free self-assembled quantum dots (QDs). Reference Petroff1 Recently, the attractive prospects of QDs have been demonstrated in the case of sophisticated applications in new generation devices such as single-photon emitters for nanophotonics and quantum computing. Reference Petroff1–Reference Trotta, Zallo, Ortix, Atkinson, Plumhof, Van den Brink, Rastelli and Schmidt3 For these exciting applications of QDs, the major challenge to be solved is a proper control over the single-QD arrangements. Reference Petroff1 The stochastic nature of the microscopic surface processes, and more importantly of the diffusion, leads to random nucleation and size/composition fluctuations of the QDs. Until now, advances in the ordering of QDs have been obtained by combining bottom-up and top-down methods, such as introducing ex situ processing-steps (e.g., nanopatterning, etching, lithography) before and/or after the epitaxial growth, Reference Kiravittaya, Rastelli and Schmidt4–Reference Patella, Arciprete, Placidi, Fanfoni, Balzarotti, Vinattieri, Cavigli, Abbarchi, Gurioli and Lunghi6 or by multilayer stacking. Reference Tersoff, Teichert and Lagally7–Reference Heidemeyer, Denker, Muller and Schmidt9 However, the emission properties of such arrays are still far from the high optical quality of randomly grown QDs Reference Schneider, Huggenberger, Sünner, Heindel, Strauß, Göpfert, Weinmann, Reitzenstein, Worschech, Kamp, Höfling and Forchel10 Thus, a patterning-free method, relying solely on tailoring of the growth to control the lateral position and composition of QDs would be a relevant technological achievement. The capability to achieve this result in the InAs/GaAs heterostructure relies on the possibility of minimizing the randomness of In diffusion, which is the main responsible of the fluctuations in the QD size and mutual distance. In this paper, we report on a new effect, related to the As incorporation kinetics, which represents an important progress in this direction. It is known that steps and step bunching constitute preferential sites for dot nucleation. Reference Leon, Senden, Kim, Jagadish and Clark11–Reference Placidi, Arciprete, Fanfoni, Patella, Orsini and Balzarotti14 By using this concept and a pulsed deposition (PD) in molecular beam epitaxy (MBE), we show that, at high growth temperature and at high V/III flux ratio, it is possible to determine which slopes, among all the otherwise similar step bunching slopes, will accommodate the growing QDs. The key parameter is the As flux direction and we find indeed that, after a mounding and a proper step bunching on the GaAs buffer layer are engineered, the dots grow “only” on the step bunching of the mounds which is oriented toward the incoming As flux. These results challenge the commonly held belief that the As role can be neglected in the description of As-based epitaxy. We have thus developed an appropriate two-species kinetic model that explains the experiments showing that the oblique arsenic evaporation, giving rise to a small As flux unbalance between the two mound sides, causes a drift current of In adatoms that determines the growth of the QDs on only one of the two mound sides.
II. EXPERIMENTAL METHODS
The samples were prepared by MBE (RIBER 32P reactor, France) on singular GaAs(001) substrates with a miscut angle of about 0.01°, corresponding to average step distances of about 2000 nm. A GaAs buffer layer with an approximate thickness of 500 nm was grown at 590 °C with a choice of the As4/Ga flux ratio and of the growth rate suitable for inducing the formation of surface instabilities Reference Johnson, Orme, Hunt, Graff, Sudijono, Sander and Orr15,Reference Patella, Arciprete, Placidi, Nufris, Fanfoni, Sgarlata, Schiumarini and Balzarotti16 (see Fig. 1).
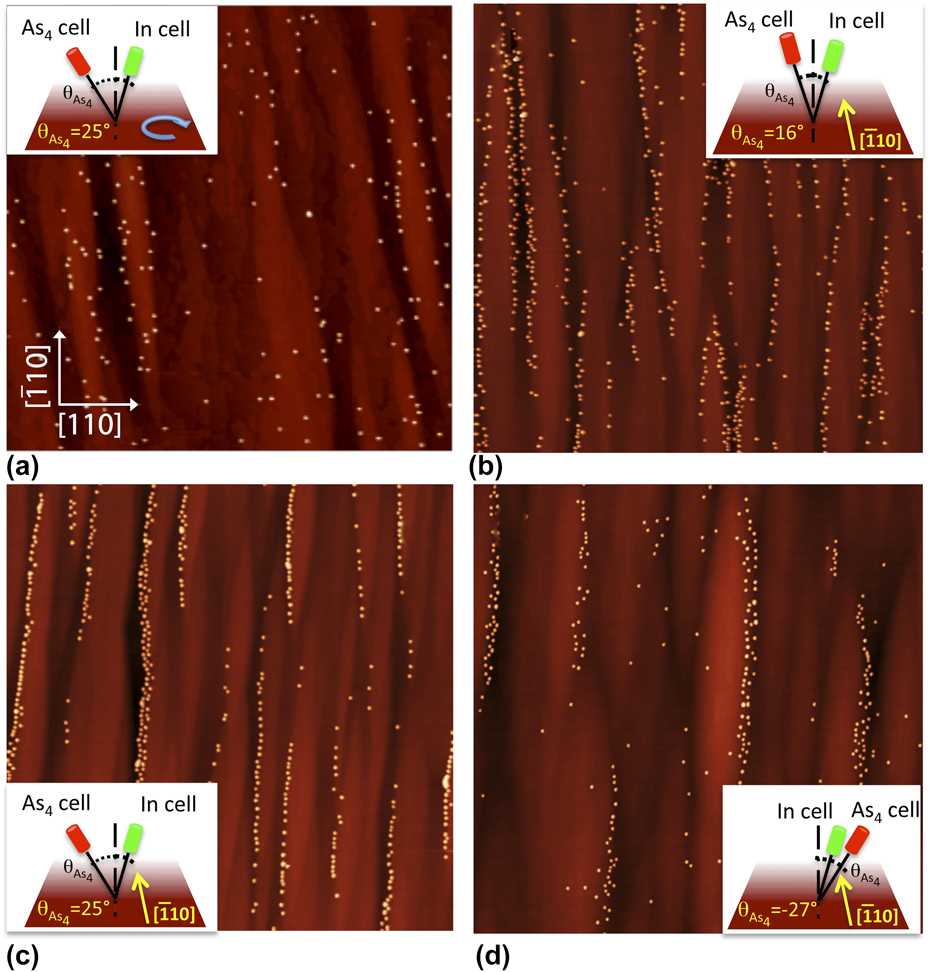
AFM topographies, 5 × 5 μm2. Drawings in the figures show the evaporation geometry on the sample. The morphologies have been obtained by PD after 2.45 ML of InAs at T = 545 °C, rotating the sample, and with As source oriented at θ = 25° with respect to the surface normal (a), without rotating with θ = 16° (b), θ = 25° (c), and θ = −27° (d). Panels (c, d) reveal the decoration of the step bunching on one side of the mounds.

The InAs depositions were carried out with a pulsed In flux (PD mode) and a continuous As4 flux, without rotating the sample. With reference to the orientation of the sample reported in Fig. 1, three different orientations of the As4 flux have been used with respect to the plane (110) of the sample with angles: −25°, −16°, and +27° (see Table I). The In delivery was cycled in 5 s of evaporation followed by 25 s of growth interruption with the As4 shutter permanently open. For all the samples studied, the InAs deposition was performed at a rate of 0.03 ML/s at 545 °C, a temperature where the stable surface reconstruction of GaAs(001) is (2 × 4). The As4/In flux ratio was about 40 to control the decrease of the In sticking coefficient with temperature. Reference Ohtake and Ozeki17,Reference Heyn18 Immediately after the InAs growth, the samples were quenched under As4 flux (beam equivalent pressure, BEP = 1.3 × 10⁻⁶ Torr).
Summary of the growth conditions (rotation, substrate temperatures, angles of fluxes with respect to the plane (110) of the sample, and fluxes) used for each sample presented in the paper.

For purposes of comparison, several samples were prepared under different growth conditions: one sample was grown using the same rates and growth temperature but with rotation switched on [Fig. 1(a)]. Other two samples were grown with rotation switched off but at different growth temperatures, 500 and 530 °C, respectively.
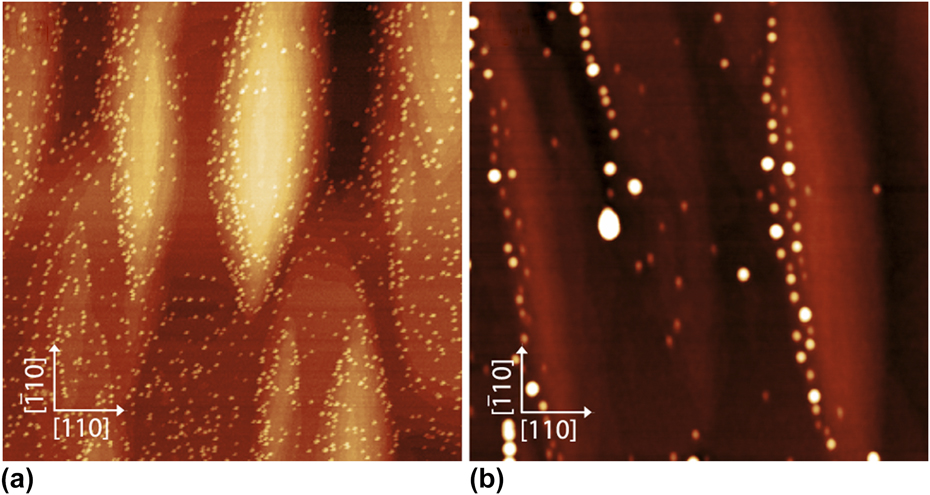
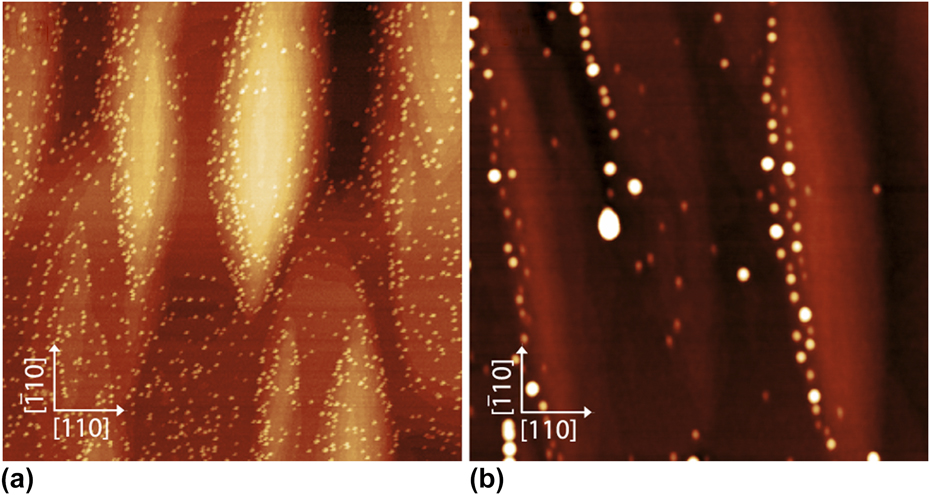
AFM topographies, 2 × 2 μm2 of 2.45 ML of InAs, grown with PD, without rotation, at T = 500 °C (a) and T = 530 °C (b).
The reflection high-energy electron diffraction pattern was monitored by a charge-coupled device camera during growth. Atomic force microscopy (AFM) VEECO multiprobe characterization was performed ex situ in the tapping mode by using ultrasharp nonconductive Si tips with a nominal radius of about 2 nm.
III. EXPERIMENTAL RESULTS
An example of selective growth of QDs is shown in Fig. 1, where the AFM topographies of four different samples, obtained after deposition of 2.45 ML of InAs, are reported together with the schematic drawings of the evaporation geometry used for each sample. In particular, the figure shows the orientation of the As4 and In fluxes with respect to the (110) plane of the samples. The images show the rippled morphology of the substrates (mounds elongated along the
 $\left[ {\bar 110} \right]$
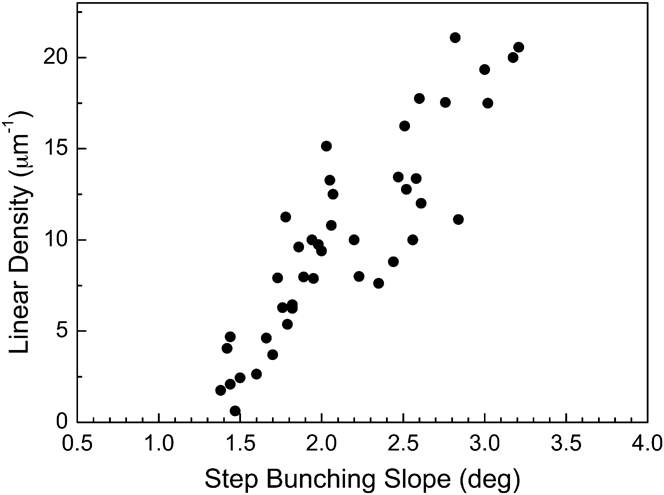
direction, with typical sizes ≈1.2 μm × 0.3 μm × 3 nm) produced by the kinetic instabilities that occurred during the buffer layer growth. As these structures can provide a template for the nucleation sites, owing to the higher density of dangling bonds leading to higher adatom binding energies, we have intentionally induced the formation of step bunching during the buffer layer growth (see Sec. II). In fact, AFM topographies of Fig. 1 show the QD decoration of the step bunching. In particular, the higher is the bunch slope, the higher is the linear density of QDs along the step bunches (Fig. 2). Very importantly, the topographies of Fig. 1 show clearly the strong correlation between the growth conditions and the resulting surface distribution of QDs. When InAs is deposited with the sample rotation off and with an oblique orientation of the As4 flux with respect to the (110) plane of the sample (see the drawings in Fig. 1), the QDs align along the step bunching of one single side of the mounds [Figs. 1(c) and 1(d)]. Such an asymmetry between the two mound sides is strongly reduced if the sample is grown with a continuous In flux,
Reference Arciprete, Placidi, Magri, Fanfoni, Balzarotti and Patella19
while it is completely removed when the sample rotation is on [Fig. 1(a)].
Linear density of QDs nucleated on the mound (sample not rotating and As source evaporating at θ = 25° with respect to the surface normal) plotted as a function of the slope of the step bunches.

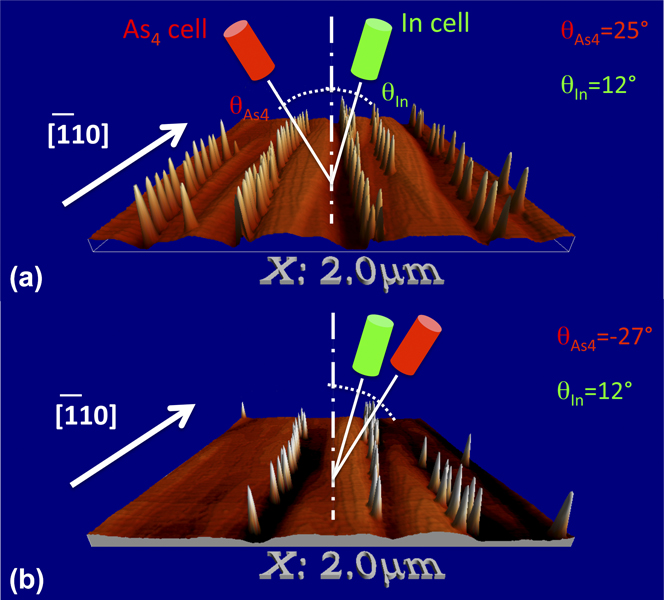
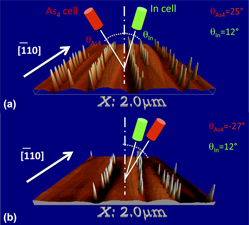
It is clearly evident that the mound side where the QDs are located is determined by the direction of the impinging As4 beam. In fact, if we reverse the direction of the As4 beam (Fig. 3), the mound side where the QDs are located is reversed as well. Furthermore, the percentage of asymmetry f ρleft (%) in the QD positioning [calculated as f ρleft (%) = (ρleft/ρ)100, where ρ is the QD number density] increases as a function of the angle between the As4 beam direction and the (110) plane. As can be seen in Figs. 1(c) and 1(d) and 3, InAs QDs are not found on the mound side opposite to the direction of the As flux [f ρleft (%) is typically in the range 95–99%]. A significant (32%) QD formation on this side is observable only when the angle of incidence of the As4 beam is decreased from 25 to 16° [Fig. 1(b)] or when the sample is grown with a continuous In flux [f ρleft (%) = 59]. Reference Arciprete, Placidi, Magri, Fanfoni, Balzarotti and Patella19
Three-dimensional perspective views of the AFM morphologies (2 × 2 μm2) changing the evaporation source of As from left (a) to right side (b).
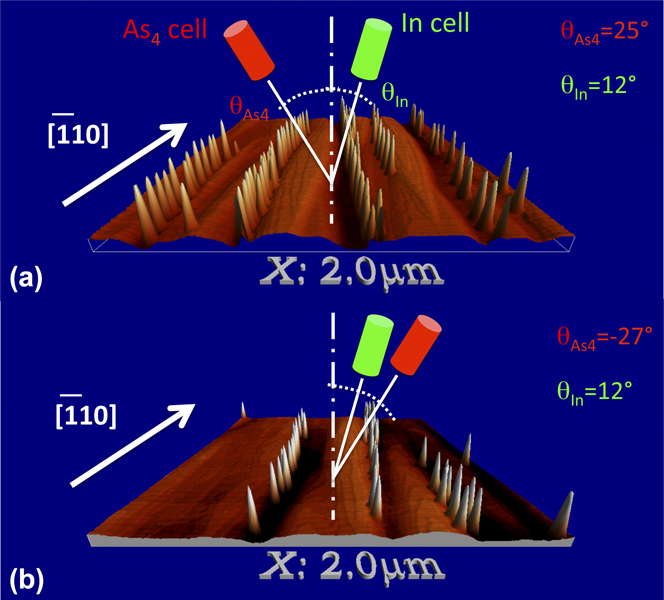
The observed phenomenology clearly demonstrates that the orientation of the As4 beam plays a central role in the selective nucleation of QDs. Conversely, the orientation of the In flux (Fig. 1) is not significant, since it is always the same for all samples, and almost vertical with respect to the sample surface (θIn = 12° on the right side with reference to the drawings in Fig. 1). The mounds on the substrate surface are completely symmetric and, for our growth conditions, the average slope along the [110] direction is in the range 1–3° (from sample to sample). Thus, any possible effect related to different slopes between the two sides of the mounds can be ruled out. Furthermore, the low average slope of the mound sides [e.g., 2.5 ± 0.5° for the sample of Fig. 1(c)] allows us to exclude shadowing effects of both As and In fluxes as the reason for the observed phenomenon, as instead recently observed for In flux in the case of mounds with very steep facets. Reference Yakes, Cress, Tischler and Bracker20
To complete the phenomenology, Fig. 4 shows the AFM images of two samples grown at two different temperatures: 500 °C [Fig. 4(a)] and 530 °C [Fig. 4(b)]. It is evident that the effect is temperature dependent since at T = 500 °C, the percentage of asymmetry f ρleft (%) is only 64%, whereas it increases markedly to 97% for T = 530 °C.
The key parameters to obtain the selective growth of QDs are essentially two: (i) the substrate temperature, which must be greater than ≈530 °C [Fig. 4(b)] and, (ii) most crucially, the orientation of the As4 beam, which must have a given direction with respect to the mounds and step bunching on the surface. These two points suggest that the role of In desorption should be considered too. At growth temperatures higher than 500 °C, In desorption rapidly increases and is strongly dependent on the As4 flux, thus influencing the growth mode of InAs. In Refs. Reference Ohtake and Ozeki17 and Reference Heyn18, it is shown that, for temperatures higher than 500 °C, InAs grows in the SK growth mode only if the As/In flux ratio is greater than a given value, but for temperatures higher than about 550 °C no InAs islands can be formed, irrespective of the As flux. At the growth temperatures used in the present work (530 and 545 °C), we are close to these critical conditions (for our growth conditions, we can estimate an In desorption rate of about 0.003 ML/s, i.e., about 10% of the In deposition rate) Reference Patella, Arciprete, Fanfoni, Balzarotti and Placidi21 : in fact, practically all QDs can be found only at particularly favorable sites, such as step bunching (Figs. 1 and 3).
The QD density difference that we observe between the two sides of the mounds must be related to the As flux gradient between the two sides generated by the oblique As evaporation. Actually, the evaporation geometry (Fig. 3) can account for a tiny difference of the As4 flux impinging on the opposite sides of the mounds. By considering an As4 incidence angle
 ${{\rm{\theta }}_{{\rm{A}}{{\rm{s}}_{\rm{4}}}}}$
= 25–27° and the average slope of the mound sides in the range 1–3°, the relative difference between the effective projected flux between the two mound sides is, on average,
 $\Delta {F_{{\rm{A}}{{\rm{s}}_{\rm{4}}}}}/{F_{{\rm{A}}{{\rm{s}}_{\rm{4}}}}} \approx (1 - 5)\%$
. To understand how such a small As surface density gradient affects the In adatoms distribution and the kinetics of dot formation, we have developed a kinetic rate equation model which predicts the time evolution of QDs (see Sec. IV).
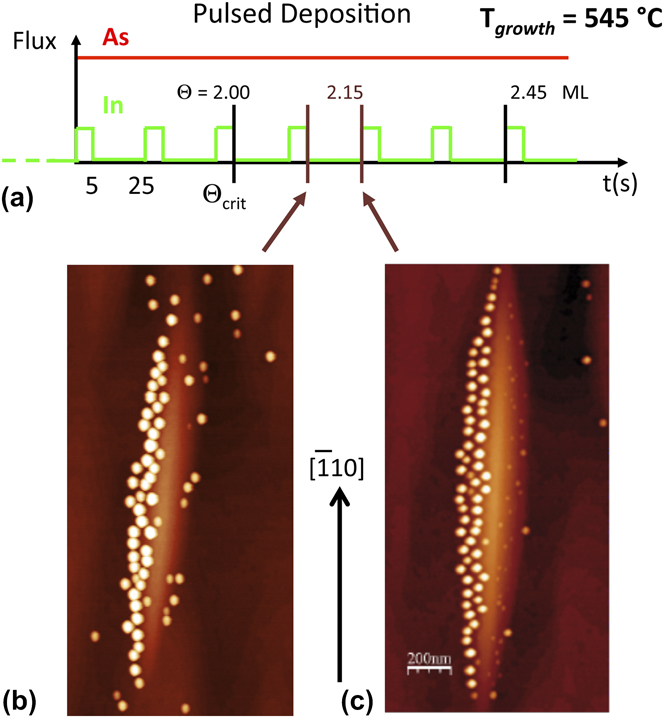
To understand the time evolution of the phenomenon and distinguish between nucleation and growth, we have grown two samples under the same growth conditions stopping the growth at a lower InAs coverage (2.1 ML). The samples were quenched at two different times during the growth cycle next to the one where the critical thickness was reached [Fig. 5(a)]. The first sample was quenched at the end of the 5 s of In evaporation, whereas the second one was quenched at the end of the growth interruption. The AFM images in Fig. 5 show that, at the critical thickness (or just after) for the 2D to 3D transition, QDs are nucleated on both sides of the mounds [Figs. 5(b) and 5(c)], although, at the stage of the growth reported in the figure, the dots on the right side already have a significantly smaller density [f
ρleft (%) = 79 for the sample in Fig. 5(a) and f
ρleft (%) = 74 for the sample in Fig. 5(b)]. A careful inspection of the images and the analysis of the sizes show, however, that the mean volumes of the dots on the opposite sides of the mounds change significantly during the growth interruption: while the sizes of the dots on the left side increase in volume from
 ${\left\langle V \right\rangle _{{\rm{left}}}} \cong 760{\rm{0}}\,{\rm{n}}{{\rm{m}}^{\rm{3}}}$
to
 ${\left\langle V \right\rangle _{{\rm{left}}}} \cong 8800\,{\rm{n}}{{\rm{m}}^{\rm{3}}}$
, the mean volume of the dots on the right side decreases from
 ${\left\langle V \right\rangle _{{\rm{right}}}} \cong 7200\,{\rm{n}}{{\rm{m}}^3}$
to
 ${\left\langle V \right\rangle _{{\rm{right}}}} \cong 1500\,{\rm{n}}{{\rm{m}}^3}$
. Thus, the AFM analysis of the samples shown in Fig. 5 suggests that the process which leads to the selective positioning of QDs is not only a process of selective nucleation, but the result of the combination of selective nucleation with a sort of ripening process. The result is the increase of the dot average volume on one side of the mound with the reduction of the average volume of the dots on the other side. Such a process seems to imply material transfer from one side of the mound to the other one.
(a) Schematic view of the pulsed deposition cycles. The coverage
 ${\Theta _{{\rm{crit}}}}$
of the three-dimensional transition is pointed out. (b, c) AFM topographies 1 × 2 μm2 after a deposition of 2.15 ML of InAs at T = 545 °C. The image shows that, at the end of the deposition cycle (b), nucleation of QDs occurs on both sides of a mound, while at the end of the growth interruption (c), QDs nucleated on the right side of the mound are dissolving.
IV. TWO-SPECIES KINETIC MODEL OF III–V QD GROWTH
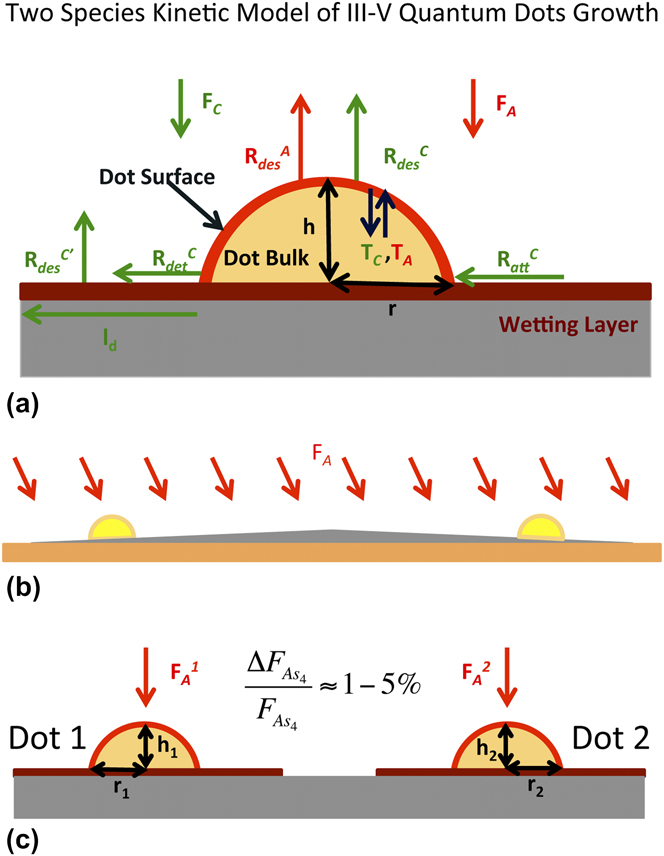
To explain the experiment, we have developed a two species kinetic model that predicts the time evolution of 3D islands from the appearance of small structures (radius 1–2 nm) and throughout cycles of 5 s of growth and subsequent 25 s of annealing period (PD growth mode). We model the dot [Fig. 6(a)] as a sector of the sphere with surface S
dot, where r is the radius of the circular base and h its height. The dot is coupled with a circular sector of the surrounding wetting layer (WL) with surface S
WL whose width depends on the cation diffusion length. The WL is modeled as an ensemble of rapidly diffusing cations.
Reference Patella, Nufris, Arciprete, Fanfoni, Placidi, Sgarlata and Balzarotti22–Reference Patella, Arciprete, Fanfoni, Sessi, Balzarotti and Placidi24
Each As4 molecule from the flux gives rise to only one As2 molecule weakly trapped in a precursor state. These molecules are assumed to be distributed all over the system. The As2 sticking coefficient depends on the availability of cations on the surface.
Reference Kratzer and Scheffler25
The considered microscopic processes are schematically shown in Fig. 6(a): desorption of both anions and cations from the dot surface (
 $R_{{\rm{des}}}^{\rm{A}}$
,
 $R_{{\rm{des}}}^{\rm{C}}$
), detachment (
 $R_{{\rm{det}}}^{\rm{C}}$
) and attachment (
 $R_{{\rm{att}}}^{\rm{C}}$
) from/to the dots to/from the WL of cations, desorption of cations from the WL (
 $R_{{\rm{des}}}^{{\rm{C}}\prime }$
) with a different energy barrier with respect to the dot. Furthermore, we distinguish between the surface and bulk regions of the dot including transfer to and from the dot bulk (T
C, T
A). The model is expressed through a set of coupled rate equations describing the time evolution of the number of atoms of each species: anions and cations at the dot surface (
 $N_{\rm{C}}^{\rm{S}}$
,
 $N_{\rm{A}}^{\rm{S}}$
), anions and cations in the dot bulk (
 $N_{\rm{C}}^{\rm{b}}$
,
 $N_{\rm{A}}^{\rm{b}}$
), and fast diffusing cations on the WL surface (
 $N_{\rm{C}}^{{\rm{WL}}}$
):
 $${{{\rm{d}}N_{\rm{C}}^{\rm{S}}} \over {{\rm{d}}t}} = {F_{\rm{C}}}{S_{{\rm{dot}}}} - R_{{\rm{des}}}^{\rm{C}}N_{\rm{C}}^{\rm{S}} + {1 \over 4}R_{{\rm{att}}}^{\rm{C}}N_{\rm{C}}^{{\rm{WL}}} - R_{{\rm{det}}}^{{\rm{C}}\prime }\,{f_{N_{\rm{C}}^{\rm{S}}}} - T_{\rm{C}}^{{\rm{s}} \to {\rm{b}}} + T_{\rm{C}}^{{\rm{b}} \to {\rm{s}}}\quad ,$$
 $${{{\rm{d}}N_{\rm{A}}^{\rm{S}}} \over {{\rm{d}}t}} = F{\prime _{\rm A}}{{\rm{\lambda }} \over {{d_{\rm{C}}}}}{S_{{\rm{dot}}}} - R_{{\rm{des}}}^{\rm{A}}N_{\rm{A}}^{\rm{S}} - T_{\rm{A}}^{{\rm{s}} \to {\rm{b}}} + T_{\rm{A}}^{{\rm{b}} \to {\rm{s}}}\quad ,$$
 $${{{\rm{d}}N_{\rm{C}}^{{\rm{WL}}}} \over {{\rm{d}}t}} = {F_{\rm{C}}}{S_{{\rm{WL}}}} - R_{{\rm{des}}}^{{\rm{C'}}}N_{\rm{C}}^{{\rm{WL}}} - {1 \over 4}R_{{\rm{att}}}^{\rm{C}}N_{\rm{C}}^{{\rm{WL}}} + R_{_{{\rm{det}}}}^{{\rm{C'}}}\,{f_{N_{\rm{C}}^{\rm{S}}}}\quad ,$$
where F
C is the incident flux of In atoms and
 $R_{{\rm{det}}}^{{\rm{C}}\prime }$
is a size dependent detachment rate [see Eq. (4)]. In the case of As, we assume that the incorporation occurs only when the As dimer is in the precursor state and encounters an appropriate cation site,
Reference Heyn18,Reference Kratzer and Scheffler25
and obtains an incorporation rate that depends explicitly on the number of surface In atoms as
 ${F\prime_{\rm{A}}\, l/d_c}$
, where
 ${F\prime_{\rm{A}}} = {F_{\rm{A}}}{\rm exp}\left( {{{{E_{\rm{B}}}} \mathord{\left/ {\vphantom {{{E_{\rm{B}}}} {kT}}} \right. \kern-\nulldelimiterspace} {kT}}} \right)$
is the enhancement of the incident flux F
A due to the entrapment of the As2 molecules in the precursor with a barrier E
B = 0.25 eV.
 ${\rm{\lambda }} \,=\, {\rm{\tau }}\sqrt {{{2{\rm{\pi }}kT} \mathord{\left/ {\vphantom {{2{\rm{\pi }}kT} m}} \right. \kern-\nulldelimiterspace} m}}$
is the distance traveled by the As2 molecule during its lifetime τ ≈ 10−12 s, m is the molecule mass, and d
C is the average distance between two surface indium atoms.
(a) Schematic side view of a QD of radius r and height h, on top of the surrounding WL. The microscopic processes considered in the model are indicated by arrows and their expressions are given in the text. (b) Schematic side view of a typical mound represented in the scale: the lateral slope is 2.5°. The orientation of the As4 flux with respect to the sample normal is reported. (c) Schematic side view of the two-dot model.

The In detachment rate is given by
 $$R_{{\rm{det}}}^{{\rm{C'}}} = R_{{\rm{det}}}^{\rm{C}}{{l_d^2} \over {{S_{{\rm{dot}}}}}}\left\{ {\Theta \left( {{x_{\rm{C}}} - {1 \over 2}} \right){\rm{exp}[(2Xc-1)Ex/}k{\rm{T}]}\quad ,$$
where x
C is the cation content, Θ(x) is the Heaviside step function,
 ${{l_d^2} \mathord{\left/ {\vphantom {{l_d^2} {{S_{{\rm{dot}}}}}}} \right. \kern-\nulldelimiterspace} {{S_{{\rm{dot}}}}}}$
is the ratio between the surface spanned by the diffusing In on the dot surface and the actual dot surface area, and it is related to the frequency with which surface cations reach the dot border. An increase in the detachment rate observed for smaller dots is produced without the introduction of a new energy barrier. The factor in the curly brackets increases the detachment rate
 $R_{{\rm{det}}}^{{\rm{C'}}}$
and then decreases the detachment barrier only for In-rich surfaces and proportionally to the In composition
 $E_x = 0.45 \,{\rm{eV}}$
is estimated by ab initio calculation
Reference Rosini, Kratzer and Magri26,Reference Rosini, Magri and Kratzer27
.
 ${\rm{\lambda }} = {a_{\rm{0}}}\sqrt {{R_{{\rm{diff}}}}{t_d}}$
, where R
diff is the cation diffusion rate, a
0 the lattice parameter, and t
d the WL cation diffusion lifetime. Thus, the diffusion length comes to depend on the temperature but not explicitly on the As flux because of our simplified model of the WL. The number of In atoms on the dot border is given by
 ${f_{N_{\rm{C}}^{\rm{S}}}}$
in terms of the surface atoms
 $N_{\rm{C}}^{\rm{S}}$
and of the ratio between surface area and perimeter.
Bulk atoms are fully four-coordinated to atoms of the other species and are inert with regard to the growth events. They evolve as:
 $${{{\rm{d}}N_{\rm{C}}^{\rm{b}}} \over {{\rm{d}}t}} = T_{\rm{C}}^{{\rm{s}} \to {\rm{b}}} - T_{\rm{C}}^{{\rm{b}} \to {\rm{s}}} = {f_1}\left( t \right){\Psi _{\rm{A}}}\quad ,$$
 $${{{\rm{d}}N_{\rm{A}}^{\rm{b}}} \over {{\rm{d}}t}} = T_{\rm{A}}^{{\rm{s}} \to {\rm{b}}} - T_{\rm{A}}^{{\rm{b}} \to {\rm{s}}} = {f_2}\left( t \right){\Psi _{\rm{C}}}\quad ,$$
where f
1(t) and f
2(t) are introduced for each atomic species, respectively, to express how many bulk atoms of a given species are generated in the average for each incorporated surface atom of the other species.
 ${\Psi _{\rm{C}}} = {F_{\rm{C}}}{S_{{\rm{dot}}}} - R_{{\rm{des}}}^{\rm{C}}N_{\rm{C}}^{\rm{S}} + {1 \over 4}R_{{\rm{att}}}^{\rm{C}}N_{\rm{C}}^{{\rm{WL}}} - R_{{\rm{det}}}^{{\rm{C'}}}\,{f_{N_{\rm{C}}^{\rm{S}}}}$
is the net In flux on the dot surface (the difference between atoms incorporated at and leaving from the surface), while
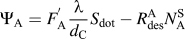 ${\Psi _{\rm{A}}} = F_{\rm{A}}^{\rm{'}}{{\rm{\lambda }} \over {{d_{\rm{C}}}}}{S_{{\rm{dot}}}} - R_{{\rm{des}}}^{\rm{A}}N_{\rm{A}}^{\rm{S}}$
is the same quantity for As atoms.
The kinetic coupled Eqs. (1)–(3) and (5)–(6) are solved using the Runge–Kutta method. An extensive discussion of all details of the model can be found in Ref. Reference Arciprete, Placidi, Magri, Fanfoni, Balzarotti and Patella19.
To simulate the experimental results, we modeled a two-dot system representing two dots nucleated on the two opposite sides of a mound [see Fig. 6(b)] and thus exposed to a slightly different As4 flux [
 $F_{\rm{A}}^{\rm{1}}$
and
 $F_{\rm{A}}^{\rm{2}}$
in Fig. 6(c)].
We consider that surface cations have a very large mobility at the high temperature used in our experiment; thus, a cation flow is expected to take place from the mound side, where the As flux is smaller, to the other side, if an unbalance in the cation density occurs between the two sides.
We introduce a coupling between the two dots, through the Fick law. The number of In atoms transferred per second,
 ${N_{{\rm{tr}}}}(t)$
from one WL region to the other is (assuming the two dot regions do not overlap):
 $${N_{{\rm{tr}}}}(t) = - 4D{{\Delta {{\rm{\rho }}_{{\rm{WL}}}}(t)} \over {L - \left[ {{r_1}(t) + {l_d}} \right] - \left[ {{r_2}(t) + {l_d}} \right]}}\left[ {{r_0}(t) + {l_d}} \right]\quad ,$$
where
 ${r_0}(t)$
is the average base radius of Dot 1 and Dot 2, and L is the typical distance between the dot regions on the two sides of a mound; we use L = 350 nm. D is the diffusion constant;
 $\Delta {{\rm{\rho }}_{{\rm{WL}}}}(t)$
is the difference in the cation density between the WL in the surrounding of Dot 1 and Dot 2.
V. RESULTS AND DISCUSSION
The results for a given set of energy barriers and parameters
Reference Rosini, Kratzer and Magri26,Reference Rosini, Magri and Kratzer27
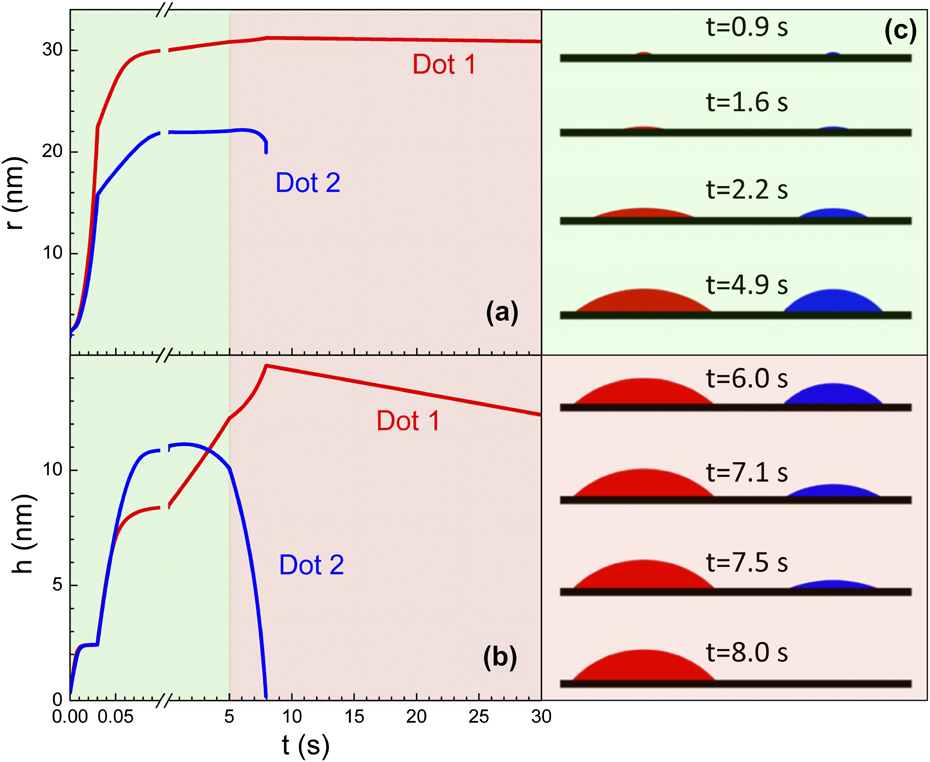
are shown in Fig. 7, where the dot radii and heights are plotted as a function of time during one deposition cycle for a growth temperature of 545 °C. Dot 1 is under an As flux
 ${{F}}^{\rm{1}}_{\rm{A}}$
= 30 atoms/(nm2s), whereas Dot 2 is under an As flux of
 ${{F}}^{\rm{2}}_{\rm{A}}$
= 27 atoms/(nm2s), the In flux is 0.2 atoms/(nm2s).
Time evolution at T = 545 °C of radium (a) and height (b) of Dot 1 (red lines) and Dot 2 (blue lines). In panel (c) snapshots of the two-dot evolutions are shown (the movie is available in Supplementary Information). Green regions highlight the time interval of In supply, whereas the pink regions are the In growth interruption.
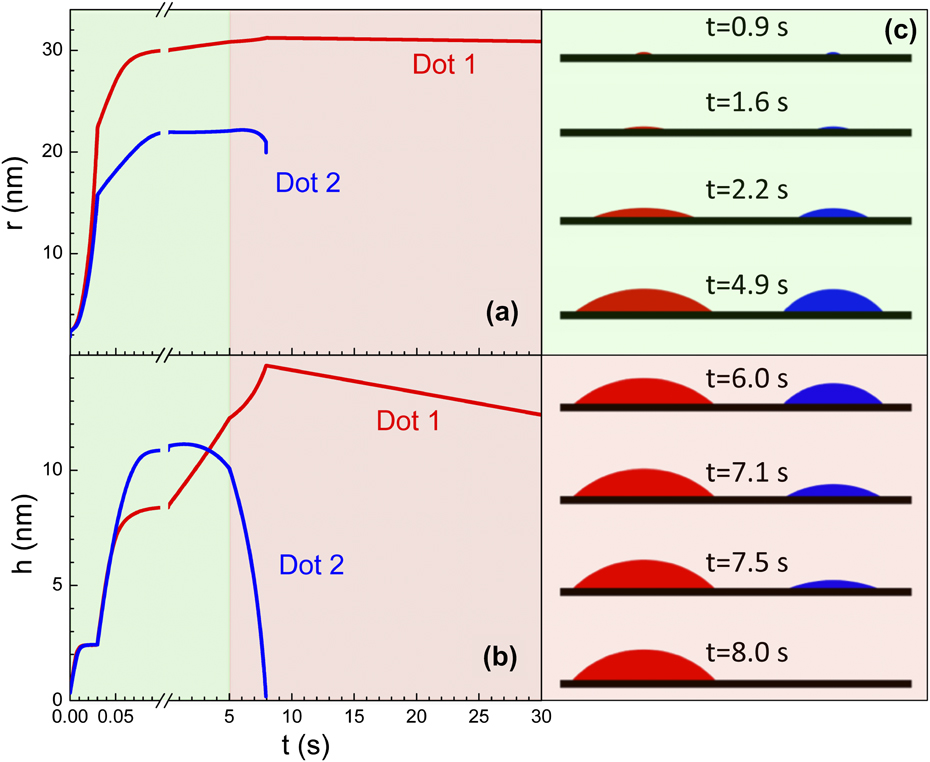
As expected, the small As2 density gradient between the two WLs originates a small In adatom density gradient which, due to the coupling between the dots [Eq. (7)], causes a cation flow from the region exposed to the smaller As flux (Dot 2) to that exposed to the higher As flux (Dot 1). At T = 545 °C, the mass transport between the two areas determines the dissolution of Dot 2 within the first 25 s of the annealing cycle [Figs. 7(a) and 7(b)], while Dot 1 continues to grow at the expense of Dot 2. This effect is temperature dependent, and no substantial difference in the volume time evolution is found between the two dots at T = 500 °C.
Reference Arciprete, Placidi, Magri, Fanfoni, Balzarotti and Patella19
This finding is in line with the experimental results, where the selective growth is sharp only at the higher temperatures [>530 °C as shown in Fig. 4(b)] and in agreement with the fact that several kinetic processes, mainly coarsening and In desorption, are activated at high temperatures.
Reference Kratzer and Scheffler25,Reference Rosini, Kratzer and Magri26,Reference Placidi, Dalla Pia and Arciprete28,Reference Arciprete, Placidi, Fanfoni, Patella, Dalla Pia and Balzarotti29
Both the experimental observations and simulations show that when
 ${{\Delta {F_{{\rm{A}}{{\rm{s}}_{\rm{4}}}}}} \mathord{\left/ {\vphantom {{\Delta {F_{{\rm{A}}{{\rm{s}}_{\rm{4}}}}}} {{F_{{\rm{A}}{{\rm{s}}_{\rm{4}}}}}}}} \right. \kern-\nulldelimiterspace} {{F_{{\rm{A}}{{\rm{s}}_{\rm{4}}}}}}}$
is reduced, the percentage of observed asymmetry is smaller. Indeed, the model predicts that the dissolution of Dot 2 is slower when
 ${{\Delta {F_{{\rm{A}}{{\rm{s}}_{\rm{4}}}}}} \mathord{\left/ {\vphantom {{\Delta {F_{{\rm{A}}{{\rm{s}}_{\rm{4}}}}}} {{F_{{\rm{A}}{{\rm{s}}_{\rm{4}}}}}}}} \right. \kern-\nulldelimiterspace} {{F_{{\rm{A}}{{\rm{s}}_{\rm{4}}}}}}}$
is smaller, enabling Dot 2 to survive during the annealing cycles.
To explain the In adatom density gradient which originates between the two WLs, we find that the higher the As flux intensity, the more As is incorporated at the dot surfaces. At high temperature, the As desorption increases leading to an In enrichment (As deficiency) of both the dot surfaces. For an As desorption barrier lower than 1.70 eV, the Dot 1 surface is still As-rich (anion content x A > 0.5), whereas the Dot 2 surface is In-rich (x A < 0.5). Due to Eq. (4), the In detachment rate from Dot 2 increases, and more In is released into the WL around Dot 2. On the other hand, the In incorporation kinetics is more efficient when more As is available. Thus, In is incorporated more efficiently into Dot 1 than into Dot 2, leaving a larger In density in the WL surrounding Dot 2. Both processes contribute to increase the In density around Dot 2 relative to that around Dot 1.
Figure 7(c) shows the dot shape evolution during growth (green area) and during the growth interruption (pink area). We can see that the dot exposed to the higher As flux (red) has always a much larger volume, in particular due to a larger base radius. Dissolution leads first to the flattening of Dot 2, which becomes a platelet before being completely dissolved in agreement with experimental results. Reference Arciprete, Placidi, Fanfoni, Patella, Dalla Pia and Balzarotti29
Finally, we need to mention that a very distinct role is played by Indium diffusivity. As shown in Eq. (7), the observed phenomenon requires a relatively high diffusion constant and corresponding diffusion length of the order of the distances between the step bunches. We find l d = 82 nm at T = 500 °C, and l d = 143 nm at T = 545 °C by using a diffusion barrier E diff = 1.34 eV, these values to be compared with the estimated experimental value ∼240 nm. A typical distance between two mound bunches L is in the range 200–400 nm. Since diffusion depends considerably on temperature, the activation requirements are clearly satisfied only at high growth temperatures.
A different choice for the energy barrier values changes not the occurrence of Dot 2 dissolution but only the time and the annealing cycle, at which dissolution takes place, provided the diffusion length is sufficiently long.
VI. CONCLUSION
The results presented here point out the role of As in the selective nucleation and growth of InAs QDs under suitable growth conditions. We have shown that the growth of InAs on a slightly rippled GaAs buffer layer, with a properly tilted incoming As flux, can lead to a selective growth of QDs at specific locations on the surface. We have developed a kinetic model which shows that the As flux gradient due to the oblique evaporation is responsible for an In-adatom drift current over the surface determining the positions where the QDs grow, provided the growth temperature is sufficiently high to enhance the In surface mobility. Our results offer new insights of the interaction kinetics of anions during the growth of both III–V semiconductors and other compound semiconductors for which the adsorption kinetics of one of the elements involves a highly mobile precursor state close to the surface.
Supplementary Material
To view supplementary material for this article, please visit http://dx.doi.org/jmr.2013.340.
ACKNOWLEDGMENT
We gratefully acknowledge the Cariplo foundation for financial support through the project number 2010-0525.