

Introduction
Changing defaults is an effective way to influence behaviour. However, many defaults only affect a precursor to a certain behaviour. A default may get people to express the intent to act in a certain way or get people into a situation where it will be easier for them to act in that way. In those cases, people may still not go on to adopt the intended behaviour. For example, people who are defaulted into joining a retirement plan (Madrian & Shea, Reference Madrian and Shea2001) may still not save at an appropriate rate (Choi et al., Reference Choi, Laibson, Madrian, Metrick, McCaffrey and Slemrod2006). People who are made to join a gym may still not frequent it regularly (DellaVigna & Malmendier, Reference DellaVigna and Malmendier2006). Displaying healthy food prominently in a cafeteria may get people to put more of that type of food on their plate, but that does not mean they will actually eat it (Bucher et al., Reference Bucher, Collins, Rollo, McCaffrey, Vlieger, Bend, Truby and Perez-Cueto2016). This also holds true in the context of organ donations, whereby third parties are less likely to respect a ‘nudged’ wish to donate than a wish that was not nudged. Indeed, doctors and relatives are less likely to proceed with an organ donation in cases where the donor's wish to donate was consistent with the default and was thus implicit – as is the case in presumed-consent countries – than when the wish to donate was against the default and was thus explicit, which is the case in an opt-in regime (Shaw, Reference Shaw2017). This may explain why organ donation rates are not as high in presumed-consent countries as differences in consent rates would indicate (Johnson & Goldstein, Reference Johnson and Goldstein2003).
Given these issues, it is essential to know how often people go on to behave in the expected way after going along with a default when the default only affects a precursor to the expected behaviour. If, for example, the default gets people to express the intention to act in a certain way, then psychological research suggests that there will be considerable loss when bridging the gap between intention and action. Indeed, a “medium-to-large change in intentions” (0.66 of a standard deviation) “leads to a small-to-medium change in behavior” (0.36 of a standard deviation) (Webb & Sheeran, Reference Webb and Sheeran2006). This still means that changing intentions by changing defaults should translate with some positive probability into the corresponding action. However, interventions discussed in Webb and Sheeran (Reference Webb and Sheeran2006) do not include changes in defaults (table 4, p. 259). Rather, they consist in giving information, increasing incentives, exerting social pressure, monitoring people, training them, etc.Footnote 1 The issue is that defaults only change the way a decision problem is framed and do not necessarily change preferences or beliefs about the options in a decision-making problem as those other interventions do. Therefore, changing intentions by changing defaults may not lead to significant changes in behaviour.
From a theoretical point of view, the issue we raise has to do with how to interpret the way defaults affect behaviour. Suppose a person has the choice between two possible actions, A and B. She usually did B, but A recently became the default, and she is now observed doing A. Does this mean that her preferences have changed, or is she in fact so close to indifference between A and B that she is ready to do A just to avoid the small cost of going against the default (Smith et al., Reference Smith, Goldstein and Johnson2013)? A policy-maker might say that this does not matter, as the default changed behaviour in the intended way. However, we argue this is too complacent a view. Indeed, in many cases, people are encouraged to do A because they are then more likely to do A′, which is the real objective. To use previous examples, we may want people to buy more fruit; however, this is not with the objective of increasing fruit sales, but rather to get people to eat more fruit. We may want people to join savings programs; however, this is not in order simply to increase subscription, but rather so people will save more. We may want people to enrol in fitness clubs; however, the idea is not for them to go there and smoke, but rather for them to engage in healthy physical activity.
The issue in all of these cases is that it is not enough to get people to do A – they must also go on to do A′. This is the case if the default changes people's preferences – but where it does not, we need to ensure that going from A to A′ will be very easy. Indeed, people who change their decision from B to A simply because of a change in the default are those who are rather indifferent about the issue in the first place and therefore do not see much of a difference between A′ and B′. Our point is that it is not enough to get people to just take the first step A towards adopting objective A′; we also need them to go further, which means we need to determine how motivated they are when adopting default behaviour A and how likely they are to go on to do A′ rather than B′.
In this paper, we illustrate this issue with an experiment on charitable giving, a domain in which this issue is particularly important. Default interventions are very effective in boosting charitable giving (Andreoni & Payne, Reference Andreoni and Payne2013; Altmann et al., Reference Altmann, Armin, Heidhues and Jayaraman2014; Schulz et al., Reference Schulz, Thiemann and Thoeni2015), but charitable organisations commonly lose between 40% and 60% of newly acquired donors between the first time they are solicited and the second solicitation (Sargeant & Woodliffe, Reference Sargeant and Woodliffe2007). This is particularly damaging because it is costly to recruit new donors, and therefore it is important that those new donors support the charity on a regular basis rather than with only a one-time donation. It is therefore important to know if defaulting people into giving only fosters superficial involvement from people who are unlikely to become long-term donors, because in that case, using such a behavioural intervention when soliciting donations may not be cost-effective.
In our experiment, participants fill out an online survey and receive a remuneration, which they can promise to give to a charity (‘pledge’, action A). Later on, they have to collect their remuneration in person, even if they pledged it to charity (‘collect’, action A′). Those who pledged can then go on to donate. As in Knowles and Servátka (Reference Knowles and Servátka2015), collecting the remuneration has an opportunity cost. We can thus measure motivation, as participants who are more motivated to fulfil their promise are more likely to go on to collect their remuneration. We find that people who promise to give when that is the default are less motivated on average than those who promise to give when that is not the default. This is because a portion of those people promises to give only because this is the default, and those people are those who are the least intrinsically motivated one way or the other. This is why they are less likely to go to the trouble of collecting their remuneration to fulfil their promise. Higher attrition in the portion of the population that goes along with the default thus reduces the impact of the default.
Related literature
This paper extends findings from psychology whereby subjecting individuals to a social influence technique fosters high compliance rates from them but also lowers their degree of involvement in the desired activity. For example, Dolinski and Nawrat (Reference Dolinski and Nawrat1998) report the result of a ‘fear-then-relief’ manipulation, which increased the probability that participants took part in a charity action but did not affect their degree of involvement with that action, as expressed by the number of days devoted to working for that charity on a voluntary basis.Footnote 2 Behavioural policy interventions may even push behaviour in the opposite direction to the intended effect. For example, Mazis et al. (Reference Mazis, Settle and Leslie1973) showed, that – contrary to the intended result – people not only developed more positive attitudes to certain banned detergents, but also showed a more negative attitude towards the government's involvement in mitigating pollution. We show that this issue also arises when people are subjected to contextual manipulations of their choices. However, we interpret the findings in terms of transaction costs rather than in terms of cognitive fatigue or reactance.
The phenomenon we explore is also related to the phenomenon of ask avoidance (Adena & Huck, Reference Adena and Huck2016; Andreoni et al., Reference Andreoni, Rao and Trachtman2017). Under ask avoidance, people go along with a nudge when exposed to it, but try to avoid being exposed to the nudge. However, unlike what would be predicted under ask avoidance, we find that whether participants maintain participation in our experiment does not depend only on whether they are defaulted to pledge money to charities. Rather, it also depends on how they react to the default; that is, whether they pledge when pledging is the default and whether they keep their remuneration for themselves when keeping is the default.
Our research is finally also related to investigations into the persistence of nudges; that is, whether repeatedly nudging individuals to adopt an action leads to persistent changes in behaviour. Allcott and Rogers (Reference Allcott and Rogers2014) show that providing comparisons with one's neighbours regarding energy consumption reduces energy consumption initially, but that this effect decays at about 10–20% per year after an initial phase of two years of nudging. Altmann and Traxler (Reference Altmann and Traxler2014) find that sending repeated reminders does not increase people's likelihood of going for a dental check-up compared with sending only one reminder. In this paper, we relate persistence of a default with attitudes to the default behaviour and show that small obstacles to implementing default behaviour can be enough to cancel the effect of a default.
Model and hypotheses
We adapt a model in Andreoni and Serra-Garcia (Reference Andreoni and Serra-Garcia2016) by separating the expression of a willingness to give to a charity from the act of actually giving to that charity. Participants first have to choose between either keeping their remuneration for themselves or pledging it to a charity. They then have to come to collect their remuneration, whether they pledged it to charity or not. At that point, they give to a charity or not. We consider how both acts – pledging and collecting – are affected by different costs: the cost n of going against a default and the cost c of physically going to collect a remuneration.
Denote α the perceived utility of giving money to a charity and n the psychological cost of going against a default, while m is the utility of money. If the default is to pledge to a charity, then a participant will pledge as long as α > m − n: that is, if the utility gained from giving is more than the utility of keeping the money minus the cost of going against the default. If the default is not to pledge, then a participant will pledge only if α − n > m. After a pledge has been made, taking the step of physically going to collect the money involves a cost c. A participant who has pledged to donate will go to collect the money and donate it only if α > c.Footnote 3 Conversely, a participant who decided to keep the money will go to collect the money and keep it if m > c. We assume that both α and c vary across participants: α follows cumulative distribution function F α and c follows cumulative distribution function F c. From this model, we derive four hypotheses, and we give their mathematical proofs in Appendix 1. The first hypothesis states that more people adopt a given behaviour if expressing the intention to adopt that behaviour is the default.
Hypothesis 1 (H1):
Treatments in which the default is to pledge will have more pledgers: Pr(α > m − n) > Pr(α > m + n).
This hypothesis is consistent with the literature on defaults (Thaler & Sunstein, Reference Webb and Sheeran2009).
The second hypothesis states that imposing a behaviour as the default induces higher attrition among those who adopt that behaviour. Fewer of those who express the intention to adopt a given behaviour go on to actually adopt that behaviour if expressing that intention was the default.
Hypothesis 2 (H2):
Pledgers will be less likely to collect when the default is to pledge than when the default is to keep: Pr(α > c | α > m − n) < Pr(α > c | α > m + n).
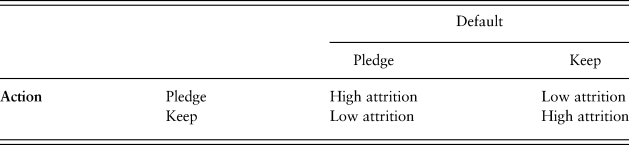
This hypothesis can be contrasted with the phenomenon of ask avoidance (Adena & Huck, Reference Adena and Huck2016; Andreoni et al., Reference Andreoni, Rao and Trachtman2017). Under ask avoidance, participants are less likely to go on with the experiment if the default is to pledge, whether they pledged or not. This is because some prefer not to pledge, but face a high cost for saying no when asked to pledge or when defaulted into pledging. They then try to avoid such experiences in the future. Under our hypothesis, the likelihood of maintaining participation depends on whether expressing the intention to donate involved resisting the default or not. When ‘pledge’ is the default, pledgers are on average less motivated to donate and are therefore less likely to go on to collect. Similarly, those who decide to keep when the default is to pledge are on average more motivated to keep and are more likely to go on to collect the money (Table 1).
H2: higher attrition among those who go along with the default.

The third hypothesis states that, despite higher attrition, imposing a default in terms of intentions will increase the number of people who go on with that intention and translate it into action.
Hypothesis 3 (H3):
Donations when the default is to pledge will be higher than when the default is to keep:  $Pr(\alpha > c\mathop \cap \nolimits \alpha > m-n) > Pr(\alpha > c\mathop \cap \nolimits \alpha > m + n)$.
This hypothesis states that a default that affects only the promise to donate should still result in higher donations, even after taking into account higher attrition among pledgers. We will test this hypothesis by comparing donations across treatments, as measured by the number of those who pledge and go on to collect.
Beyond considering the effect of defaults on behaviour, we also measure preferences and attitudes to the default and to the default behaviour. This allows us to explore the connection between attitudes to charities (α), the decision to pledge and the default. Later on, we explain how we measure α. In particular, we express the fourth hypothesis as follows:
Hypothesis 4 (H4):
Average α among pledgers will be lower in treatments where the default is to pledge: E(α | α > m − n) < E(α | α > m + n). Similarly, average α among those who do not pledge will be lower in treatments where the default is to pledge: E(α | α < m − n) < E(α | α < m + n).
The proof of this hypothesis is immediate. This hypothesis is important in view of research that shows that people often resent defaults (Felsen et al., Reference Felsen, Castelo and Reiner2013; Kataria et al., Reference Kataria, Levati and Uhl2014). We argue that putting a default in place will mean that attitudes to the default behaviour among those who go along with it will be worse on average than if that behaviour was not the default. Similarly, attitudes to that behaviour among those who resist the default will also be worse on average. This happens even though there is no actual change in attitudes in the population: the effect is only due to self-selection.
Having presented our model and hypotheses, we now present our experimental design and the variables we elicited.
Experimental design
The experiment consisted of three successive phases. In both of the first two phases, separated by a two-week interval, participants had to fill out an online survey. Participants were entitled to a remuneration of €4 if they completed the first two phases. The third phase consisted of collecting their remuneration. Both phases of the survey consisted of various demographic questions and some filler tasks, including psychological questionnaires (Appendix 2). The survey was hosted on the servers of the Max Planck Institute of Economics and was administered using the LimeSurvey Open Source survey tool (Schmitz, Reference Schmitz2015).
Phase 1 (default)
After completing the online survey, participants were asked to decide whether they wanted to pledge €2 to a charity. Three of the most popular charities in Germany (Schulz et al., Reference Schulz, Thiemann and Thoeni2015) were chosen to cover different areas of interest (World Wildlife Fund, German Red Cross, Amnesty International). We varied the pledge request along two dimensions: (1) the default option, which was either to pledge the money to a charity or to keep it; and (2) the choice set, whereby some participants were assigned one charity to pledge to, while others were given a choice of three charities that they could pledge to.Footnote 4
The participants had to exert some effort to avoid the default option, as they had to type a sentence expressing their wish if their wish contradicted the default. If the default was to keep the money, then participants who wanted to donate had to write “I would like to donate the 2 euros to [charity name]” in a free field. Those who wanted to keep the money could simply click on a ‘Continue’ button. If the default was to pledge the money, then participants who wanted to keep the money had to write “I would like to keep the 2 euros for myself” in a free field. Those who wanted to pledge could simply click on a ‘Continue’ button. In order to avoid some participants donating only to save themselves the bother of going to collect their remuneration, we warned them: “Whether you donate or not, you will need to come and collect the money at the University and sign a receipt for it.” The decision to pledge in phase 1 constitutes Variable 1 (‘V1’) ‘pledges phase 1’.
Phase 2 (no default)
The second phase came after an interval of two weeks. The aim of this second phase was to compare pledges with the first phase in order to see whether people behave in ways that are consistent with their first-phase behaviour. The same participants were invited to complete another survey and were asked to decide (without a default) whether to donate an additional €2. This decision was taken independently of what they had decided to do with the €2 they were asked to allocate in the first phase. For example, someone who pledged €2 in the first phase could choose not to pledge in the second phase. Unlike in the first phase, in the second phase, both options required the same effort: checking a box in front of the respondent's choice.Footnote 5
In this phase, there was no default, as participants had a choice of two options and simply clicked on their preferred option: “I would like to keep the 2 euros for myself” or “I would like to donate the 2 euros to [charity name].” Again, participants were warned that they needed to go and collect the money and sign a receipt even if they chose to donate the money. The decision to take part in phase 2 constitutes V2 ‘participation phase 2’ and the decision to pledge in phase 2 constitutes V3 ‘pledges phase 2’.
Phase 3: money collection and donations
Participants were given two weeks to collect the money after the end of the second phase. When they came to collect, a third party (a secretary) who was not involved in the experiment, did not know its purpose and therefore did not know whether the participants had elected to pledge or keep the money checked their identity against the list of participants who had completed both phases of the experiment and then gave them their €4 remuneration. At this point, participants were instructed to go to a private area on the way to the exit, where they could put what they had previously pledged into one of three piggy-banks labelled with the name of one of the three charities. This area was not monitored. We kept the donation setting anonymous in order to reduce impression management and social desirability concerns. The decision to collect money in phase 3 constitutes V4 ‘collection phase 3’.
Control questions
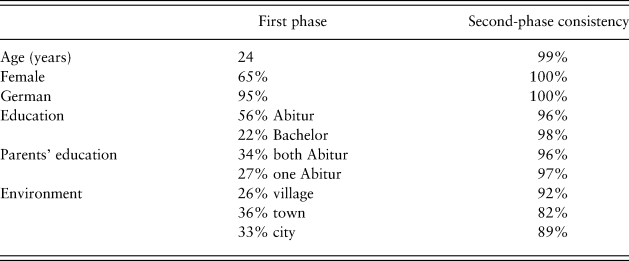
To measure how seriously individuals took the study, some questions were asked in both the first and the second phases of the experiment to be able to compare answers. Participants turned out to be very consistent between phase 1 and phase 2, as shown in Table 2.
Demographics and consistency in answers between the first and second phases.

Attitude to charities
After the pledging decision in each of the first two phases, participants were asked to fill out a questionnaire measuring their attitude to the charities. Due to the lack of any validated measuring instrument, a questionnaire was designed to fit the purpose of the study.Footnote 6 We followed common principles of questionnaire design in attitude and opinion research (Lietz, Reference Lietz2008). The 10 items in the questionnaire included measures of trust towards the charity as outlined in Cheung and Chan (Reference Cheung and Chan2000) (e.g., “I would like to know more about the charity” or “I think the work of the charity is important”; see Appendix 2). Participants answered each of the questions on a seven-point Likert scale (1 = strongly disagree; 7 = strongly agree). Two items were negatively worded and were recoded as 8 − answer so that their valence matches the positively worded items. V5 ‘attitude to charity’ is the sum of recoded answers. V5 therefore ranges from 10 to 70, with higher values indicating a more positive attitude. Our questionnaire has good psychometric properties in terms of internal consistency and test–retest reliability. Cronbach's α ranges from 0.86 to 0.92 depending on the charity in the first phase and from 0.87 to 0.92 in the second phase. Test–retest reliability ranges from 0.66 to 0.75 depending on the charity.
Attitude to fundraising
Attitude to fundraising was elicited at the end of both phases and was measured from answers to eight questions, two of which were coded negatively (e.g., “I would contribute money to charities in future experiments,” or “I felt forced to contribute”; see Appendix 2). V6 ‘attitude to fundraising’ is the sum of recoded answers, with higher values indicating a better attitude. This questionnaire has moderately good psychometric properties, with Cronbach's α = 0.68 in the first phase and 0.75 in the second phase. Test–retest reliability was 0.75.
Data collection
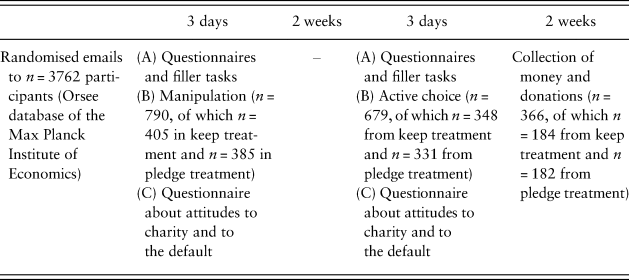
The study was performed at the Max Planck Institute of Economics. A total of 3762 participants were invited via email to take part in the experiment and 790 participants completed the first phase of the experiment (26% response rate).Footnote 7 The mean age was 24 years, 65% of the participants were female, 95% were German and 91% were university students. Of those, 679 (86%) went on to complete the second phase.Footnote 8 In total, 366 (47%) came to collect their remuneration for participating (€4). None of the participants was excluded from the analysis. Table 3 represents the chronology of the experiment with the exact numbers of participants in each phase.
Chronology of the experiment.

Participants were randomly assigned to a 2 (default: pledge vs. keep) × 2 (choice set: one vs. three) between-subjects design. Our goal was to obtain 150–200 participants per treatment in order to have a probability higher than 80% of observing a significant difference between pledges across treatment. Simulations were run assuming the default increased pledges by 10–15% from a level of 20–30%, and we required a 5% significance level with a Welch t-test with unequal variances. Of the 790 participants, 385 were in the pledge treatment and 405 were in the keep treatment. About half of the participants were assigned a charity to donate to, while the other half were given a choice of three charities.
Results
In the following section, we refer to the ‘pledge treatment’ as the treatment in which the default was to pledge in the first phase and to the ‘keep treatment’ as the treatment in which the default was for participants to keep the remuneration in the first phase. We call participants who said they wanted to keep the money ‘keepers’ and those who pledged the money to a charity ‘pledgers’. The results are presented according to the chronology of the experiment and the order of the hypotheses.
Higher pledges when the default is to pledge (H1)
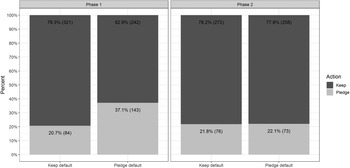
Figure 1 shows how treatments affected pledges in phase 1 and in phase 2. A total of 37.1% of the 385 participants who were defaulted to pledge made a pledge in the first phase, compared with 20.7% of the 405 participants who were defaulted to keep (z = 5.09, p < 0.001).
Result 1:
Setting pledge as the default increased pledges to charities. Participants in the pledge treatments were almost twice as likely to pledge in the first phase of the experiment. Hypothesis H1 is supported.
Pledge frequency by treatment in phase 1 (V1) and in phase 2 (V3) (n in parenthesis).

We compare those pledges with pledges made in phase 2, where there was no default, in the ‘Additional effects of the defaults’ section. This will give us indications as to the persistence of default behaviour and the effect of defaults on attitudes to charities.
Lower likelihood to maintain participation among those who go along with the default (H2)
Phase 1 to phase 2
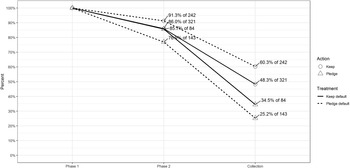
On average, 85.9% of the participants in the first phase took part in the second phase, and the average rate of retention did not differ across treatments (85.9% in the keep treatment, 86.0% in the pledge treatment). However, the interaction between treatments and pledges in phase 1 affected attrition from the first phase to the second phase and to the third phase (collection). We see in Figure 2 that the rate of retention among those who kept in the pledge treatment was significantly higher than among those who kept in the keep treatment (91.3% vs. 86.0%, z = 1.95, p = 0.051), while the rate of retention among pledgers in the keep treatment was higher than among pledgers in the pledge treatment, but not significantly so (85.7% vs. 76.9%, z = 1.60, p = 0.109). We therefore confirm H2 as follows:
Result 2:
Those who adopt a behaviour while resisting a default in phase 1 are more likely to maintain participation in phase 2 than those who adopt a behaviour while going along with a default. However, the difference is significant only for those who express the intention to keep against the default. Hypothesis H2 is thus partially supported when considering attrition between phase 1 and phase 2.
Number of participants and attrition by treatment and pledge in phase 1.
Notes: Percentage is expressed as the proportion of participants in the first phase with the corresponding action in the same treatment. For example, 221 out of the 242 keepers in the pledge treatment went on to participate in phase 2.

The hypothesised effect was significant only for those who expressed the intention to keep. This may be because the cost n of a ‘no’ for those who keep in the pledge treatment is higher than the cost of a ‘no’ for those who pledge in the keep treatment. Indeed, going against the default in the pledge treatment is costly not only because of the need to make the effort of spelling out one's intention, but also because it goes against moral norms of charitable giving, while going against the default in the keep treatment is not costly from a moral point of view for most people, and indeed may give some people a warm glow (Andreoni, Reference Andreoni1990). Therefore, the selection effect, which depends on a high level of n, may be most pronounced for those who keep.
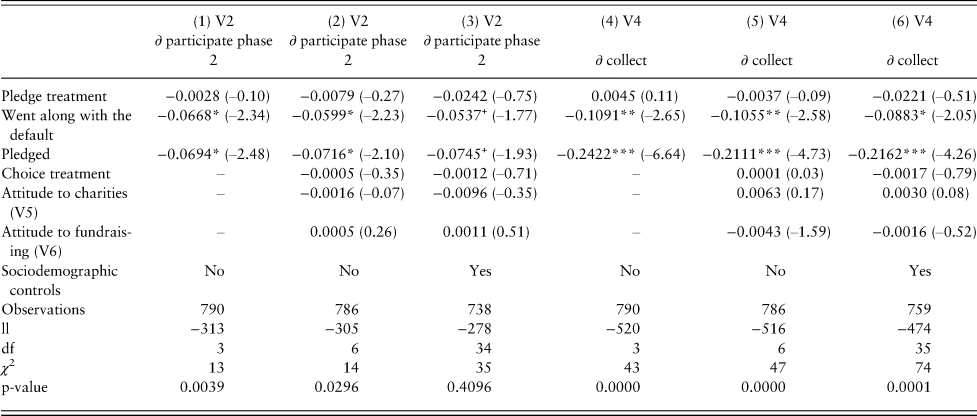
We test our findings for robustness by considering how variables other than the treatment and the pledge in phase 1 influence the likelihood of maintaining participation in phase 2 (V2). Results of logit regressions including attitudes to the individual charities (V5), attitude to fundraising (V6) and sociodemographic variables are shown in Table 4. We find that the likelihood of taking part in phase 2 is significantly lower for people who go along with the default (–6.68%, z = –2.34, p = 0.021). We also find that people who pledge money to charity are less likely to go on to phase 2 (–6.94%, z = –2.48, p = 0.016), independently of the default, which indicates that money pledged is less valuable than money kept. Combining those two effects explains why those who pledge in the pledge treatment are so unlikely to go on to phase 2. High attrition among pledgers who were defaulted into pledging is therefore a combination of valuing money pledged to charities less than their own money and pledging only to go along with the default. This goes some way to explaining the loyalty issue faced by charities.
Likelihood of participation in phase 2 and in phase 3 (collection) for participants in phase 1 (logistic regression, marginal effects).

Sociodemographic controls include gender, age, nationality, field of study, highest diploma, level of education of parents, size of city, source of revenue and level of expenses.
t-statistics in parentheses, bootstrapped with 1000 draws.
+p < 0.1; *p < 0.05; **p < 0.01; ***p < 0.001.
Phase 1 to phase 3
We further measured the level of commitment of our participants to their pledges by requiring all of them to come and collect their remuneration in person, whether they stated that they intended to donate the money to a charity or not. Overall, 28.6% of those who pledged went on to the third phase (collection), which is comparable to Adena et al. (Reference Adena, Alizade, Bohner, Harke and Mesters2017), where about half of what was pledged was donated, and to Fosgaard and Soetevent (Reference Fosgaard and Soetevent2018), where 23–36% of pledgers went on to donate. Figure 2 shows how treatments affected attrition from the first phase to the third phase (collection). As with attrition from the first phase to the second phase, we find that the rate of retention among those who keep in phase 1 of the pledge treatment was significantly higher than in the keep treatment (60.3% vs. 48.3%, z = 2.84, p = 0.005), while the rate of retention among pledgers in the keep treatment was higher (but not significantly so) than among pledgers in the pledge treatment (34.5% vs. 25.2%, z = 1.50, p = 0.133).
Result 3:
Those who resist a default in phase 1 are more likely to collect the money in phase 3, but significantly so only for those who kept against the default. Hypothesis H2 is thus partially supported when considering attrition between phase 1 and phase 3.
We test these results for robustness with logit regressions of participation in phase 3 (V4) on attitudes to the charity (V5), attitude to fundraising (V6) and sociodemographic variables (Table 4). We find that the likelihood of taking part in collection is significantly lower for people who go along with the default (–10.91%, z = –2.65, p = 0.008). In other words, making pledges the default selects for pledgers who are less likely to go on to collect and for keepers who are more likely to go on to do so. As previously commented, people who pledged money to charity in phase 1 are less likely to go on to collect than those who kept, independently of the default (–24.22%, z = –6.64, p < 0.001).
Higher expected donations in the treatment with a default to pledge (H3)
Overall, we found that there was a higher rate of attrition among pledgers and a lower rate of attrition among keepers in the pledge treatment. We now test H3, which says that, despite attrition, donations should still be higher in the pledge treatment than in the keep treatment. We consider how many of those who pledged in phase 1 go on to collect in phase 3; this is our estimate of the likelihood of donation. We find that out of the 385 participants of the pledge treatment, 143 pledge in phase 1, but only 36 of those pledgers go on to phase 3, compared to 29 out of the 84 pledgers in the keep treatment (Figure 2). The likelihood of donating, as estimated from the number of phase 1 pledgers who went on to phase 3, is therefore higher in the pledge treatment, but not significantly so (36/385 = 9.35% in the pledge treatment vs. 29/405 = 7.16% in the keep treatment, z = 1.13, p = 0.26).
Result 4:
Setting pledge as the default did not significantly increase donations, as judged by the number of pledgers who went on to collect their remuneration. Therefore, H3 is not supported.
Hypothesis H3 is not supported because the rate of retention among pledgers was not sufficiently high in the keep treatment compared with in the pledge treatment (H2). We already interpreted this as the result of the default not being as difficult to resist when the default is to keep (because going against the default is socially approved) than when the default is to pledge (because going against the default in that case is not socially approved).
Less favourable attitude to charities when the default is to pledge (H4)
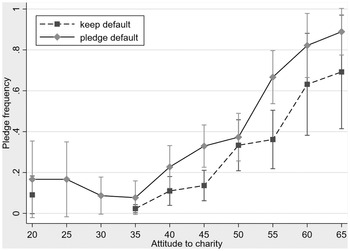
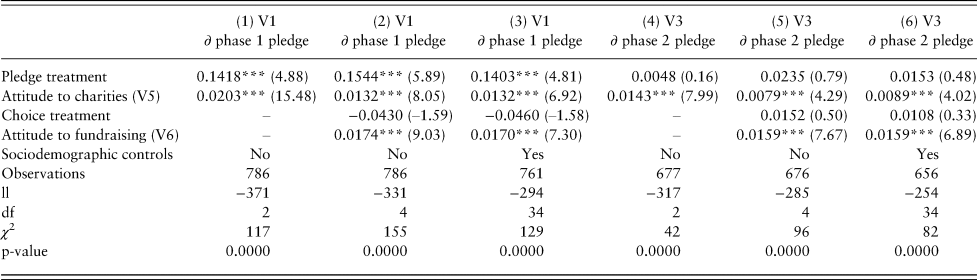
Those who pledged in phase 1 had significantly better attitudes to charities in phase 1 than those who kept (M = 53.74, SD = 8.74, n = 227 vs. M = 43.91, SD = 9.24, n = 559, t = 13.72, p < 0.001). Figure 3 confirms that the decision to pledge is closely linked to the attitude to charities, and making ‘pledge’ the default shifts the probability to pledge upwards in a uniform fashion. Logistic regressions of first-phase pledges on treatments, attitude to charities (V5), attitude to fundraising (V6) and socioeconomic variables confirm that the pledge treatment shifted pledges upwards and that attitude to charities was the main driver of the decision to pledge in the first phase (Table 5).
Frequency of pledges in phase 1 as a function of attitude to charities by treatment.
Notes: The 95% confidence intervals are from a bootstrapped logit regression (1000 draws). Participants with attitudes lower than 20 and participants with attitudes of 25 and 30 in the keep treatment never pledged, and participants with attitudes higher than 65 always pledged.

Pledges in phase 1 and in phase 2 (logistic regression, marginal effects).

Sociodemographic controls include gender, age, nationality, field of study, highest diploma, level of education of parents, size of city, source of revenue and level of expenses.
t-statistics in parentheses, bootstrapped with 1000 draws.
+p < 0.1; *p < 0.05; **p < 0.01; ***p < 0.001.
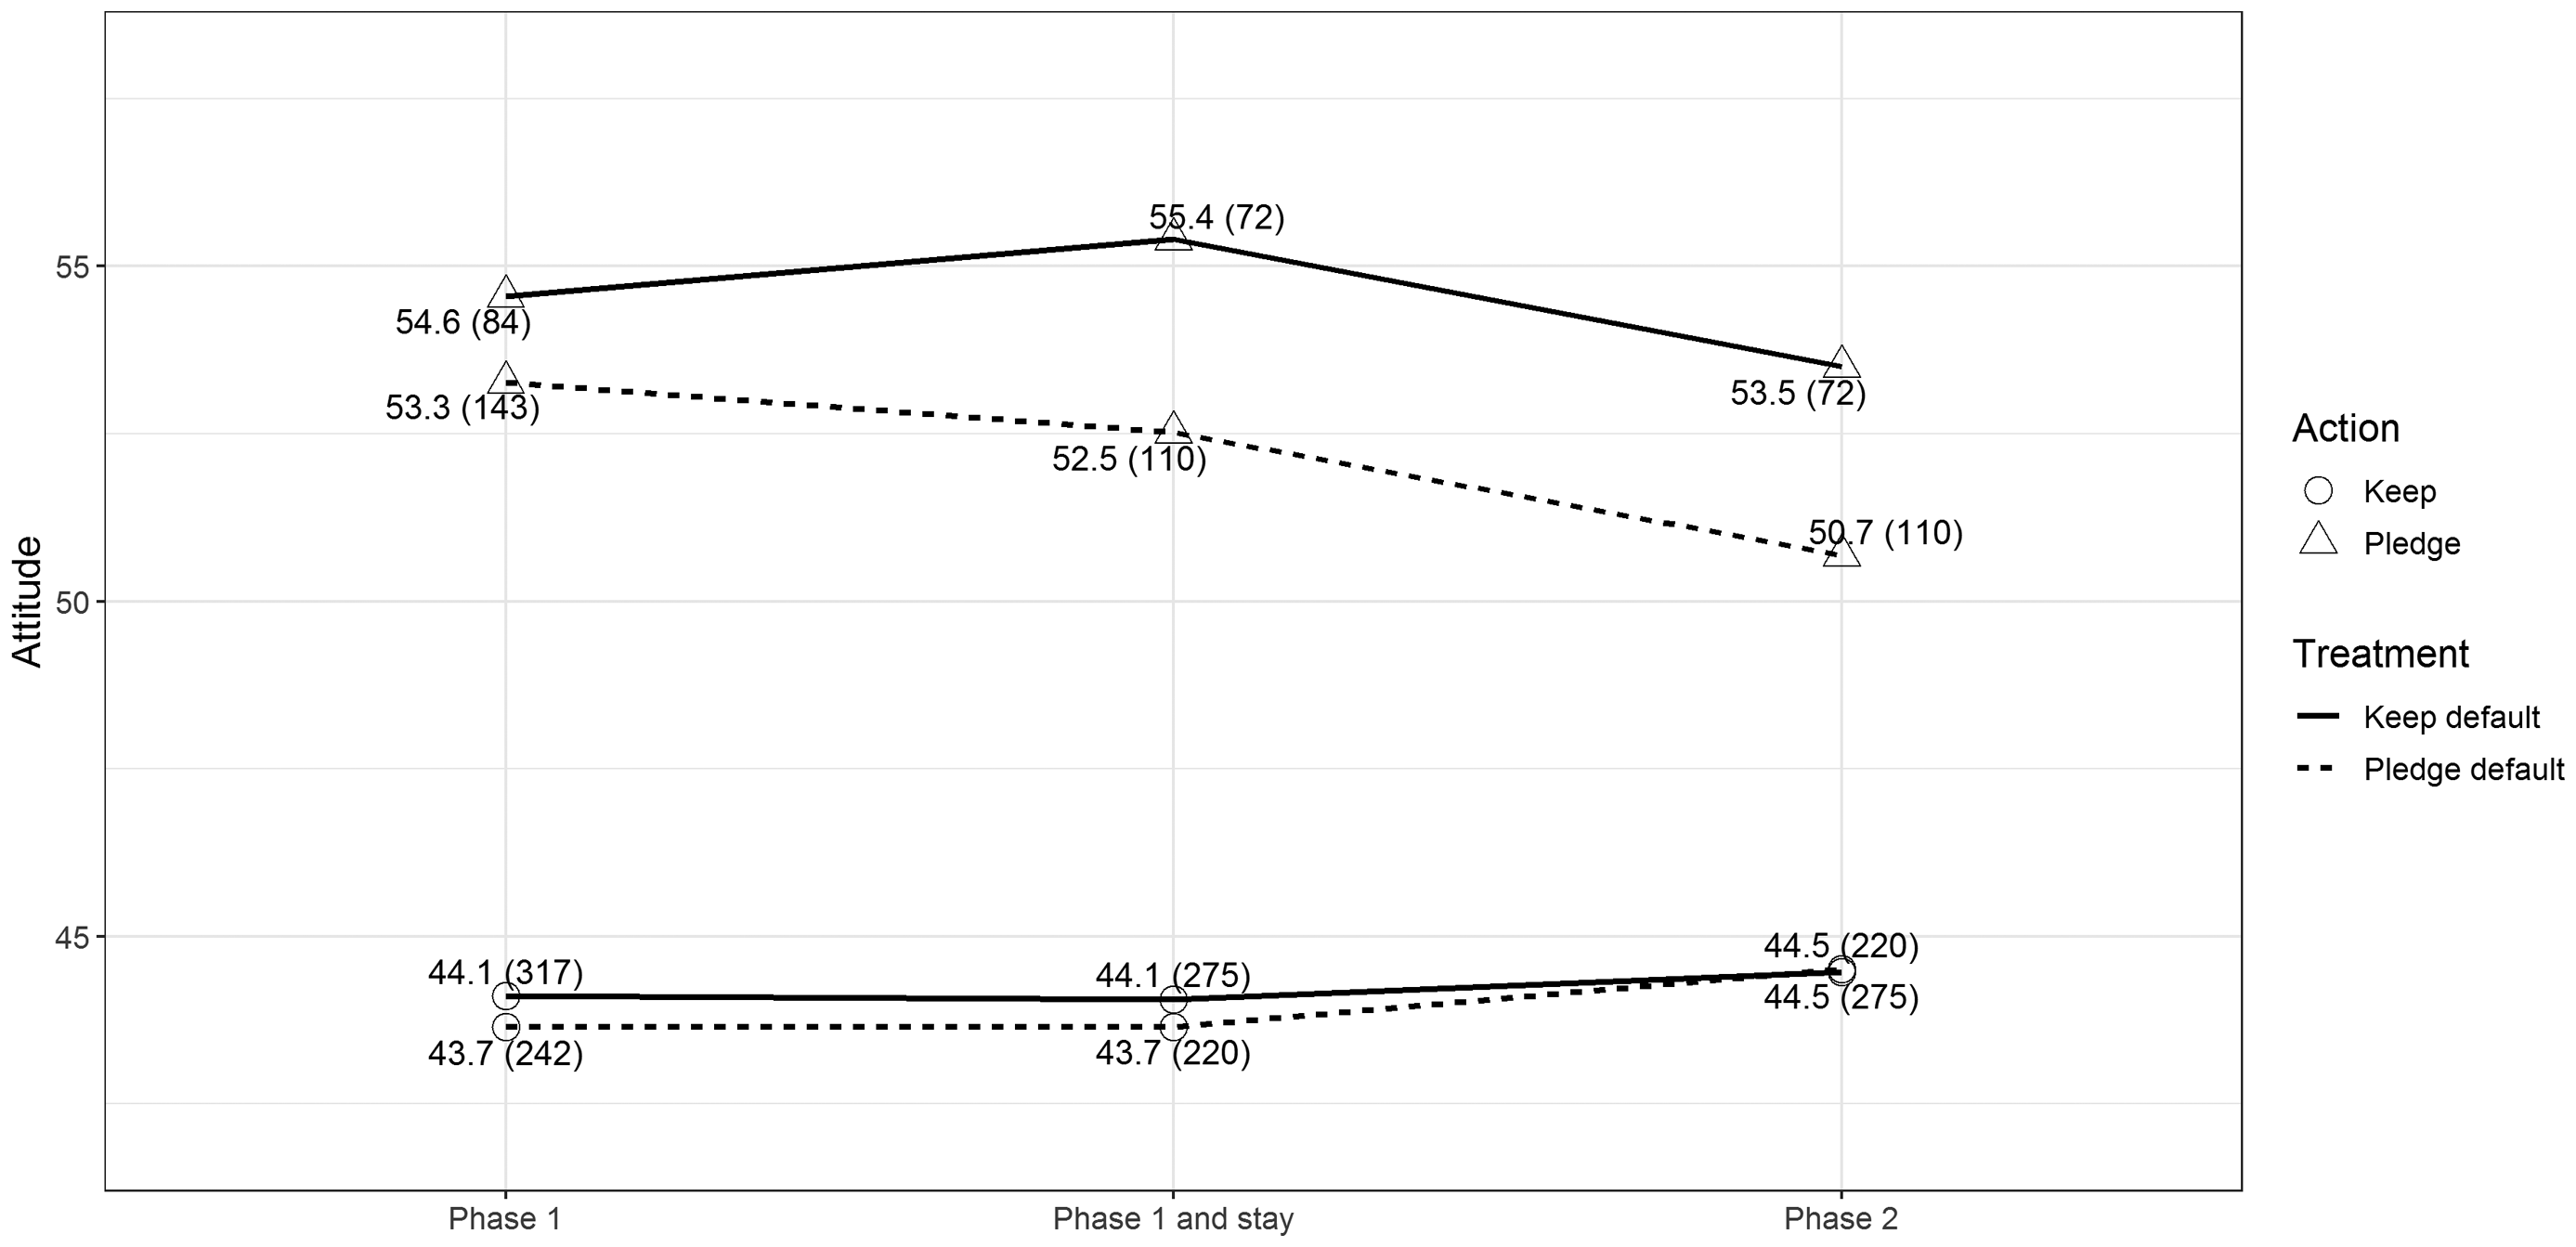
Figure 4 shows how attitudes to the charities (V5) depend on the phase of the experiment, the treatment and the pledge made in phase 1.
Attitudes to charity (V5) by pledge in phase 1 (V1) and treatment (n in parenthesis).
Notes: Measures of attitudes for phase 1 (first column) are shown for all those who took part in phase 1 and, for comparability with attitudes in phase 2, for participants who continued into the second phase. We classify people in phase 2 depending on their pledge in phase 1, not based on their pledge in phase 2. Numbers of participants may be slightly lower than those shown in Figure 2 because some participants did not go on to fill out the questionnaire on charities after making their decision to pledge or not.

As hypothesised (H4), those who pledged in the pledge treatment had less favourable attitudes to charities than those who pledged in the keep treatments. However, the difference is not significant (M = 53.27, SD = 8.68, n = 143 vs. M = 54.55, SD = 8.85, n = 84, t = 1.07, p = 0.29). Similarly, those who kept in the keep treatment had better attitudes than those who kept in the pledge treatment, but again, the difference is not significant (M = 44.11, SD = 9.35, n = 317 vs. M = 43.65, SD = 9.12, n = 242, t = 0.58; p = 0.56). We conclude that the statistics are in the direction predicted by H4, but the differences are not significant.
Result 5:
Average attitudes to charities among those who pledge and those who keep did not differ significantly depending on the treatment. Thus, H4 is not supported.
This lack of support for H4 may be due to how measures of attitude are less exact than measures of behaviour, as they are not incentivised. Contributing to this issue is the fact that the interpretation of questions and of options on the Likert scale may differ across participants. Another reason for this is that attitudes may themselves be affected by the default, in the sense that people express a more positive attitude to a behaviour when it is the default. Defaults can indeed be interpreted as indicating the socially approved action and therefore lead people to conform both their actions and their beliefs to the default. This effect goes in the opposite direction to that of H4, and may thus explain why it is not verified. The next section explores this possibility further.
Additional effects of the defaults
While we concentrated on the effect of defaults on the motivation to adopt a given behaviour, another aspect of our experiment is the effect of defaults on expressed attitudes to the default behaviour and on the likelihood of participants internalising the default behaviour. We explore this possibility with data from the second phase of the experiment, where there was no default.
Effect of the default on attitude to charities
Pledging money to a charity because of a default when one would not have done so otherwise may improve one's attitudes to charities so as to self-justify that pledge. Conversely, keeping the money for oneself against a default may lower one's attitude to charities. This is the case if, for example, in order to avoid cognitive dissonance (Festinger, Reference Festinger1962), people adapt their attitudes to align with their chosen option (Cooper & Fazio, Reference Cooper and Fazio1984). Indeed, changes in attitude-relevant behaviour can lead to changes in attitudes, as pointed out in Wood (Reference Wood2000), and people commonly tend to infer their attitudes from their own prior behaviour (Bem, Reference Bem1972; Olson & Stone, Reference Olson, Stone, Albarracin, Johnson and Zanna2005). The default in phase 1 may thus have become internalised by participants so that participants may self-justify their act (pledging) by updating their own self-concept into “I am a good person,” or “I am a person who gives to charity,” which might well evoke a positive feeling. In order to be able to evoke this positive feeling again and to be consistent with their own updated self-view, people would then be more eager to repeat behaviour displayed previously.Footnote 9 Another reason why pledgers may keep on pledging is that they discover that they are happy to have done so, even though they would not have pledged if that had not been the default (Anik et al., Reference Anik, Aknin, Norton, Dunn, Oppenheimer and Olivola2011). They would thus wish to repeat the experience.
In order to test for this possible effect, we make a within-subject comparison of attitudes to charities in phase 1 versus phase 2 as a function of whether pledging was the default (Figure 4). We find that the attitudes of those who kept improved from phase 1 to phase 2 (paired t-test, significant only in the pledge treatment), while the attitudes of those who pledged deteriorated from phase 1 to phase 2 (paired t-test, significant in both treatments). Participants therefore do not adjust their attitudes in the direction of their choice in phase 1. Rather, we hypothesise that defaults in phase 1 affected attitudes in phase 1. Requiring some people to go against the default so as to adopt their preferred behaviour and forcing some other people to go along with the default against their natural inclination leads participants to do more work to self-justify their choice. This may lead them to adjust their attitude to charities in the direction of the choice they made when answering the questionnaires in phase 1. In phase 2, however, where there is no default, participants are free to act more in keeping with their natural inclinations and may therefore answer the questionnaire in a way that is more consistent with their real attitudes, without having to self-justify their choice.
Effect of the default on the persistence of behaviour from the first phase to the second phase
Another test of the effect of defaults on behaviour is to compare pledges obtained in the first phase with pledges obtained in the second phase. We find that pledges were much less likely to persist if they were induced by a default than otherwise, as indicated by the fact that the frequency of pledge in phase 2 was equal across treatments (Figure 1). We find that while 76.4% of those who pledged in the keep treatment pledged again in the second phase, only 63.6% of those who pledged in the pledge treatment did so again in the second phase (z = 1.81, p = 0.07). Persistence in keeping was also lower in the keep treatment, as 92% of those who kept in the first phase kept in the second phase, while 99% did so in the pledge treatments (z = 3.23, p < 0.001). This explains why there was no difference in the percentage of participants who pledged in the second phase across treatments (22.1% of the 331 participants in the pledge treatment, 21.8% of the 348 participants in the keep treatment, z = 0.07, p = 0.95).
We interpret this to mean that true preferences were revealed in phase 2 of the experiment. Individuals who agree to donate only due to the default (rather than due to a genuine preference to do so) re-establish choices that are more consistent with their own preferences or drop out of the experiment. Overall, a comparison of statistics from the first phase and the second phase is consistent with the view that defaults did not change attitudes to charities, but rather acted only as a momentary obstacle to following one's natural inclinations.
Discussion of the design
Two aspects of our design warrant discussion: the specific form of our default manipulation and our choice to maintain anonymity in the collection phase, which prevents us from checking that donations correspond to pledges.
A strong default
The ideal default is such that one option is chosen in advance by the ‘choice architect’, but there is no cost in switching to the other option(s). In our case, going against the default requires some typing: writing out one's intention to go against the default. Writing out one's intentions may anchor the behaviour in a reflective thinking mode, whereby the intention is internalised and consequently more likely to be followed through (Martin et al., Reference Martin, Bassi and Dunbar-Rees2012).Footnote 10 While this is so, default interventions as they are implemented in practice seldom correspond to the ideal. If the default is not to donate one's organs after death, for example, then one must carry a card if one does wish to donate, while there is no need to carry a card if one is satisfied with the default option. If the default is to enrol in a savings plan or a health coverage plan, going against this may require filling out additional forms to express an intention to the contrary. If fruits are displayed in a prominent area in the cafeteria, then less healthy options are relegated to a less prominent display, which means one must exert more effort to reach them. The way we imposed a default is therefore consistent with practice.
Maintaining anonymity of contributions
In our experiment, the participants donated by putting money into piggy-banks corresponding to the charity they pledged to. This was done out of sight of the experimenters, so that we only know what those who came to collect their remuneration pledged to do, rather than whether they donated or not. We chose to adopt such a design because we were concerned that participants might react to normative pressures such as “What would people think of me if I didn't actually put the money into the piggy-bank for my chosen charity?” rather than their actual preferences. Therefore, the experiment was constructed in a way that allows us to relate an individual's behaviours and attitudes to treatments, but avoids adding their susceptibility to social pressure into the mix.
However, this means that participants could choose not to donate even when they had pledged to do so, as in Andreoni and Serra-Garcia (Reference Andreoni and Serra-Garcia2016). Nevertheless, other experiments on intertemporal giving show that few pledgers deviate from their commitments (section 3.4 in Breman (Reference Breman2011) and section 4.3.4 in Kellner et al. (Reference Kellner, Reinstein and Riener2019)). We have evidence that participants who came to collect knew what they had committed to do. Indeed, a control questions was included in phase 2 to test whether people remembered the decisions they had made in phase 1: “Do you remember what you pledged in the first phase of the experiment?”Footnote 11 There was a good correspondence between pledges and recall of pledges: 97.6% of those who said they had elected to keep the money in the first phase had indeed expressed that wish, and 100% of those who said they had pledged the money had indeed pledged. Only 10 participants did not remember their pledge in phase 1 when they completed the survey in phase 2. Reneging would thus have involved at least some psychological costs. More generally, there was good correspondence between answers to the survey in the first phase and in the second phase (Table 2). This means that participants took the experiment seriously and were careful to express the truth.
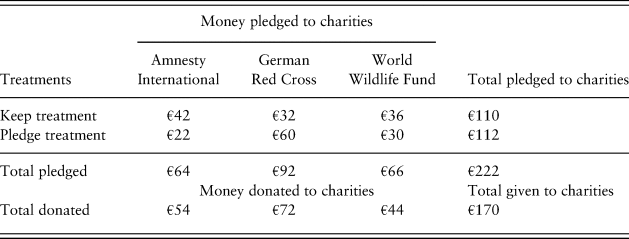
We also find that the sum of donations to each charity is consistent with pledges made by those participants who came to collect their remuneration: 77% of the amount of money pledged by those participants was indeed donated (€170 donated for €222 pledged; Table 6). The reason why less money was donated than pledged may be that the piggy-banks were located in a recess a bit away from the direct route out of the room where the money was handed out or that participants did not fully understand how to donate the money they had pledged. Overall, we therefore think that participants generally acted or intended to act as they had pledged when they collected the money, so that the number of pledgers who went on to collect is a good measure of actual donations.
Euros pledged and donated per treatment and charity, for those who collected the money.

Conclusion
We argued that those who go along with a behaviour when that behaviour is the default are less motivated, on average, by that behaviour than those who perform that behaviour when that behaviour is not the default. In our particular case, when promising to donate money to a charity was the default, then those who promised to donate were less likely to make the effort to actually donate. The effect we underline is a selection effect, whereby defaults select for less motivated participants. Defaults simply result in changes in the proportion of people coming to collect the money. The rate of attrition depends not only on what the default is, but also on whether people go along with or against the default.
The issues of motivation and attrition in this paper are quite general. Many defaults do not affect the behaviour of interest directly, but rather indirectly; for example, by defaulting people into promising to do something or getting them to take the first steps towards a certain behaviour. In that case, it is important to note that imposing a default mainly affects people who are not very committed to performing that behaviour. Therefore, for the default to be effective, the cost of translating those first steps into the intended action must be very low. Alternatively, the point at which the default is applied must be changed so that the default directly changes the behaviour of interest rather than its precursors.
In order to better understand our findings and test for alternative hypotheses, we measured attitudes to charities. The default seems to have merely lowered the threshold above which a certain behaviour (pledging) is displayed, rather than affecting the actual inclination to do so. Imposing a default meant that, on average, the subset of people who resisted it were more motivated to go on with their behaviour. This is not because resisting the default changed their attitude, but simply because of a selection effect. Indeed, we did not find any evidence that our results were due to changes in attitudes to charities on the part of the participants after being exposed to a default. Going along with a default to pledge did not result in better attitudes to charity. People did not change their attitudes to better correspond to what is prescribed by the ‘choice architect’. Similarly, and reassuringly, people who resisted the default behaviour did not become more resistant against that behaviour.
Future research could expand on our results by considering nudges other than defaults and by studying ways to increase the rate at which people transform a one-time, nudged action into a permanent behaviour. The goal would be to find ways to bridge the gap between the unconsciously guided (nudged) action and a conscious change in values. This could be done, for example, by highlighting the benefits the default behaviour brings to those who go along with it. Overall, our results support the notion that defaults are effective for specific and limited alterations of behaviour, but they are not enough for the transformational changes in values and attitudes that are needed for long-term success. Only a more detailed understanding of the nature of the relationship between defaults, attitudes and actual behaviour would provide the kinds of insights necessary to improve the effectiveness of such policy interventions.
Acknowledgements
This research was funded as part of Magdalena C. Kaczmarek's research fellowship at the Max Planck Institute of Economics, Jena (Germany). This paper was presented at the Workshop on Recent Advances in the Economics of Philanthropy at the WZB (Berlin, Germany), at the Faculty of Psychology of the University of Koblenz-Landau (Germany), at the Behavioural Science Centre of the University of Stirling (United Kingdom), at the Grenoble Applied Economy Laboratory (GAEL) in Grenoble (France), at the Law and Economics Seminar of the University of Kassel (Germany), at the 2015 ESA European meeting in Heidelberg (Germany) and at the 2016 Annual Workshop of the Social Sciences Committee of the German Economic Association (Göttingen, Germany). We thank Maja Adena, Paolo Crosetto, Dirk Engelman, Meirav Furth, Steffen Huck, Marcela Ibanez, Oliver Kirchkamp, Leonhard Lades, Gerhard Riener, Béatrice Roussillon, Maroš Servátka, Melanie Steffens, Robert Sugden, Fabian Winter and two exceptionally careful and insightful anonymous referees for their valuable remarks and suggestions.
Appendix 1
Proofs
The proof of H1 is immediate. We therefore only spell out the proofs of H2 and H3. In the following, we denote G = 1 − F and t the threshold for pledging to donate (t = m − n if pledging is the default, t = m + n else). A person pledges to donate if α > t and collects the money if α > c, after which the person donates the money. Consider a pledger (α > t) with a given draw x of c. If that draw is less than t, then the pledger collects. If that draw is more than t, however, the person who made the pledge will collect only if α > x. The probability a pledger will collect is therefore:
 $$\eqalign{& Pr(\alpha > c\vert \alpha > t) = \mathop \int \nolimits^{\rm} \left( {1_{x < t} + 1_{x > t}\displaystyle{{G_\alpha ( x ) } \over {G_\alpha ( t ) }}} \right) f_c( x ) dx \cr &\quad \hskip53.5pt= F_c( t ) + \mathop \int \limits_{x > t} {\rm} \displaystyle{{G_\alpha ( x ) } \over {G_\alpha ( t ) }}f_c( x ) dx} $$
The derivative of that expression with respect to t is:
 $$\eqalign{& f_c( t ) -\displaystyle{{G^{\prime}_\alpha ( t ) } \over {G_\alpha ^2 ( t ) }}\mathop \int \limits_{x > t} G_\alpha ( x ) f_c( x ) dx-\displaystyle{1 \over {G_\alpha ( t ) }} G_\alpha ( t ) f_c( t ) \cr & \quad \quad = \displaystyle{{\,f_\alpha ( t ) } \over {G_\alpha ^2 ( t ) }}\mathop \int \limits_{x > t} G_\alpha ( x ) f_c( x ) dx > 0} $$
subject to G α(x)f c(x) → 0 as x → ∞. Therefore, the likelihood a pledger collects is increasing in t. This is H2.
For a given level of requested individual donation m and a threshold t for making a pledge, collection probability is:
 $$\eqalign{ H( {m,t} ) &= Pr(\alpha > c\mathop \cap \nolimits \alpha > t) = Pr(\alpha > c\vert \alpha > t) \times Pr(\alpha > t) \cr & = F_c( t ) G_\alpha ( t ) + \mathop \int \limits_{x > t} {\rm} G_\alpha ( x ) f_c( x ) dx} $$
The derivative of this function with respect to t is − F c(t)f α(t) < 0. Therefore, setting pledges as the default increases donations. This is so even though, as stated in H2, pledgers are less likely to go on to donate when pledging is the default. This is H3.
Appendix 2
Experimental material: attitude questionnaires
Attitude to charities (V5)
1. I would like to know more about the charity. (+)
2. I think the work of the charity is important. (+)
3. I am interested in the work of the charity. (+)
4. I am indifferent about the work of the charity. (–)
5. I think the work of the charity has got meaning. (+)
6. There should be more charities like… (+)
7. The charity makes good use of its money. (+)
8. The charity wastes its money. (–)
9. My opinion of the charity is positive. (+)
10. The charity makes an important contribution. (+)
Attitude to the fundraising (V6)
1. I trust that the Max Planck Society will give the money I donated to the charity. (+)
2. I think that the Max Planck Society wants to support the work of the charity I pledged to. (+)
3. I would like to have more often the opportunity to contribute in future experiments. (+)
4. I would contribute money to charities in future experiments. (+)
5. I felt forced to contribute. (–)
6. I would like to have a wider choice of charities to contribute to. (+)
7. I am happy with my decision. (+)
8. I do not like this campaign for donations. (–)
Experimental material: survey questionnaires
Questionnaire for phase 1
You are taking part in an experiment that is financed by the Max Planck Institute of Economics. As stated in your invitation mail, this experiment consists of two phases. The first phase is starting now. We will contact you in two weeks for the second phase. Click on ‘continue’ to start phase 1.
Q1. Are you ready to take part in the second part of the experiment in two weeks? (You will be allowed to go on with the experiment only if you click on ‘Yes’)
Section A: personal information
Phase 1 starts with a questionnaire. Please answer the following questions truthfully. Click on ‘continue’ to go on to the next question. Please remember that your answers will be anonymised for the purpose of our analysis of the data and that your answers can therefore not be linked back to you.
1. What is your gender? (Male, Female)
2. How old are you?
3. What is your nationality?
4. What is your highest qualification? (Abitur (high school), two-year university degree, Bachelor, Master, diploma (= Master), PhD, Other)
5. Did your parents complete their secondary education? (1. None of my parents completed secondary education; 2. Only one of my parents completed secondary education; 3. Both parents completed secondary education)
6. Please tell us your current status. (Student (full- or part-time), worker (full- or part-time), unemployed, retired)
7. In case you are studying, what are you studying? (Humanities, social sciences, natural sciences, formal sciences, other applied sciences, I am not studying)
8. Where did you live most of your life? (Big city with more than 1 million people, big city with more than 100,000 people, city with more than 10,000 people, a village, countryside)
9. What are the main sources of your income? (Work (full-time), work (part-time), parents, scholarship, loan, other)
10. How much money do you spend in total over a month (including food, clothing, rent, heating, water, education, entertainment, etc.)? (1. Less than €500; 2. €501–€800; 3. €801–€1200; 4. €1201–€2000; 5. More than €2000)
Section B: self-assessment
In the next few questions, we are asking you to assess yourself and your behaviour. Please note that there are neither right nor wrong answers. Take your time and think about each statement carefully.
1. How risk-taking are you in general? (Please give a number between 0 and 10. Zero for avoiding as much risk as possible and 10 for being very risk-loving)
2. Do you believe that two people with the same qualifications should be paid equally, even when one person is more productive than the other? (Yes/No/Not Sure)
3. What do you think of the following statements? (Four-point scale from ‘totally agree’ to ‘do not agree at all’)
(a) In general, people can be trusted.
(b) Nowadays, we cannot trust in people so easily.
(c) When you are dealing with a stranger, it is better to be careful before you put your trust in that person.
4. Do you believe that most people …
(a) … would take advantage of you when possible?
(b) … would try to be fair to you?
5. Would you say that people most of the time …
(a) … strive to be helpful to others?
(b) … strive only to fulfil their own interests?
Section C: subjective experience
How well do the following statements describe your personality? On a scale from 1 to 5, 1 means that you disagree strongly and 5 means that you agree strongly.
1. I see myself as someone who is reserved.
2. I see myself as someone who is generally trusting.
3. I see myself as someone who tends to be lazy.
4. I see myself as someone who is relaxed, handles stress well.
5. I see myself as someone who has few artistic interests.
6. I see myself as someone who is outgoing, sociable.
7. I see myself as someone who tends to find fault with others.
8. I see myself as someone who does a thorough job.
9. I see myself as someone who gets nervous easily.
10. I see myself as someone who has an active imagination.
Section D: cognitive reflection tests and other questions
Many thanks for answering our questionnaire. We would like you now to think about a few problems.
1. A bat and a ball cost $1.10 in total. The bat costs $1.00 more than the ball. How much does the ball cost?
2. If it takes 5 machines 5 minutes to make 5 widgets, how long would it take 100 machines to make 100 widgets?
3. In a lake, there is a patch of lily pads. Every day, the patch doubles in size. If it takes 48 days for the patch to cover the entire lake, how long would it take for the patch to cover half of the lake?
4. You have the choice between three products, A, B and C. You know that A is better than B but not how C compares with A or B. Which of A, B or C do you choose?
5. One week ago, a colleague asked you for one more week to finish a project with you. He now tells you he will need yet another week to finish, so the project will not be delivered in time. What do you do?
(a) I wait one more week for my colleague to finish.
(b) I finish the project on my own so as to be on time.
Questionnaire for phase 2
You are taking part in an experiment that is financed by the Max Planck Institute of Economics. As stated in your invitation email, this experiment consists of two phases. The second phase is starting now. Click on ‘continue’ to start phase 2.
Section A: personal information
Same as section A of the first phase.
Section B: self-assessment
1. I am … (rather impatient–rather patient)
2. I tend to … (be directing to others–be directed by others)
3. I'm … thinking about my inner problems (seldom–especially often)
4. Others are … with my work performance in general (very satisfied–somewhat dissatisfied)
5. I trust others … (a great deal–very little)
6. I show … of my need for love (a great deal–very little)
7. I … tight connections to other human beings (avoid–seek)
8. I can deal … with money compared to other people (rather well–rather poorly)
9. I am … depressed (rarely–often)
10. I have … self-confidence (a lot of–very little)
11. I find it … to be popular with others (difficult–easy)
12. I … have disputes with other people (often–very rarely)
13. I feel … to other people (disconnected–close)
14. I give … importance to my appearance (little–a lot of)
15. It is … for me to work closely with others (difficult–rather easy)
16. I am … critical of myself (rarely–always)
17. I am … compared to others (especially docile–particularly stubborn)
18. I am … in defending my interests (rather poor–rather good)
19. People generally think of me as … (a strong person–a weak person)
20. I find it … to be attractive to others (very difficult–very easy)
21. I find it … to stick with what I am doing (rather easy–rather difficult)
Section C: subjective experiences
Same as section C of phase 1
Section D: cognitive reflection tests and other questions
Many thanks for answering our questionnaire. We would like you now to think about a few problems.
1. If it takes 20 minutes to cook a goose's egg, then how many minutes does it take to cook three geese's eggs?
2. Linda is 31 years old, single, outspoken and very bright. She majored in philosophy. As a student, she was deeply concerned with issues of discrimination and social justice, and also participated in anti-nuclear demonstrations. Which is more probable?
(a) Linda is a bank teller.
(b) Linda is a bank teller and is active in the feminist movement.
3. You have to choose between two applicants for a job at your company. That person will be working with you for one year on a project. Person A is a 26-year-old male with a master's degree while Person B is a 22-year-old woman with a bachelor's degree. Both are fully qualified for the job. Which person do you choose to hire?
4. There are nine black balls and one red ball in box A. A machine can draw balls from box A one after another at random and put them in box B. You will receive €1 for every ball in box B unless one of those balls is red, in which case you get nothing. You must choose how many balls the machine should take from box A and put in box B. How many balls would you ask the machine to take from box A and put in box B?