


1. Introduction
Perceptual Dialectology (PD) involves the exploration of lay people’s perceptions of where dialect variation exists in particular regions. PD can reveal socio-cultural attitudes that are otherwise not expressed overtly. This PD study focused on non-linguists who live in Cardiff, Wales to find out about their perceptions of dialect variation in the United Kingdom (UK). Wales, a country of just over 3 million inhabitants, is part of the United Kingdom and situated to the west of England (Office for National Statistics, 2016). Many scholars have chronicled the relationship between Wales and England and aspects of Welsh identity (e.g., Jones, Reference Jones1992; Williams, Reference Williams2003). In brief, Wales has long and complicated historical ties to England that have been dominated by an unequal power relationship where Wales is marginalized. Here we highlight ways that sociolinguists have explored and documented this relationship as this perspective is most relevant to the present research (e.g., Bourhis & Giles, Reference Bourhis, Giles and Giles1977; Garrett, Coupland & Williams, Reference Garrett, Coupland and Williams2003; Durham & Morris, Reference Durham, Morris, Durham and Morris2016). Studies of language regard in Wales have often focused on the bilingual context of Welsh and English (e.g., Bourhis & Giles, Reference Bourhis, Giles and Giles1977; Williams, Reference Williams1981; Giles & Johnson, Reference Giles and Johnson1987; Coupland et al., Reference Coupland, Peter Donald, Williams, Thornborrow and Coates2005). However, language regard with respect to varieties of English in Wales and the rest of the UK provide insight to the complicated relationships of these regions. Some sociolinguistic research has shown that the Welsh have maintained an independent identity in spite of the historical dominance of England (e.g., Bourhis, Giles & Tajfel, Reference Bourhis, Giles and Tajfel1973; Bourhis & Giles, Reference Bourhis and Giles1976, Reference Bourhis, Giles and Giles1977). For example, studies that focus on self-evaluations of language variation in Wales have found that local accents receive high ratings for social attractiveness but not prestige while “standard” accents are viewed as prestigious (e.g., Giles, Reference Giles1970; Coupland & Bishop, Reference Coupland and Bishop2007). This type of result is often attributed to linguistic insecurity, because it reflects the perception held by the raters that their variety of speech is subordinate to others (Labov, Reference Labov1966, Reference Labov2006). This feeling of subordination of speech variety is presumed to derive from subordination of the group within the social hierarchy (Lippi-Green, Reference Lippi-Green1997). In the context of Wales and England, then, it isn’t surprising that Welsh raters might find English from (parts of) England as more “standard” or “prestigious” than their own. Montgomery (Reference Montgomery2012) describes a similar “subordinate” relationship of Scotland and England where it is suspected to play a role in dialect awareness.
The present research is parallel to Montgomery’s (Reference Montgomery, Durham and Morris2016) research in Wales and uses the same survey instrument as that study (described below). Montgomery (Reference Montgomery, Durham and Morris2016) was particularly interested in the perceptions of dialects of English near the border of Wales and England. To that end, he surveyed students at four secondary schools located near the Wales/England border (three schools in Wales and one in England). Students were asked to draw where they believe dialect boundaries to be on maps of the UK and to label those areas. The results pointed to two key findings. Firstly, the results demonstrated a “proximity effect” (Montgomery, Reference Montgomery2012), such that “The Welsh participants’ perceptions were much more detailed and nuanced, with these perceptions extending over the border into England” (Montgomery, Reference Montgomery, Durham and Morris2016: 175). That is, Welsh students’ perceptions of dialect boundaries in Wales were more detailed than those of the English students and, at the same time, with regard to perceptions of dialect boundaries in England, the Welsh students provided responses similar to the English students. This unreciprocated perceptual awareness of dialect boundaries on the part of the Welsh students is similar to that found on the Scottish/English border by Montgomery (Reference Montgomery2012) and is likely due to the socio-political power imbalance between Wales and England described above. As Montgomery (Reference Montgomery2012:657) explains, “the knowledge that the smaller nation has about its larger neighbour is not reciprocated.” Such ingroup/outgroup preferences are often found in perceptions of dialects (e.g., Tajfel, Reference Tajfel1981; Montgomery, Reference Montgomery2012; Coupland and Bishop, Reference Coupland and Bishop2007; Hartley & Preston, Reference Hartley, Preston, Bex and Watts1999). The “proximity effect” was also found among the three Welsh schools with regard to perceptions of dialect boundaries within Wales. While Welsh students from all the schools identified north/south dialect regions in Wales, students from southern schools indicated dialect regions within the “South Wales” region that the northern students did not and vice versa. Secondly, with regard to perceptions of dialect boundaries in the rest of the UK, there was consensus. At least 50% of students surveyed (N=58) drew lines around and labeled Liverpool, Birmingham, Scotland, Newcastle and London (2016:164). In terms of affective evaluations of those regions, however, Montgomery found that students provided contradictory evaluative labels and concluded that there was “a general lack of agreement” among the respondents (170).
Garrett, Coupland & Williams (Reference Garrett, Coupland and Williams2003) provide a comprehensive report on several projects they conducted in Wales that explored the perceptions and attitudes held by Welsh teachers and students. Their study of secondary school teachers is most relevant here as that study involved asking the teachers (N=129) about their perceptions of regional dialect variation in Wales. They were asked to draw on a map of Wales regions that they believed were associated with different dialects (with a limitation of naming a maximum of 8 dialect regions). They were also asked to provide a label for the regions they marked and, further, to describe the impression they get when they hear the dialects from the regions they identified. In addition, teachers were asked to evaluate English dialect regions identified by the researchers using pre-determined scales. Lastly, teachers were asked an open-ended question about the social acceptability of the varieties they identified on the map. Here we report the results from the perceptual map portion of the teacher study. Garrett et al. (Reference Garrett, Coupland and Williams2003) found that the teachers consistently identified specific towns/cities or counties on their maps. Labels for the regions largely represented regional labels like “Valleys” and south, mid, north. Most of the labels referred to “linguistic features, affective qualities, and associations with Welshness and non-Welshness” (Garrett et al., Reference Garrett, Coupland and Williams2003:127). A content analysis of the labels resulted in nine categories. The most frequently identified regional categories were “Valleys,” “Cardiff,” and “North Wales.” Further analysis of the evaluative characteristics of the nine categories revealed social evaluations of the regions indicated by those categories. Evaluative comments for “Valleys” were mostly positive, while those for “Cardiff” and “North Wales” were mostly negative. The geographic category “South-West Wales” received the highest number of affective positive comments. Garrett et al. also found among the teachers a “perceptual and evaluative salience of a Welsh/non-Welsh dimension” (Reference Garrett, Coupland and Williams2003:139). That is to say “Attributed Welshness is a productive resource for sociolinguistic stereotyping” that can serve as a means for characterizing regions of Wales like Pembrokeshire as “un-Welsh” or South-West Wales as “true Wales” in spite of the characterization being based on accents of English (ibid).
Bourhis & Giles (Reference Bourhis, Giles and Giles1977:121) argue that a “Welsh accent (in English) has come to be a symbol of group solidarity.” Garrett et al (Reference Garrett, Coupland and Williams2003) demonstrate that, in spite of such coherence among English speakers in Wales, linguistic variation in Wales is a “delicate sociolinguistic ecology” (Reference Garrett, Coupland and Williams2003:19). Obtaining the perspective of residents of an important urban center like Cardiff, the capital of Wales with over 360,000 inhabitants (StatsWales, 2017), can only help in understanding the complexity of language regard in Wales.
Allport (Reference Allport, Lindsey and Aronson1954) shows that contact with outgroups can reduce bias toward outgroups, a concept he labeled “Intergroup Contact Theory” (ICT). Pettigrew & Tropp’s (Reference Pettigrew and Tropp2006) metastudy shows that ICT can apply to a wide range of social groupings (e.g., race, age, nationality). Because language regard reflects attitudes toward speakers of the varieties that they are asked about, it seems reasonable to consider a question with regard to ICT and language regard: How does a person’s exposure to places in the UK affect their perceptions of language variation in the UK? PD research has not typically explored the effects of exposure in PD maps. One exception is Demirci (Reference Demirci, Long and Preston2002). She suggests that the lack of geographic mobility experienced by Turkish women in her Turkish PD study may explain consistent gendered differences in the responses to her survey. This possibility was not directly queried, however, and remains a post hoc interpretation of the results. Benson & Risdal (Reference Benson, Risdal, Evans, Benson and Stanford2018) explored the effect of exposure to linguistic training on language regard. They found that respondents who were familiar with linguistics were more likely to rate non-standard linguistic features higher than respondents with little or no exposure to linguistics. For Benson & Risdal (Reference Benson, Risdal, Evans, Benson and Stanford2018) “exposure” relates to knowledge about language gained through linguistics courses while the present study considers “exposure” as knowledge about language gained through face to face contact. Nevertheless, we find Benson & Risdal’s results informative in that it demonstrates how exposure to dialects might relate to respondents’ perceptions of dialect difference. Therefore, additional demographic data was collected to help establish respondents’ length of residence in Cardiff and their travel experience (described below).
With consideration of the previous PD research in Wales and the possible effects of ICT on PD responses, we arrived at the following research questions:
1. What dialect regions do Cardiff residents perceive to exist in the UK?
2. What attitudes do respondents from Cardiff hold about dialect regions in the UK?
3. How does a person’s exposure to places in the UK affect their perceptions of language variation in the UK?
2. Methods
Recruitment of respondents was conducted using “snowball” sampling via formal and informal local community organizations in Cardiff (e.g., book groups, gyms, Cardiff University). A total of 118 maps were collected, however, only 103 are analyzed and discussed here (respondents who did not provide complete demographic information were excluded). The average age of the respondents was 32, there were 74 females, 26 males and 3 did not specify gender. The gender imbalance of the sample is likely due to the nature of snowball sampling and the self-selection nature of the data collection. Although gender differences in sociolinguistic research are well documented, little PD research has indicated specific gendered variation in PD data (e.g., Coupland & Bishop, Reference Coupland and Bishop2007; Demirci & Kleiner, Reference Demirci, Kleiner, Long and Preston1999) especially with regard to hand drawn maps (Montgomery, Reference Montgomery2007; Demirci, Reference Demirci, Long and Preston2002). As such it’s not clear how the gender imbalance in this data might influence the results. We discuss below how it may have affected the nature of the evaluative comments. Otherwise, the nature of the analysis conducted here does not allow for reliable inferential statistical analysis and we cannot address precisely how the data are affected by the gender imbalance. A majority of respondents (n=81) were born in Wales and 31 had lived at least half of their life in Cardiff. The remaining respondents were born in England (n=21) or abroad (n=1). While we draw attention to the “hometown” of the respondents, we do not exclude participants based on their length of residence in Cardiff or Wales. Face to face encounters foster shared understandings of a community regardless of one’s “hometown” (Hannerz, Reference Hannerz1996: 27). It is these shared understandings that PD seeks to uncover. As such we define the sample broadly as “inhabitants of Cardiff, Wales” without operationalizing length of time residing there thus avoiding an etic definition of “Cardiffian” (Eckert, Reference Eckert2012).
Respondents were given a survey identical to that used by Montgomery (Reference Montgomery, Durham and Morris2016). This survey consisted of a blank map of the UK with 9 major cities indicated on the map with a dot (effects of the city dots on the map are discussed below). Respondents were asked to label the 9 cities shown on the map, to indicate on the map where they believe dialect boundaries exist, to label those areas, and to give their opinion of those regions. More specifically, respondents were asked to:
“Draw lines on the map around the borders or boundaries of areas where you think there are dialect areas. These can be large or small areas, and you can add as many or as few as you want to. What names do you have for the areas that you have drawn on the map? Write any names you have for the areas on the map”
Travel experience was gauged with a question about travel with a fixed 4-way answer:
“Have you got much experience of travelling around the country?”
None at all: I don’t leave my hometown except for holiday once a year
Not much: I go to other places once or twice a year
Some: I go to other places 4 or 5 times a year
Lots: I go to different places all the time, at least once a month
Respondents were asked about their hometown, residency elsewhere and how long they had lived in other places. Recall that a majority of respondents (n=81) were born in Wales. Only a few respondents indicated that their travel experience was “none at all”.
The hand drawn maps were analyzed using a multi-step process that enabled all maps to be compared to each other digitally (Evans, Reference Evans2011, Reference Evans2013). First, the paper maps were scanned and georeferenced to a coordinate system commonly used in the UK (British National Grid, OSGB 1936) using ArcGIS 10.5 (Geographic Information System). Next the respondent’s hand drawn lines (dialect areas) on the scanned and georeferenced map images were digitized into vector polygon data in order to be analyzed by the GIS. Digitization involved manually “tracing” all the regions drawn by respondents on the scanned maps using ArcGIS. Respondent ID, respondent travel experience score, and labels given to regions by the respondent were attributed to the corresponding polygon areas in ArcGIS.
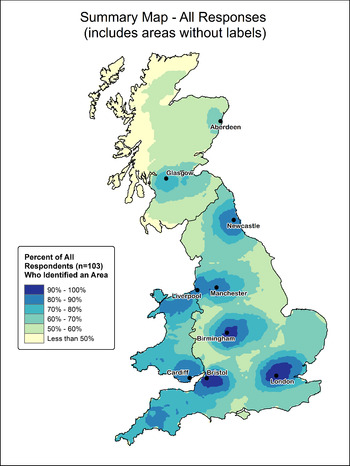
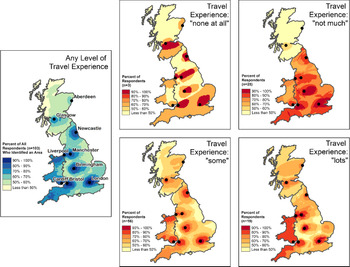
The composite set of all participants’ digitized map regions could then be “added” together, resulting in the heatmaps shown below (Maps 1, 2). When creating these heatmaps, we first dissolved all individual polygons drawn by each respondent into one multipart polygon. With this method, overlapping areas drawn by the same participant are only counted once. The resulting heatmaps depict how many respondents identified a part of the map as a dialect area. In addition to the overall heatmap of all respondents’ dialect areas, heatmaps were also generated using subsets of the respondents. Based on the responses to the fixed 4-way travel question (described above), four different heatmaps were generated using only dialect areas drawn by respondents who specified the same level of travel experience. Finally, the labels given for the regions on the maps were analyzed and coded (described below) in order to explore evaluative associations of regions
Composite map of all participants’ response to “Draw lines on the map around the borders or boundaries of areas where you think there are dialect areas”

Composite maps of polygons grouped according to answer to the travel experience question.

3. Results
3.1. Drawing on maps
Map 1 shows a composite of the maps from all 103 respondents. No distinction is made among respondents who drew few lines and those who drew many.
Nearly all respondents (i.e., close to 100%) marked the cities with dots on the maps as a place that is a “dialect area” (see Map 1). It seems possible that the dots marking the cities on the maps for the respondents may have had an effect that biased respondents toward marking dialect boundaries based on city locations. Montgomery (Reference Montgomery2007), however, reports that results from perceptual dialect maps incorporating city location dots compared to those that did not showed no difference in the rate of frequency of a dialect area being indicated. That is, respondents marked the same regions on the map regardless of the type of map they were presented with. Braber (Reference Braber2015) also found that maps marked with cities did not affect the outcome of results (but see Benson & Williams, Reference Benson and Williams2017). In addition, in the present study, a few other regions that did not have cities marked on the map were marked by a high percentage of respondents. Northern Wales, Cornwall, and a portion of south western Wales (in the region of Carmarthenshire) were indicated as a “dialect area” by at least 81/104 respondents. This suggests that respondents’ answers may not have been limited by features indicated on the map.
As Map 1 indicates, the most frequently marked cities (i.e., those with the darkest shading) were London, Bristol and Birmingham. The second most frequently marked cities were Cardiff, Liverpool, Manchester, and Newcastle.
3.2. Labels
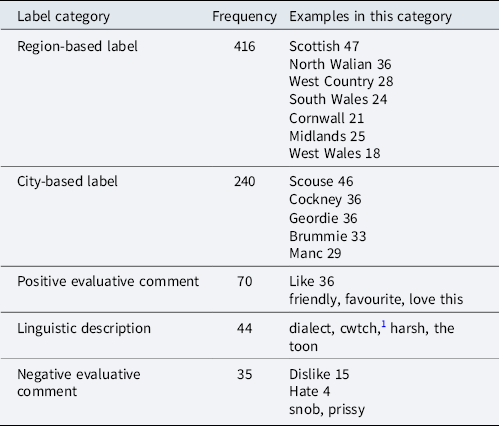
Respondents were asked to provide “names” for areas that they drew on the map, providing a total of 844 labels on 103 maps. A content analysis of labels was carried out by sorting labels into semantically similar categories (Krippendorf, Reference Krippendorf2004). Table 1 provides the label categories with the five highest frequency counts. In addition, examples for each category (also with frequency counts) are provided. The largest categories of labels are region based. This category is comprised of labels that refer to specific regions without reference to a specific city within the region.
Label categories, frequency counts for categories and examples

Within the region-based category, the terms “Scottish” “North Walian” and “West Country” are dominant. Map 1 shows that Northern Wales, Cornwall, and a portion of Carmarthenshire were regions indicated as a “dialect area” by at least 81/103 respondents. Northern Wales appears to be very salient to these respondents despite there not being a large city in that area. This is unsurprising as the regions of north Wales are salient divisions for many inhabitants of Wales (Garrett et al., Reference Garrett, Coupland and Williams2003; Williams, Reference Williams1981). Montgomery (Reference Montgomery, Durham and Morris2016) also found that a division of north and south Wales was the most prominent division drawn in Wales by his respondents. Carmarthenshire is an area that has historically been perceived as a particularly Welsh region with regard to culture and language (Garrett et al., Reference Garrett, Coupland and Williams2003; Williams, Reference Williams1981). This area was rated positively by Garrett et al.’s respondents and was in fact labeled as “the Welsh version of RP” by one of their respondents (Garrett, Coupland & Williams, Reference Garrett, Coupland and Williams1995:103).
The second most frequent label category was comprised of labels referring to specific cities, many of which are monikers for those cities such as Scouse (for Liverpool), Cockney (for London), Geordie (for Newcastle), or Brummie (for Birmingham). In fact, the monikers were much more numerous than the city names themselves for the most frequent city-based labels. For example, the term “scouse” was indicated 34 times while “Liverpool/Liverpudlian” was indicated 12 times.
3.3. Interpreting the maps and labels
With regard to the focus of respondents on cities, as discussed above, Garrett et al. (Reference Garrett, Coupland and Williams2003) found the labels their respondents attached to the areas that they had drawn on the maps were focused on cities and regions (112). Montgomery (Reference Montgomery2007, Reference Montgomery, Durham and Morris2016) also found that the identification of city-based names for dialect regions was frequent in his studies of the perceptions of English in the UK. In fact, he notes that this type of label is a relatively new phenomenon in British perceptual dialect geography, especially with regard to Manc (Montgomery, Reference Montgomery, Durham and Morris2016). Montgomery suggests that this city-based dialect awareness is consistent with regional dialect leveling in the UK and that increased “cultural prominence” of some UK cities may partly explain the high level of respondents’ awareness of dialects in those cities (Montgomery, Reference Montgomery, Durham and Morris2016: 203).
Evaluative labels (as opposed to regional labels) marked on the maps consisted primarily of “like” or “dislike” (see Table 1). Thus, the labels provided for the areas marked did not provide distinct evaluative judgments. This seems to be an effect of the questionnaire which specifically asked respondents to indicate for all the regions they marked whether they “liked them or not.” Respondents complied but without elaborating; many only wrote “like” or “dislike.” While this provides a positive or negative direction of their affective feelings about the regions they indicated, it provides us little in the way of why they “like” the region or what ideologies might be informing their responses. More evaluative labels for regional dialects from the present respondents were expected. Overtly evaluative labels that were positive outnumbered those that were negative (see Table 1). The larger number of positive evaluative comments may be a result of the sample being disproportionately female. Coupland & Bishop (Reference Coupland and Bishop2007:85) reported that in their data women were “regularly less negative in their evaluations of both prestige and attractiveness.” Montgomery (Reference Montgomery, Durham and Morris2016), as described above, did find some evaluative labels attributed to regions marked on maps. For example, the Welsh “Valleys” region attracted some evaluative comments such as “common,” “violent,” and “very Welsh” (2016:174). Montgomery concludes, however, that a consensus with regard to evaluative labels given by his Welsh respondents was not clearly present in the data.
Other research in Wales concerned with regard for different dialects of English has found clear preferences for particular varieties, with minority varieties typically downgraded with regard to “standard” English (e.g., Giles, Reference Giles1970, Reference Giles1971; Williams, Reference Williams1981) or minority varieties preferred over ‘standard’ English in the case of studies evoking loyalty to local identity (Williams, Garrett & Coupland, Reference Williams, Garrett and Coupland1996; Garrett, Coupland & Williams, Reference Garrett, Coupland and Williams1995; Coupland & Bishop, Reference Coupland and Bishop2007).Thus the relative absence of evaluative labels for dialect regions in the present data seems to set it apart from previous perceptual dialect map research in Wales (e.g., Garrett et al., Reference Garrett, Coupland and Williams2003; Montgomery, Reference Montgomery, Durham and Morris2016) and other countries (e.g., Preston and Niedzielski, Reference Preston and Niedzielski2003; Hartley & Preston, Reference Hartley, Preston, Bex and Watts1999 for the US). While Garrett et al. (Reference Garrett, Coupland and Williams2003:119) found clear regional and city-based categories, those categories were also comprised of labels that were unambiguously evaluative such that the authors carried out further categorization of the regional categories. Labels within the regional categories provided positive and negative evaluations of linguistic forms (e.g., “open,” “full”), social norms (e.g., “uneducated,” “posh”) and spatial belonging (e.g., “Welsh,” “anglicized”). Because speakers vary in their awareness of linguistic variation and ability to provide metalinguistic comments (Preston, Reference Preston, Jaworski, Coupland and Galasinski2004), broad regional labels may be a way to answer the question about dialect regions that enables respondents to reflect an intangible or vague sense of dialect difference that is perhaps not salient enough to be associated with a particular label. Such labels also allow respondents to single out dialect areas without indicating any affective evaluation. This might be a result of social desirability bias (DeMaio, Reference DeMaio, Turner and Martin1984; Garrett, Reference Garrett2010). The present results therefore prevent any inference regarding the respondents’ perspective on Wales in the socio-political and socio-cultural hierarchy of the UK. Further research is needed to understand this finding; it may be an artifact of the survey stimuli, an effect of social desirability bias, or some other factor.
3.4. The “proximity effect”
As explained above, Montgomery (Reference Montgomery2012) has described the potential of a “proximity effect” with regard to how respondents’ identify dialect regions that are nearby or farther away. At least 90% of respondents marked Cardiff, north Wales, and the West Country, all regions near Cardiff (see Map 1). Nearly 100% marked Bristol, suggesting that Bristol is slightly more “different” to these respondents than their own hometown, Cardiff. In fact, London, Bristol and Birmingham were marked more frequently than any region in Wales (see Map 1). These cities are large urban areas close to Cardiff so we might assume that these cities are more salient to Cardiffian respondents for that reason. Further research and interviews with respondents is necessary to confirm this.
The Welsh “Valleys”, a region near Cardiff to the north, were “strongly represented” in Garrett et al. (Reference Garrett, Coupland and Williams2003:113) thus presumably very salient to those respondents. Montgomery (Reference Montgomery, Durham and Morris2016) explains that 19% of lines drawn by his respondents marked the Valleys region (164) and that this region “attracted fewer comments” and were predominantly negative (174). There are few mentions of “the valleys” region in the present data. Only 13/103 of the participants labeled a region as “Valleys,” a rather surprising result given its historical salience and the proximity of the “Valleys” to Cardiff. It is not clear why the south Wales Valleys seem to be less salient to these respondents as this region continues to be the location of some of the most economically deprived communities in Wales (StatsWales, 2019), a fact that, presumably, contributes to its salience.
3.5. Travel experience
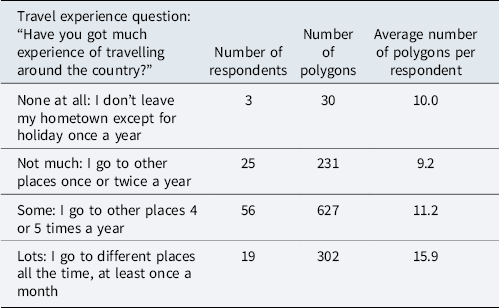
Table 2 shows frequency counts for the Travel experience question. Participants’ answers to this question were mostly “not much” or “some”; 25/103 said they don’t travel much (“I go to other places once or twice a year”) and 56/103 said they travel “some” (“I go to other places 4 or 5 times a year”). These subjective travel experience statements are not suitable for inferential statistical analysis, however, maps generated from each travel score group show some differences that merit discussion.
Responses to the Travel experience question (n=103) and number of polygons drawn by each group

As there were only 3 respondents who indicated that their travel experience is “none at all”, we focus our discussion on respondents who answered “not much”, “some”, and “lots”. If the average number of polygons drawn by members of each group is considered, we find that the “not much” respondents average 9.2 polygons per map; the “some” respondents average 11.2 polygons per map; and the “lots” respondents average 15.9 polygons per map. This suggests that the respondents who claim to travel more draw more polygons on the map. This travel experience-polygon relationship might be understood as the more traveled respondents having or believing they have a more nuanced perception of dialect regions than those who claim to travel less.
Map 2 presents four composite maps compiled according to respondents’ Travel experience answers (next to the Map 1 map for the purpose of comparison). These maps show that, in addition to drawing different quantities of polygons (Table 2), the different travel experience groups placed their polygons slightly differently. Firstly, considering Wales only, the “not much” respondents marked dialect areas less frequently than the “some” respondents, who marked areas less frequently than the “lots” respondents. That is, it seems that the “lots” respondents perceive more dialect areas in Wales than the other groups. Secondly, areas of agreement within a travel experience group, indicated by the darkest regions on the maps, are quite small or concentrated on the “lots” respondents’ map when compared to other groups’ map where the areas of agreement (darker areas) are large. This suggests the “lots” respondents drew smaller polygons suggesting they perceive more fine-grained dialect regions rather than broad regional dialect boundaries. For example, the dark areas around the key cities are much smaller in the “lots” respondents’ map than the “some” respondents’ map. While only tentative conclusions can be made from this rough measure of travel experience, it suggests that respondents’ travel experience may influence their perceptions of dialect regions and their representation of those dialect regions on PD maps.
4. Conclusion
With regard to “What dialect regions do Cardiff residents perceive to exist in the UK?” the present data show that these respondents perceive “dialect or regional” speech boundaries to be located around major cities but also southwest Wales. This is consistent with previous PD research in the UK and supports Montgomery’s (Reference Montgomery, Durham and Morris2016: 203) suggestion that increased “cultural prominence” of some UK cities may bias PD respondents toward a focus on city locations. It should be noted, however, that several of the city locations that appear to be salient to these respondents were provided on the map, potentially influencing their selection. However, other locations were noted by respondents in spite of them not being provided on the map. With regard to overt expressions of regard for dialect regions (“What attitudes do respondents from Wales hold about dialect regions in the UK?”) the present data show much less evaluative commentary about the regions than previous PD research.
In addition, we asked respondents about their travel experience to ascertain whether or not this might influence their responses to a PD map task. Composite maps and polygon counts suggest that the more traveled respondents have a more nuanced perception of dialect regions than those who claim to travel less. Thus we feel that the variation in the PD maps drawn by respondents with different travel experience is different enough to suggest, albeit with caution, that travel experience may indeed influence the respondents’ hand-drawn maps and labels.
Garrett et al. (Reference Garrett, Coupland and Williams2003) present valid caveats of language regard research, especially with regard to the decontextualized nature and validity of such research. Nevertheless, triangulation of methods can be seen to ameliorate these weaknesses. It is hoped that the present research can shed light on language regard in Wales but also in the context of other language regard research.
Financial support
Partial support for this research came from a Eunice Kennedy Shriver National Institute of Child Health and Human Development research infrastructure grant, P2C HD042828, to the Center for Studies in Demography & Ecology at the University of Washington.