I. INTRODUCTION
Wide band gap semiconductors such as ZnO and its related materials—which have many properties ideal for electronic devices for high power, high frequency, and transparent applicationsReference Frenzel, Lajin, von Wenckstern, Lorenz, Schein, Zhang and Grundmann1, Reference Özgür, Alivov, Liu, Teke, Reshchikov, Dogan, Avrutin, Cho and Morkoc2—have received much attention over the last decades.Reference Reynolds, Litton and Collins3, Reference Meyer, Alves, Hoffmann, Kriegsels, Forster, Bertram, Christen, Hoffmann, Straßburg, Dworzak, Haboeck and Rodina4 Particularly, the need for ultrafast switching transistors creates the basic requirement of investigating point defects,Reference Look, Reynolds, Fang, Hemsky, Sizelove and Jones5 and therewith, the electrical, ambipolar, and excitonic transport properties on a micrometer and nanometer scale have been prevalently investigated in a variety of materials as well as low-dimensional structures.Reference Araújo, Oelgart, Ganière and Reinhart6–Reference Oberhauser, Pantke, Hvam, Weidmann and Klingshirn9 In detail, the impact of interfaces on the device performance, such as field effect transistors (FETs), becomes more and more important as the maximum mobility of charge carriers is limited by a superposition of a variety of scattering mechanisms including scattering at interface roughness. Electrical measurements of electron (e) and hole (h) mobility are well established and give information about the macroscopic, i.e., the spatial integral transport properties of charge carriers. In contrast, the optical characterization, in particular, the highly spatially and spectrally, as well as ps-time-resolved cathodoluminescence (CL) microscopy, advances into micrometer and nanometer scale. Moreover, this technique allows the investigation of the transport properties of excitons, which are noncharged particles.
As the dominant scattering mechanisms at room temperature are phonon assisted, the characterization of interfaces has to be analyzed at low temperatures. In this regime, charge particles are dominantly scattered at ionized impurities.Reference Molnar, Lei and Moustakas10 This necessitates the analysis of the excitonic transport as these noncharged particles should not be scattered at ionized impurities and are sensitive for interface roughnessReference Oberhauser, Pantke, Hvam, Weidmann and Klingshirn9, Reference Hillmer, Hansmann, Forchel, Morohashi, Lopez, Meier and Ploog11, Reference Hillmer, Forchel, Sauer and Tu12 as well as nanoscopic potential fluctuations, fields, and dipoles.
II. EXPERIMENT
As the characteristic temperature dependence of the mobility gives a fingerprint to the underlying scattering mechanisms, one has to determine the free exciton mobility. Therefore, the free exciton diffusion length λFX or diffusivity D FX as well as the initial lifetime τFX as a function of temperature have to be measured. From these parameters, one can define an exciton mobility using the Einstein relation [Eq. (1)].
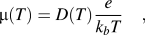
with
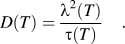
Up to date, two different methods are available for our setup to determine the free exciton transport parameters. These two methods will be discussed in the next paragraphs.
All the CL experiments were performed using a home-built setup based on a modified JEOL 6400 scanning electron microscope (SEM) reaching a time resolution of 35 ps.Reference Oberhauser, Pantke, Hvam, Weidmann and Klingshirn9 In this setup, the luminescence of the sample is collected from the whole sample area and spectrally diffracted in a monochromator to select the free exciton transitions for our transport experiments.
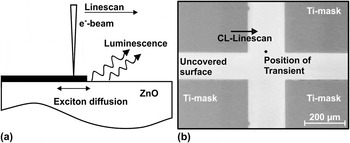
The first method discussed is a combination of cw and pulsed excitation. Two independent measurements are performed. The first is the measurement of the FX diffusion length λFX in cw excitation mode with CL-linescans perpendicular to a Ti-mask edge (Fig. 1). Therefore, the ZnO surface was covered with 156-nm thick rectangular Ti-masks in a lift-off process with an edge length of 520 × 460 μm and a lateral distance of 210 and 160 μm, respectively [Fig. 1(b)]. With a thickness of 156 nm, the Ti is transparent for the primary electrons (V acc = 7 keV leads to z Bethe = 360 nm)Reference Kanaya and Okayama13 but nontransparent for the luminescence coming from the subjacent ZnO. The absorption of light is more than five orders of magnitude in the range of interest (λ is about 370 nm).
(a) Schematic diagram of cw CL-linescans perpendicular to Ti-mask and (b) SEM image of sample structure with positions of CL-transient and cw CL-linescan measurements marked.

This structure allows the independent realization of spatially and spectrally resolved cw CL-linescans perpendicular to the mask’s edge,Reference Zarem, Sercel, Lebens, Eng, Yariv and Vahala14, Reference Tang, Rich, Moy and Cheng15 together with undisturbed time-resolved transient measurements on the unmasked ZnO layer (away from any mask), both on the same sample [Fig. 1(b)]. The transient measurements are performed at the spectral position of the free excitons, and the CL-linescan consists of full spectra for every pixel along the line. The diffusion length of the free excitons is derived from the free exciton CL intensity profile. Only the fraction of excitons generated beneath the Ti-mask contributes to the CL intensity that reaches the uncovered ZnO surface by lateral transport within their diffusion length λFX. The luminescence of excitons recombining below the Ti-mask is blocked, i.e., absorbed by the mask, that leads to a CL-intensity profile perpendicular to the Ti-mask’s edge caused by the diffusion of the excitons. A fit of the one-dimensional diffusion Eq. (3)—that we solved for our geometry under consideration of a Gaussian distributed excitation volume—to the cw CL-linescan of the free exciton luminescence yields the excitonic diffusion length λFX.
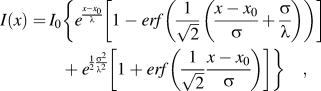
where I 0 is the undisturbed CL-intensity far away from the mask, x 0 is the position of the mask edge, σ is the standard deviation of the excitation volume,Reference Molnar, Lei and Moustakas10 and the diffusion length λ is the only free parameter.
In a second step, the free exciton initial lifetime is determined from ps-time-resolved CL experiments away from any mask but in the surrounding area of the CL-linescan position. The time resolution that is reached with our CL-system is about 35 ps. The electron beam of the SEM is switched on within about 30 ps, stays on for a selected time to reach quasiequilibrium conditions of generation and recombination, and is then extremely quickly switched off by an electrostatic beam blanking unit. The luminescence intensity is recorded as a function of time by a cooled microchannel plate photomultiplier in single photon counting system mode in delayed coincidence.Reference Bertram, Christen, Dadgar and Krost16 The perfectly monoexponential initial decay of the free exciton transient yields the initial lifetime τFX.
A handicap of this technique, particularly for short exciton diffusion lengths, is the requirement of very sharp mask edges. The lower limit of the exciton diffusion length that can be resolved with this technique depends on the quality of the mask edge. Therefore, it has to be much smaller than the expected exciton diffusion length. In our case, it has to be clearly smaller than 100 nm. As the nanostructuring is extremely challenging and the parameters for achieving good quality masks depend on the material that is under study and varies from sample to sample, we decided to apply another setup for our measurements to get a reproducible mask quality and a higher sensitivity on the diffusion length of the excitons. This method is discussed below.
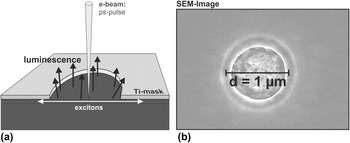
The second method is a time-of-flight technique that we exclusively use the pulsed excitation for. The free exciton initial lifetime τFX(T) has to be measured, too, as it is the case for the prementioned method. To determine the diffusion of the excitons, the surface of the sample is now completely covered by titanium except from circular apertures. These apertures have a diameter that is in the range of the expected exciton diffusion length. The Ti has to absorb all luminescence from the subjacent ZnO, but here, it is not necessary to have the Ti being transparent for the primary electrons. In the center of a hole, excitons are generated by the pulsed electron beam (Fig. 2) to determine the decay time τcirc.
(a) Schematic design of the optical time-of-flight measurement and used mask geometry and (b) SEM top view image of a hole with d = 1 μm in the 160-nm thick Ti-mask.

The initial lifetime τFX and the decay time τcirc are measured under identical conditions, but in the second case, the light is only allowed to couple out from the circular hole with the diameter d. Both measurements are performed at almost the same sample position. As the light is collected from the whole sample, the density of holes is kept sufficiently low to make sure that there is no transfer of excitons from the spot of generation to another hole in the surrounding area within their diffusion length. Due to the superposition of the exciton lifetime τFX and the underdiffusion below the mask with the diffusivity D, the decay time of the CL depends on the hole diameter. The CL in that time of decay is described by a model of the steady-state diffusion equation, which we solved analytically under consideration of a Gaussian distributed excitation volume [Eq. (4)]. The Gaussian distributed excitation volume has been considered as an approximation to account for a spacious excitation of excitons in the material and therefore the initial spatial distribution of excitons.

where c is the exciton concentration proportional to the luminescence intensity,  is the radius of the hole, t time, τQW the initial lifetime that is known from time-resolved measurements, n is the exciton concentration distribution under equilibrium excitation condition as a function of position within the hole area [Eq. (5)],
 the position on the radius of the hole, and D the diffusion constant. As given parameters for this model, we have the previously measured exciton initial lifetime τFX and the hole radius r. The only free parameter in this model is the diffusion constant D.
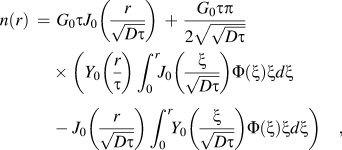
where the functions Y 0 and J 0 are Bessel functions, Φ is the density of the two dimensional normal distribution, and G 0 is the equilibrium excitation rate.
III. DISCUSSION
A. Excitonic transport in bulk ZnO
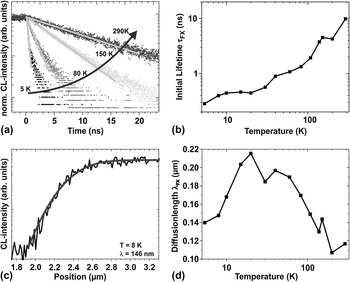
The bulk ZnO sample under study has been excited by electrons with a kinetic energy of 7 keV. For different temperatures, Cl-linescans were recorded and the transport equation [Eq. (3)] was fitted to the free exciton CL-intensity profiles. For the free excitons, the diffusion length increases with increasing temperature from λFX(5 K) = 140 nm and reaches its maximum at λFX(20 K) = 220 nm. With further increase of the temperature, the diffusion length almost monotonously decreases to about λFX(300 K) = 110 nm [Fig. 3(d)]. In this short diffusion length regime, these values have an error of about 9%. From the time-resolved measurements, we found that with increasing temperature, the decay becomes slower, which results in a monotonously increasing free exciton initial lifetime. It ranges from about τFX(5 K) = 0.3 ns and increases over more than one order of magnitude to τFX(300 K) = 10 ns. As our time resolution is about 30 ps as has been mentioned above, the error can be neglected.
(a) Initial decay of transients for different sample temperatures, (b) temperature-dependent free exciton initial lifetime, (c) FX CL-intensity from CL-linescan at the mask edge with fitted line giving a free exciton diffusion length of about 146 nm, and (d) free exciton diffusion length λFX as function of temperature.

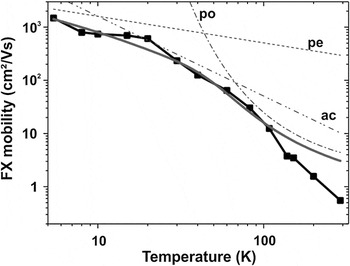
This leads to a monotonously increasing free exciton mobility defined by using the Einstein relation [Eq. (1)]. It starts at μFX(300 K) = 0.55 cm2/Vs and reaches μFX(5 K) = 1480 cm2/Vs as it is shown in Fig. 4. As has been discussed earlier in this manuscript, the characteristic temperature dependence of the mobility gives information about the underlying dominant scattering mechanisms.Reference Boer17
Free exciton mobility—defined with the Einstein relation—as function of the sample temperature (dots) and characteristic mobility for scattering via acoustic phonons in piezoelectric materials (μ ∼ T −1/2), deformation potential (μ ∼ T –3/2), and Fröhlich interaction (μ ∼ e −1/T). Denotations: po: polar optical scattering (Fröhlich interaction), pe: scattering via acoustic phonons in a piezoelectric crystal, ac: deformation potential scattering.

For our sample, the dominant scattering mechanisms found are at temperatures below T = 20 K the scattering via acoustic phonons in the piezoelectric ZnO material, which is characterized by μ ∼ T −1/2. So this scattering mechanism limits the maximum free exciton mobility. With increasing temperature, the scattering via deformation potential (μ ∼ T −3/2) and, for high temperatures, the Fröhlich interaction (μ ∼ e −1/T) might become the dominant scattering mechanisms. As expected, a drop of mobility at low temperatures, which is typical for charge carriers and is caused by scattering with ionized impurities, is not observable for the analyzed electrically neutral excitons.
B. Excitonic transport in MgZnO/ZnO quantum well
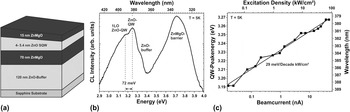
In expectation of longer diffusion lengths, we analyzed a wedge-shaped MgZnO/ZnO quantum well (QW) that was grown by pulsed laser deposition on top of an a-plane sapphire substrate and a ZnO buffer layer with a QW width of 4–5.4 nm [Fig. 5(a)].Reference Brandt, Lange, Stölzel, Müller, Brenndorf, Zippel, Lenzner, Lorenz and Grundmann18 The Ti-mask was realized with applicable hole quality and diameter in the area of 4.5-nm QW thickness allowing both the undisturbed transient measurement as well as transient measurements in the mask aperture. The CL of excitons in the QW is—under the used excitation conditions (P = 0.9 kW/cm2) and a QW width position of about 4.5 nm—centered at about E QW = 3.24 eV at T = 5 K [Fig. 5(b)]. The red-shifted luminescence in comparison to the free exciton transition in bulk ZnO is caused by the presence of the quantum-confined Stark effect (QCSE).Reference Brandt, Lange, Stölzel, Müller, Brenndorf, Zippel, Lenzner, Lorenz and Grundmann18 With increasing excitation density, the QW emission shifts to higher energies with ΔE = 29 meV/decade kW/cm2 as it is visualized in Fig. 5(c) and caused by a reduction of the QCSE due to an increased excess carrier concentration that screens the internal field.
(a) Sample setup, (b) CL spectrum at T = 5 K and P = 0.9 kW/cm2. The QW emission is centered at EQW = 3.24 eV. (c) QW peak energy as a function of excitation density. The QW-luminescence redshifts with 29 meV/decade kW/cm2 with increasing excitation density.

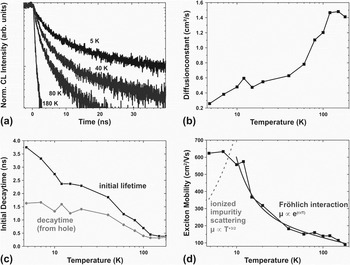
The exciton initial lifetime τFX was measured and derived from initial decay of the luminescence [Fig. 6(a)]. With decreasing temperature, the exponential fits provide a monotonously increasing initial lifetime over about starting at about one order of magnitude starting at 380 ps at 180 K and ranging to about 3.75 ns at 5 K [Fig. 6(b)]. The enhanced lifetime at low temperatures could be explained by the presence of the QCSE due to a reduction of the transition probability. The decreasing lifetime for increasing temperature is caused by nonradiative recombination accompanied by a screening of the internal electric fields due to ionization of donors inside the QW and barrier material, consequently reducing the QCSE.
(a) Decay of the transients from the unmasked sample surface for different temperatures (5–180 K), (b) excitonic diffusion constant D(T), (c) comparison of the excitonic initial lifetime τFX(T) and the initial decay time τcirc(T) derived from a hole of d = 1.45 μm, and (d) from D(T) derived excitonic mobility μ(T). At low temperatures, there is no drop of mobility but a mobility plateau, which could be explained with smooth interfaces.Reference Hillmer, Forchel, Sauer and Tu12 At higher temperatures, the Fröhlich interaction becomes the dominant scattering mechanism.

The value of the decay time τcirc is, as expected, always below the value of τFX as can be seen in Fig. 6(b). This can be explained by the underdiffusion of excitons from the hole area below the nontransparent titanium.
The diffusion constant is derived using Eq. (4) and the given parameters of the excitonic initial lifetime τFX(T) and the hole diameter of d = 1.45 μm with an error of about +8%/−4%. It increases from D FX(5 K) = 0.25 cm2/s to D FX(180 K) = 1.4 cm2/s [Fig. 6(c)]. This leads to an exciton diffusion length of λFX (5 K) = 310 nm and λFX (180 K) = 230 nm and an exciton mobility that has a plateau around μFX = 600 cm2/Vs at low temperatures (5–12 K), which could be explained with smooth interfaces.Reference Hillmer, Forchel, Sauer and Tu12 This explanation is in good agreement with the presence of the QCSE in the ZnO QW structure, which would not be the case, if the interfaces were rough. At higher temperatures, the exciton mobility decreases following μ ∼ e −1/T, which is related to scattering via Fröhlich interaction. The low temperature drop of mobility caused by scattering at ionized impurities [following μ ∼ T −1 in a QW—see dashed line in Fig. 6(d)] is not observable for the investigated electrically neutral excitons in the ZnO QW structure.
C. Comparison of the results
On both samples and with both methods, we found that the ionized impurity scattering is completely missing for the electrically neutral excitons, as was expected. At high temperatures, the Fröhlich interaction becomes the dominant scattering mechanism for the excitons in the bulk ZnO as well as in the QW structure.
At low temperatures, the dominating scattering mechanisms in the bulk single crystal are the deformation potential scattering and the acoustic phonon scattering with piezoelectric attendance. The exciton mobility in the ZnO QW is limited by scattering processes that could be explained by interface roughness. This is characterized by an almost constant value of μFX in the low temperature range (here: about μFX = 600 cm2/Vs). This behavior of the low temperature mobility of excitons in QWs could be connected to relatively smooth interfacesReference Tang, Rich, Moy and Cheng15 and is in good agreement to the presence of the QCSE in this sample.
IV. CONCLUSION
We showed the functionality of two different methods for measuring the transport of excitons by highly spatially, spectrally, and ps-time-resolved CL in a bulk ZnO crystal and a MgZnO/ZnO QW showing the QCSE. The first method is based on cw CL-linescans for determining the exciton diffusion length and pulsed excitation for determining the exciton lifetime. The other method, which is a time-of-flight technique, uses pulsed excitation. With this method, the diffusion constant is determined.
A. ZnO single crystal
With increasing temperature, the measured free exciton initial lifetime increases monotonously. It starts at about τFX(5 K) = 0.3 ns and increases over more than one order of magnitude to τFX(300 K) = 10 ns. The fits of our solution of the transport equation to the FX CL-intensity profiles of the CL-linescans lead to a free exciton diffusion length that ranges from λFX(5 K) = 140 nm reaching its maximum at λFX(20 K) = 220 nm and λFX(300 K) = 110 nm. This leads to a monotonously increasing FX mobility with decreasing temperature from μFX(300 K) = 0.55 cm2/Vs to μFX(5 K) = 1480 cm²/Vs.
B. MgZnO/ZnO QW
The exciton initial lifetime increases with decreasing temperature from τFX(180 K) = 380 ps over about one order of magnitude to about τFX(5 K) = 3.75 ns. This enhanced lifetime at low temperatures can be explained by the presence of the QCSE, which reduces the transition probability, while the decreasing lifetime with increasing temperature is caused by nonradiative recombination as well as screening of the internal electric fields due to the ionization of donors inside the QW and barrier material, which reduces the QCSE. The time-of-flight technique used for this sample directly gives us the diffusivity of the excitons from fits of our transport model to the decay of the FX CL-intensity of the recorded transients in an aperture in the Ti-mask. These fits provide an almost monotonously increasing diffusivity with increasing temperature, ranging from D FX(5 K) = 0.25 cm2/s to D FX(180 K) = 1.4 cm2/s. This results in an almost constant value of the exciton mobility of μFX = 600 cm2/Vs from 5 to 12 K and a decreasing mobility following μ ∼ e −1/T with further increasing the temperature.
ACKNOWLEDGMENTS
The authors would like to thank the German Research Foundation DFG for the financial support within the Collaborative Research Center 762 “Functionality of Oxide Interfaces.” As well, the authors are grateful to Anatol Lochmann and Professor Dieter Bimberg from the Technical University Berlin for the lift-off processing.