Introduction
The Amazon rainforest represents one of Earth’s most sociobiodiverse terrestrial and freshwater ecosystems, hosting a vast array of species across multiple taxa, including plants, animals, fungi, and microorganisms (Duarte Ritter et al. Reference Duarte Ritter, Faurby, Bennett, Naka, Ter Steege, Zizka and Antonelli2019, Tedersoo et al. Reference Tedersoo, Mikryukov, Zizka, Bahram, Hagh-Doust, Anslan and Abarenkov2022, Guayasamin et al. Reference Guayasamin, Ribas, Carnaval, Carrillo, Hoorn and Lohmann2024), as well as significant numbers of indigenous groups and traditional communities, thus forming a hotspot of biocultural and historical diversity (Heckenberger et al. Reference Heckenberger, Russell, Toney and Schmidt2007). Among its unique ecosystems, the várzea seasonally-flooded forests, which are shaped by the flood pulse of nutrient-rich white-water rivers, exemplify this richness and ecological complexity (Junk et al. Reference Junk, Piedade, Wittmann, Schöngart and Parolin2010). Driven by the South American Monsoon System, these flood pulses regulate seasonal water and sediment discharge, giving rise to the world’s largest seasonally-flooded forest ecosystems (Junk et al. Reference Junk, Bayley and Sparks1989; Marengo et al. Reference Marengo, Liebmann, Grimm, Misra, Silva Dias, Cavalcanti and Alves2010). In the Amazon’s main stem these flood pulses can form an extensive area that is rich in sediments and nutrients (Hess et al. Reference Hess, Melack, Affonso, Barbosa, Gastil-Buhl and Novo2015), fostering diverse plant communities that thrive along a gradient of flood depth. This inundation gradient is typically found along river margins, as well as around lakes, channels and levées (Junk et al. Reference Junk, Piedade, Schöngart and Wittmann2012). The nutrient cycling in várzea, driven by seasonal flooding, enhances soil fertility and sustains high productivity and species diversity (Junk et al. Reference Junk, Piedade, Schöngart and Wittmann2012). These dynamic environments support a diverse array of species adapted to fluctuating water levels, fostering intricate interspecies relationships (Junk and Wantzen Reference Junk, Wantzen, Batzer and Sharitz2006). This biodiversity not only enhances the resilience of the ecosystem but also provides essential services, such as carbon storage, water purification and water cycling, underscoring the critical importance of preserving these complex habitats in the face of mounting environmental threats (Strand et al. Reference Strand, Soares-Filho, Costa, Oliveira, Ribeiro and Pires2018, Duarte Ritter et al. Reference Duarte Ritter, Muñoz, Fabrício Machado, Albert, Ribas, Carnaval and Guayasamin2025).
The annual advance and retreat of river waters over the floodplain ensures large lateral exchanges of organic and inorganic materials between river channels and floodplains, enhancing primary production (Melack and Forsberg Reference Melack, Forsberg, McClain, Victoria and Richey2001). This process ensures that many species benefit from the flood pulse, often via two main types of migrations. These include lateral migrations, which connect habitats as individuals move from the main river channel to nearby lakes and seasonally flooded areas (Davenport et al. Reference Davenport, Nole Bazán and Carlos Erazo2012; Costa et al. Reference Costa, Peres and Abrahams2018; Osorio et al. Reference Osorio, Terborgh, Alvarez, Ortega, Quispe, Chipollini and Davenport2011), and continental-scale migrations, characterised by extensive longitudinal movements (Viana et al. Reference Viana, Santamaría and Figuerola2016). Seasonally flooded areas play a crucial role in both types of migrations, serving as vital refuges that provide shelter and abundant resources for species, including migratory birds during their seasonal journeys (Castello Reference Castello2021; Castello et al. Reference Castello and Macedo2016).
One of these migratory species is the Orinoco Goose Neochen jubata (Spix Reference von1825). This species, and other migratory birds, can make major contributions to resource fluxes, biomass transfer, nutrient transport, predator-prey interactions, and food-web structure within and among ecosystems, playing an important role in ecosystem dynamics and human culture (Wilcove Reference Wilcove2010; Runge et al. Reference Runge, Watson, Butchart, Hanson, Possingham and Fuller2015). In addition, migratory birds can promote large-scale connectivity in anthropogenic (e.g. forest-pasture mosaics) and naturally isolated landscapes, such as lakes and floodplains, as well as the colonisation of distant habitat patches (Viana et al. Reference Viana, Santamaría and Figuerola2016).
The Orinoco Goose is found across a broad region of South America, ranging from Venezuela and the Guianas to Bolivia, Paraguay, Argentina, and Brazil (Davenport et al. Reference Davenport, Endo, Kriese and Schulenberg2013). This species is a poorly understood South American sheldgoose, whose distribution and global population are declining (Endo et al. Reference Endo, Haugaasen and Peres2014). It is classified as Least Concern on the IUCN Red List (BirdLife International 2025) due to its decreasing population, estimated at 15,000–40,000 individuals, which is primarily driven by overhunting and habitat loss (Endo et al. Reference Endo, Haugaasen and Peres2014; Tubelis et al. Reference Tubelis, Mendonça, Vieira and Borges2020). The Orinoco Goose is considered a species of special concern and a research priority in South America (Carboneras et al. Reference Carboneras, Kirwan, Sharpe, del Hoyo, Elliott, Sargatal, Christie and de Juana2019). Within the Amazon River basin, it is one of the most threatened waterbird species, found at low densities along the Amazon and Orinoco river basins (Davenport et al. Reference Davenport, Nole Bazán and Carlos Erazo2012). As a terrestrial grazer, the species is typically associated with areas that provide easy access to freshwater, such as wet savannas and the margins of large freshwater wetlands. Its habitat includes lakes, rivers, seasonally flooded savannas, and wetlands (Sick Reference Sick1997; Carboneras et al. Reference Carboneras, Kirwan, Sharpe, del Hoyo, Elliott, Sargatal, Christie and de Juana2019).
During the dry season, the Orinoco Goose exhibits a distinct pattern of habitat use, relying primarily on fluvial beaches for feeding rather than nesting, as it is an obligate cavity nester (Endo et al. Reference Endo, Haugaasen and Peres2014). Along the Juruá River, a major tributary of Amazon River, beaches located exclusively within protected areas support significantly higher abundances of this species, 7.6 times greater than unprotected sites, making protected area status the strongest predictor of its occurrence, followed by distances to the nearest town (Campos-Silva et al. Reference Campos-Silva, Hawes, Andrade and Peres2018).
Here, we investigate the dry-season home range and habitat selection of Orinoco Goose in the mid-section of the Juruá River in the western Brazilian Amazon, focusing on an area that is critical for its reproduction. We first assessed local perceptions of population trends along approximately 2,500 km of the Juruá River, which indicated a perceived recovery of the species within protected areas. These population-level patterns provided the ecological context for our movement analyses and were used to strategically select GPS-telemetry sites located in areas where population recovery was most evident. By linking perceived population recovery with fine-scale movement data, we were able to examine how space use and habitat selection within protected areas may underpin favorable population trends. Guided by this integrated approach, we deployed GPS tags on four adult individuals (two males and two females) within protected areas where the species was most abundant. Collectively, our results connect population trends with individual movement behavior, providing insights into home-range size, habitat use, and resource selection, and highlighting the central role of riverine environments within protected landscapes for the conservation of Orinoco Goose in the Amazon.
Methods
Study area
This study was conducted along the middle Juruá River, western Brazilian Amazon (5°34′39″S, 67°37′11″W), between the municipalities of Carauari and Itamarati and spanned a survey area along 2,500 km of a highly productive major tributary of the Amazon River. The landscape of the Juruá River is characterised by both seasonally flooded nutrient-rich white-water forests (várzea) and unflooded forests (terra firme) (Hawes et al. Reference Hawes, Peres, Riley and Hess2012). The dry and high-water seasons correspond to periods of low (August – November) and elevated water levels (January – June), which strongly impact biodiversity (Hawes and Peres Reference Hawes and Peres2016; Costa et al. Reference Costa, Peres and Abrahams2018) and local livelihoods (Endo et al. Reference Endo, Peres and Haugaasen2016). During the dry season, sandy beaches form along large sections of the main river channel, creating suitable nesting habitats for migratory waterbirds and Amazonian river turtles Podocnemis spp. (Campos-Silva et al. Reference Campos-Silva, Hawes, Andrade and Peres2018). The study area also hosts three major sustainable-use protected areas: the Médio Juruá Extractive Reserve (RESEX Médio Juruá), Baixo Juruá Extractive Reserve (RESEX Baixo Juruá) and the state-managed Uacari Sustainable Development Reserve (RDS Uacari). There is also an Indigenous Land designated to protect the Deni people. These formal protected areas play a crucial role in protecting biodiversity and supporting local livelihoods (Figure 1).
(A) Spatial distribution of experienced hunters’ perceptions of Orinoco Goose population trends across riverine communities along the Juruá River. Coloured dots represent responses from each community, ranging from red (decreased a lot) to dark green (increased a lot). Polygons delineate the protected areas assessed: RESEX Baixo Juruá, RESEX Médio Juruá, RDS Uacari, and Deni Indigenous Land. (B) Flow of local perceptions regarding population trends of the Orinoco Goose (Neochen jubata) along 2,500 km of the Juruá River, Amazonas, Brazil. The Sankey diagram illustrates the relationship between area categories (RESEX Baixo Juruá, RESEX Médio Juruá, RDS Uacari, Deni Indigenous Land, and areas outside protection) and perceived population changes over the past 20 years, classified into five levels: decreased a lot, decreased, remained the same, increased, and increased a lot.

Figure 1. Long description
Panel a is a geographical map of the Juruá River in Amazonas, Brazil. An inset map of South America shows the study location in the Northwest. The main map displays colored dots along the river path representing hunter perceptions. In the Northeast is R E S E X Baixo Juruá with mostly yellow and orange dots. Moving Southwest, R E S E X Médio Juruá and R D S Uacari contain a high density of light and dark green dots. To the South, I L Deni is marked with a dotted pattern. A legend in the bottom right corner defines the scale: red for decreased a lot, orange for decreased, yellow for remained the same, light green for increased, and dark green for increased a lot.
Panel b is a Sankey diagram. The left side lists five area categories from top to bottom: R E S E X Baixo Juruá, outside, Deni, R D S Uacari, and R E S E X Médio Juruá. The right side lists five perception levels from top to bottom: decreased a lot, decreased, remained the same, increased, and increased a lot. Thick gray flow lines connect the areas to the perceptions. The ‘outside’ category has the largest flow toward ‘remained the same’ and ‘decreased’. R D S Uacari and R E S E X Médio Juruá show significant flows toward ‘increased’ and ‘increased a lot’.
Data collection and sampling design
To assess population trends of the Orinoco Goose, we conducted semi-structured questionnaires with experienced hunters from riverine communities along 2,500 km of the Juruá River. Interviews were designed to capture Local Ecological Knowledge (LEK) regarding perceived changes in species abundance over the past 20 years.
The use of LEK has been applied across a wide range of ecological studies and has proven to be a highly effective, accurate, and important tool, particularly in contexts where long-term monitoring data are scarce (Campos-Silva et al. Reference Campos-Silva, Hawes, Andrade and Peres2018; da Silva Lima et al. Reference da Silva Lima, Junqueira, de Oliveira, Mazzochini, de Oliveira Santos, de Oliveira Estevo and Campos-Silva2025). Through long-standing, close relationships with their environments, Indigenous Peoples and local communities have accumulated deep knowledge of the ecological roles of birds, as well as their cultural and spiritual importance (Anderson Reference Anderson2017; Ibarra et al. Reference Ibarra, Caviedes and Benavides2020; Villar et al. Reference Villar, Thomsen, Paca-Condori, Gutiérrez Tito, Velásquez-Noriega, Mamani, Arivilca Vilca, Moreno Terrazas, Marino and Gosler2024).
Respondents were asked to evaluate population trends using a five-point Likert-type scale, ranging from “decreased a lot” to “increased a lot”. The responses were georeferenced to the respective communities where interviews were conducted across the study area. This approach provided a broad-scale understanding of local perceptions of population recovery and decline, which informed the subsequent selection of sites for telemetry-based movement ecology analyses.
We tracked four GPS-tagged adult individuals, two males Josias (5°31′07″S, 67°29′38″W) and Chom (5°25′30″S, 67°17′12″W) and two females Caracal (5°35′06″S, 67°42′04″W) and Ellen (5°28′26″S, 67°27′41″W), each from different family groups and captured while accompanying their broods during the dry season. All captures occurred shortly after the reproduction period, when family groups remain closely associated with river margins and fluvial beaches. The individuals were monitored during the dry season in 2012 and 2015. Caracal and Chom were tracked in 2012, with monitoring periods from September 12 to October 31, 2012, and September 5 to October 5, 2012, respectively. In 2015, Ellen and Josias were tracked from September 22 to October 14, 2015, and September 24 to October 16, 2015, respectively.
We captured adult birds at night with the assistance of experienced local fishers utilising throw nets. After spotting the individuals on Juruá fluvial sand-beaches, we used a strong headlamp to disorient and nearly blind the birds during moonless nights. The individuals were approached and hand-captured together in fishing throw nets with adults subsequently weighed, measured, and tagged, while young birds were simply held safely for later release with the entire family (under permits A081-10-03 and Duke University IACUC Protocol A125-13-05). Transmitters were attached using a Teflon ribbon backpack harness following a knotting protocol as described in Davenport et al. Reference Davenport, Nole Bazán and Carlos Erazo2012. The transmitters used were Microwave Telemetry, Inc. 30g solar GPS/ARGOS PTTs, and were programmed with a 2-h duty cycle. Data was uploaded to Movebank as live feeds and cleaned by manually removing duplicate timestamps and obvious outliers.
Data analysis
We used the CTMM Web-App, version 0.2.11, provided by the authors (Calabrese et al. Reference Calabrese, Fleming and Gurarie2016) built within the R v.4.3.1 (RStudio Team 2023) to analyse the home range of four individuals. To estimate overall home range size of the individuals monitored, we used the autocorrelated kernel density estimator (AKDE), selecting the model within the CTMM program, which ensured more accurate home range estimation for tracking data that is correlated in both space and time (Fleming et al. Reference Fleming, Fagan, Mueller, Olson, Leimgruber and Calabrese2015). We first examined the empirical semi-variogram for each individual, plotting the semi-variance in relocations as a function of the time lag between observations (Fleming et al. Reference Fleming, Calabrese, Mueller, Olson, Leimgruber and Fagan2014). This involved calculating the distance between all pairs of relocations and then computing the variability of those distances that shared the same time lag (Costa et al. Reference Costa, Storck‐Tonon, dos Santos‐Filho, da Silva, Campos‐Silva and Peres2023). Next, using the program CTMM Web-App, we analysed the following described home range models: (IID) independent identically distributed process, which features a home range positional autocorrelation; (OU) Ornstein-Uhlenbeck process that features the autocorrelated positions described by two parameters; and (OUF), which features both the positional and velocity autocorrelation that are described by three parameters (Fleming et al. Reference Fleming, Calabrese, Mueller, Olson, Leimgruber and Fagan2014; Costa et al. Reference Costa, Storck‐Tonon, dos Santos‐Filho, da Silva, Campos‐Silva and Peres2023). Once the models were ranked based on their AICc values (Burnham and Anderson Reference Burnham and Anderson2002), we selected the most parsimonious one to estimate home range size, using the autocorrelated kernel density estimator (Supplementary materials Figures S1 and S2).
We imported raster-based land cover data into R from Hess et al. (Reference Hess, Melack, Affonso, Barbosa, Gastil-Buhl and Novo2015), which provides detailed classifications of vegetation and land use across the Amazon Basin during the dry season (Figure 2). However, to enable ecological interpretation and simplify the modeling process, we grouped the original Hess raster classes into four broader habitat categories used in this study: river, beach, forest, and flooded forest. These broader categories were defined by aggregating multiple raster classes based on ecological similarity (Supplementary materials Table S1). For instance, the river category includes both “open water” and “aquatic macrophyte (flooded herbaceous)” classes from Hess et al. while beach includes “non-flooded bare soil or herbaceous” and “non-flooded shrub”. This classification scheme was used consistently throughout all habitat selection and spatial analyses in the manuscript. Given the limited spatial resolution of the raster and the ecology of the species, we note that some GPS locations classified as ‘river’ may correspond to marginal zones adjacent to water or individuals in flight over the channel, rather than active use of open water surfaces. Thus, we interpret this category as a proxy for riverine use of space rather than aquatic habitat use per se.
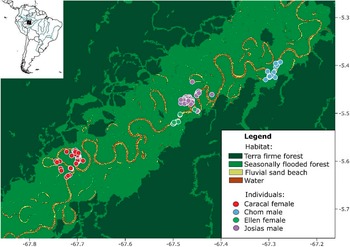
Map of the study area showing the land cover classes and GPS fixes from four Orinoco Goose (Neochen jubata) during the dry season along the Juruá River, Brazilian Amazon.
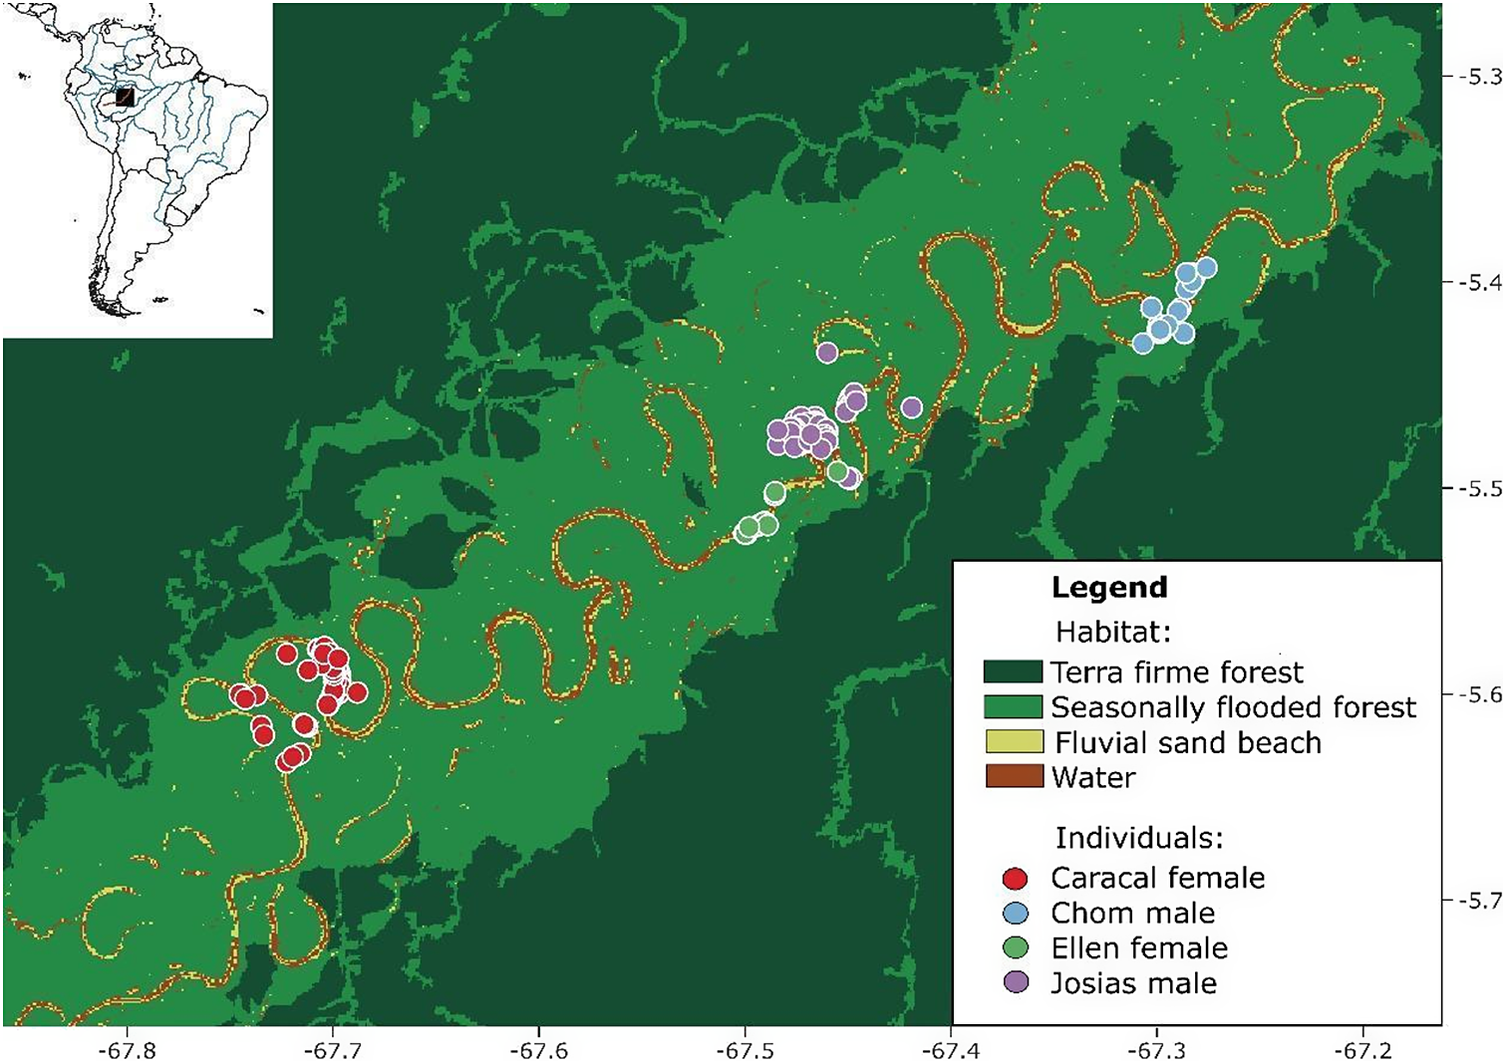
Figure 2. Long description
A multi-panel map featuring a small inset of South America in the top-left corner with a black square highlighting the study area in the Brazilian Amazon. The main map uses a coordinate system with Latitude on the right Y-axis from negative 5.3 to negative 5.7 and Longitude on the bottom X-axis from negative 67.8 to negative 67.2.
Land cover is categorized into four types:
- Terra firme forest in dark green, forming the outer perimeter.
- Seasonally flooded forest in light green, following the central river corridor.
- Fluvial sand beach in yellow, lining the riverbanks.
- Water in brown, representing the winding Juruá River.
G P S fixes for four individuals are clustered along the river from Southwest to Northeast:
- Caracal female: Red dots clustered in the Southwest near negative 67.75 longitude.
- Ellen female: Green dots located in the center-South near negative 67.5 longitude.
- Josias male: Purple dots clustered slightly North of Ellen near negative 67.45 longitude.
- Chom male: Blue dots clustered in the Northeast near negative 67.3 longitude.
All G P S points are concentrated within the seasonally flooded forest and fluvial sand beach habitats along the river’s meanders.
For raster data we used the “raster” package version 3.6-20 (Hijmans Reference Hijmans2023) and for point data we used the “rgdal” package version 1.6-7 (Bivand Reference Bivand, Keitt and Rowlingson2023). We assessed habitat selection using a Resource Selection Function (RSF) approach (Boyce et al. Reference Boyce, Vernier, Nielsen and Schmiegelow2002; Manly et al. Reference Manly, McDonald, Thomas, McDonald and Erickson2002), following the methodology of Jesmer et al. Reference Jesmer, Merkle, Goheen, Aikens, Beck, Courtemanch, Hurley, McWhirter, Miyasaki, Monteith and Kauffman2018 and Reference Jesmer, Kauffman, Courtemanch, Kilpatrick, Thomas, Yost, Monteith and Goheen2021, but applied at the individual (third-order) level. The two-month tracking period per individual is best suited to the home-range scale, where habitat selection typically occurs over intermediate timeframes such as hours to months (Gaillard et al. Reference Gaillard, Hebblewhite, Loison, Fuller, Powell, Basille and Van Moorter2010). For each individual, we generated 100 random points within its home range. We used a binomial Generalised Linear Model (GLM) to estimate selection probability, assigning a weight of 1 to used points and 1,000 to available points. This weighting approach serves as a practical approximation of the inhomogeneous Poisson point process (IPP) model within a logistic regression framework (Muff et al. Reference Muff, Signer and Fieberg2020). This approach aligns with best practices to enhance the interpretability of selection coefficients derived from logistic regression. We plotted the estimated coefficients to better analyse the effects. The analysis considers whether the coefficient estimates and their confidence intervals cross zero (indicating non-effect), as well as the P values associated with the logistic regression estimates.
We assessed the predictive accuracy of individual third-order RSF models through k-fold cross-validation (3 folds, 100 repeats) using kfoldRSF with the IndRSA package v.0.0.0.9000 (Bastille-Rousseau and Wittemyer Reference Bastille-Rousseau and Wittemyer2019). We fitted unweighted logistic models with standardised covariates and calculated k-fold score means and standard deviations for used and available locations (Boyce et al. Reference Boyce, Vernier, Nielsen and Schmiegelow2002). To further explore individual variation in habitat selection, we examined the functional response by evaluating the relationship between habitat availability and selection coefficients. Additionally, we estimated the relative selection strength (log-RSS) for riverine habitat by plotting the spatial data in relation to flooded forest habitats, thereby quantifying habitat selection intensity for rivers across individuals. RSS measures how strongly animals selected a given habitat condition (e.g., proximity to river) relative to a reference condition (i.e. the mean values of all covariates), based on differences in habitat values, making it a useful indicator of effect size.
Results
Population trends
A total of 73 hunters from 73 riverine communities across a nonlinear distance of 2,500 km along the Juruá River provided perceptions of Orinoco Goose population trends over the past two decades (Figure 1a). Responses revealed contrasting patterns between protected and unprotected areas. In unprotected sites (n = 39 respondents; 39 communities), reports were predominantly of populations remaining stable (38.5%) or slightly increasing (33.3%), while 28.2% of respondents indicated declines. In contrast, within protected areas (PAs), positive trends were markedly higher. In the RDS Uacari (n = 20; 20 communities), 95% of respondents reported population increases, with 20% describing the increases a lot, and only one respondent (5%) perceived stability. Similarly, in the Resex Médio Juruá (n = 7; 7 communities), 100% of hunters perceived population growth, of which 43% reported that the species increases a lot. In the Resex Baixo Juruá (n = 4; 4 communities), responses were more heterogeneous, with 25% reporting stability, 25% decreases a lot, and 50% decreases. Finally, in the Terra Indígena Deni (n = 3; 3 communities), perceptions were of stable populations (Figure 1b). Overall, the proportion of respondents perceiving population increases was significantly higher in PAs (88.9%) compared to unprotected sites (33.3%), while perceptions of declines were nearly absent in PAs (3.7%) but reached 28.2% in unprotected areas, reinforcing the conclusion that protected territories are strongly associated with Orinoco Goose population recovery.
Movement ecology and resource selection
Among the four individuals studied, the female Caracal was tracked for 50 days, during which 387 GPS location points were recorded. Female Ellen was monitored for 23 days, providing 301 location points. Male Chom had a tracking duration of 30 days, yielding 233 location points. In contrast, male Josias was tracked for 23 days but had only 25 recorded location points (Figure 2). Notably, Ellen exhibited the largest home range size at 8.81 km², followed by Josias at 6.62 km². Caracal and Chom had smaller home ranges of 4.64 km² and 2.34 km², respectively (Figure 3). Ellen’s home range was approximately twice as large in both dimensions compared to the other individuals. Further analysis revealed that the presence points of each individual did not overlap with those of others, regardless of sex.
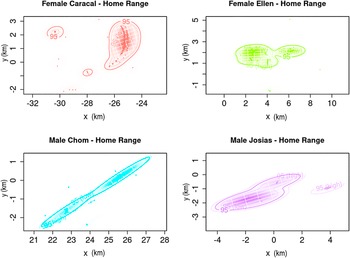
Kernel density home range estimates for each of two focal adult males and two adult females along the Juruá River based on telemetry geolocations.
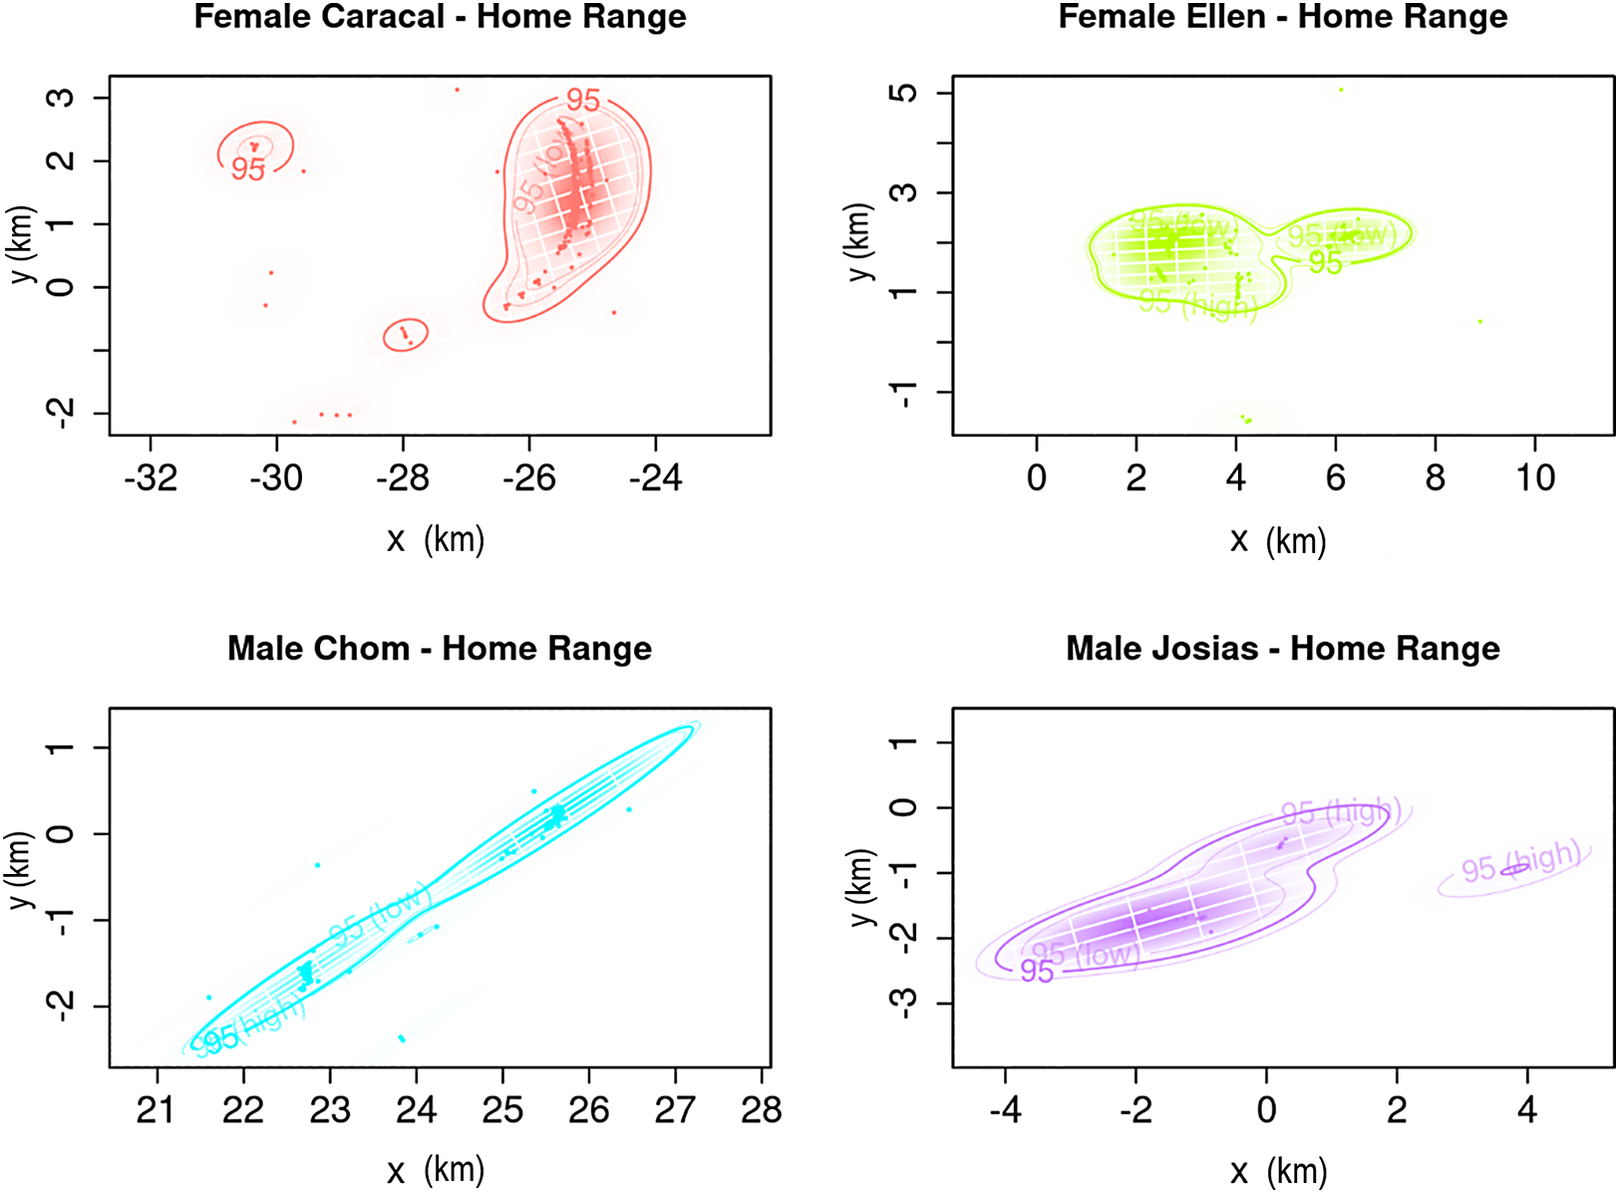
Figure 3. Long description
Four scatter plots show telemetry geolocations and home range estimates. All axes are labeled x k m and y k m.
* Top-left panel: Female Caracal. X-axis ranges from -32 to -24. Y-axis ranges from -2 to 3. Red data points and contours show a primary high-density cluster around x equals -25 and y equals 1.5, with smaller isolated 95 percent contours at x equals -31 and x equals -28.
* Top-right panel: Female Ellen. X-axis ranges from 0 to 10. Y-axis ranges from -1 to 5. Green data points and contours show a large horizontal cluster between x equals 1 and 5, y equals 2, and a smaller secondary cluster at x equals 6.5, y equals 2.
* Bottom-left panel: Male Chom. X-axis ranges from 21 to 28. Y-axis ranges from -2 to 1. Cyan data points and contours show a narrow, linear diagonal home range extending from bottom-left to top-right, with high-density clusters at x equals 22.5 and x equals 25.5.
* Bottom-right panel: Male Josias. X-axis ranges from -4 to 4. Y-axis ranges from -3 to 1. Purple data points and contours show an elongated cluster from x equals -3 to 1, y equals -2 to 0, and a small isolated 95 percent high contour at x equals 3.5, y equals -1.
The third-order Resource Selection model showed a stronger selection for river margin and fluvial beach environments, as indicated below by highly significant p-values, while forest habitats showed lower significance levels across all individuals. Chom and Caracal, both captured in 2012, strongly selected river (P < 0.001) and beach habitats (P < 0.001), and avoided seasonally flooded forest (P < 0.001). In 2015, a year coinciding with an extreme flood event, when beaches became more restricted even during the dry season, Ellen and Josias showed a selection for river (P < 0.001) and avoided fluvial beaches (P < 0.001). For seasonally flooded forest, avoidance was not significant for Ellen (P = 0.069), but significant for Josias (P = 0.003; Figure 4).
Estimated individual and population-level coefficients for distance to fluvial sand beach, distance to flooded forest, and distance to river (top), along with the relationship between individual selection coefficients and the mean availability of each habitat feature (bottom). In the top panel, solid dots represent RSF-estimated coefficients for each individual and the population, with error bars indicating associated uncertainty. Greater variability in selection for beach habitats suggests more pronounced individual differences, while selection for flooded forest shows coefficients near zero, indicating no clear preference. In the bottom panel, each point represents an individual’s selection coefficient plotted against the average availability of that habitat feature. The dashed black lines indicate overall trends across individuals. These functional response plots highlight individual variation in habitat selection, particularly for beach and riverine habitats.

Figure 4. Long description
The top panel is a dot plot with error bars showing Estimate on the y-axis from minus 5 to 0. The x-axis has three categories. Distance to fluvial sand beach shows high variability with points ranging from minus 4.5 to plus 2. Distance to flooded forest shows a tight cluster near zero. Distance to river shows points ranging from minus 5 to 0.
The bottom panel contains three scatter plots with dashed trend lines and gray shaded confidence intervals.
1. Distance to fluvial sand beach. Availability ranges from 0.78 to 0.81. Selection coefficient ranges from minus 10 to 10. The trend line shows a slight positive slope.
2. Distance to flooded forest. Availability ranges from 0.64 to 0.72. Selection coefficient ranges from minus 2 to 3. The trend line shows a positive slope.
3. Distance to river. Availability ranges from 0.72 to 0.76. Selection coefficient ranges from minus 10 to 5. The trend line is nearly flat.
A legend at the bottom identifies individuals by color. Red is Female Caracal. Green is Female Ellen. Blue is Male Chom. Purple is Male Josias. Black is Population.
The functional response from the RSF analysis also indicated evidence of individual specialisation, with a weak overall relationship between habitat availability and selection (Figure 4). Furthermore, the relative selection strength (log-RSS) for river habitat showed that individuals selected areas near rivers more strongly, with log-RSS values decreasing as distance to the river increased. At the population level, the selection strength for river tended to be higher in areas closer to flooded forest, a pattern clearly observed for male Chom and female Caracal in 2012. In contrast, for female Ellen and male Josias in 2015, the distance to flooded forest appeared to have little or no influence on the strength of river selection. This divergence reinforces the interpretation that the hydrological anomalies of 2015 altered the spatial configuration and ecological distinctiveness of available habitats, potentially masking typical selection patterns and weakening spatial associations (Figure 5).
Relative selection strength response (log-RSS) as a function of distance to the river for each individual and at the population level. Each panel represents a different individual, while bottom plots show the population-level responses. AID denotes animal identification (animal ID). Color-coded lines correspond to different categories of distance to the flooded forest, highlighting the interaction between these habitats in resource selection. The decreasing trend suggests that increasing distance to the river reduces the relative selection strength for this habitat type.

Figure 5. Long description
The figure consists of five panels arranged in three rows. Each panel plots log-R S S on the y-axis against Dist to _river (x sub 1) on the x-axis.
* Top-left panel: A I D Male Chom. Shows three downward-sloping lines. The red line (Distance to flooded forest 1.667) starts highest at y equals 5. The green line (2.096) starts at y equals 4. The blue line (2.245) starts at y equals 0. All show a linear decrease as distance to river increases.
* Top-right panel: A I D Female Caracal. Shows nearly horizontal or slightly decreasing lines. Red is at the top (y equals 2.5), green in the middle (y equals 0), and blue at the bottom (y equals negative 5).
* Middle-left panel: A I D Female Ellen. Shows three steeply decreasing lines that converge as distance to river increases. Blue starts highest (y equals 2.5), followed by green and red.
* Middle-right panel: A I D Male Josias. Shows steeply decreasing lines. Blue starts highest (y equals 7), followed by green (y equals 5) and red (y equals 3).
* Bottom-left panel: Population level response. This panel features a larger x-axis range (0 to 3). It displays three sets of lines (red, green, and blue) representing different distances to flooded forest (1.824, 2.176, and 2.321). All groups show a consistent linear decrease in log-R S S as distance to river increases, with the red group maintaining the highest selection strength and the blue group the lowest.
Each panel includes dashed confidence interval lines around the solid trend lines. A horizontal dashed reference line is present at y equals 0 in all panels.
Discussion
Understanding the ecology and population trends of the Orinoco Goose is essential for developing effective conservation strategies for this poorly known and increasingly threatened Amazonian waterbird. By integrating LEK with movement data, our study provides new insights into the conservation status and spatial ecology of the Orinoco Goose in the western Brazilian Amazon. Our findings reveal a clear spatial contrast in the perceived population trends of the Orinoco Goose along the Juruá River, providing strong evidence that protected areas (PAs) play a central role in the recovery of this species. LEK collected from 73 experienced hunters across 73 widely spaced riverine communities indicated that perceptions of population increases were overwhelmingly concentrated within PAs, particularly in the RDS Uacari and RESEX Médio Juruá, where nearly all respondents reported positive trends. In contrast, unprotected areas exhibited a higher frequency of reports of population stability or decline, highlighting the species’ vulnerability outside protected territories.
Additionally, our results reveal important aspects of the movement ecology of the Orinoco Goose in the Juruá River. GPS tracking indicated that the monitored individuals, belonging to different family groups, did not exhibit overlapping home ranges. However, given the limited sample size and the spatial separation among capture locations, this pattern should be interpreted cautiously and cannot be generalised beyond the individuals tracked. In addition, the spatial separation among monitored individuals does not preclude the existence of other, unmonitored home ranges between capture sites that may partially overlap. Importantly, all tracked individuals were monitored during a specific life-history stage, shortly after the reproduction period, while adults were accompanying their broods. This brood-rearing context likely imposed behavioral and spatial constraints on movement patterns, as adults are expected to prioritise habitats that offer both foraging opportunities and safety for young birds. Consequently, the observed home range sizes and habitat selection patterns should be interpreted within the context of parental care rather than as representative of movement behavior across all life stages or seasons. Spatial use during this period may differ from that of non-breeding adults or individuals outside the reproductive cycle, highlighting the importance of considering life-history stage when interpreting telemetry-based movement data.
Home range size
The pronounced variation in home-range size among individuals suggests that space use in Orinoco Goose is not primarily structured by sex. Although females in this study tended to occupy larger home ranges than males within their respective years, this pattern was inconsistent across individuals, indicating that sex alone does not adequately explain variation in area use. Rather, the distinct differences in space use observed among individuals point to the influence of individual-specific ecological requirements or behavioral strategies. Such variation may be shaped by multiple interacting factors, including territoriality, mating systems, resource availability, and seasonal dynamics (Endo et al. Reference Endo, Haugaasen and Peres2014). Orinoco Geese are known for their behavioral flexibility, frequently ranging over large areas and adjusting diet and habitat use in response to spatial and temporal changes in resource availability (Costa et al. Reference Costa, Storck‐Tonon, dos Santos‐Filho, da Silva, Campos‐Silva and Peres2023). As in other herbivores, food availability likely plays a central role, with both food patch density and quality influencing home-range size and movement patterns (van Beest et al. Reference van Beest, Rivrud, Loe, Milner and Mysterud2011; Costa et al. Reference Costa, Storck‐Tonon, dos Santos‐Filho, da Silva, Campos‐Silva and Peres2023).
The absence of home-range overlap among tracked individuals may partially reflect the spatial separation of capture sites along the river. However, within protected areas characterised by low anthropogenic disturbance, this exclusivity may also indicate that key resources are sufficiently abundant and evenly distributed, reducing competition between family groups and the need for an extensive ranging area. In addition, captures occurred during the reproductive period when adults were accompanying broods. Consequently, the observed spatial clustering of individuals likely reflects family-group formation associated with brood-rearing, rather than evidence of stable pair bonding or mate fidelity inferred from telemetry alone. This interpretation is consistent with observations of monospecific flock structure and spatial organisation during the breeding season reported for the species (Pinheiro et al. Reference Pinheiro, Carrara, Faria, Uhlmann, Antas, Terborgh and Davenport2021), suggesting that space use at this time of year is strongly shaped by reproductive behavior.
Patterns of habitat selection further revealed strong individual specialisation and emphasised the role of interannual variability rather than sex-based ecological segregation. Individuals monitored in 2012 consistently selected river margins and fluvial beaches, whereas those tracked in 2015, an extreme flood year, selected river habitats while avoiding fluvial beaches. This divergence can be driven by shifts in habitat availability and spatial configuration due to hydrological anomalies, which can temporarily alter the ecological distinctiveness and accessibility of key environments. Indeed, unusually high water levels during the 2015 dry season may have expanded the spatial extent of suitable aquatic habitats, potentially contributing to the larger home ranges observed for some individuals sampled in that year. Functional response analyses support this interpretation, indicating weak population-level relationships between habitat availability and selection and reinforcing the importance of individual- and year-specific characteristics.
Collectively, these findings underscore the strong dependence of Orinoco Goose on riverine environments and its sensitivity to hydrological variability. They highlight how extreme flood events can reshape space-use patterns and habitat selection, potentially masking typical ecological relationships. However, broader inference remains constrained by the limited sample size and uneven tracking effort among individuals. Future studies incorporating larger numbers of individuals across multiple hydrological years, including areas outside protected zones, will be essential to disentangle the relative contributions of sex, individual specialisation, reproductive behavior, protection status, and hydrological dynamics in shaping the spatial ecology of this species.
Habitat preferences
Our results, based on third-order habitat selection (individual-level analysis at the home range scale), showed significantly different preferences for all habitat types. However, river and fluvial beach habitats exhibited stronger selection coefficients, indicating that their inherent juxtaposition plays a more prominent role in habitat use compared to flooded forests. This preference highlights the critical importance of conserving riverine habitats, especially given the dramatic decline in migratory bird populations due to illegal hunting, habitat loss, and climate change (Campos-Silva et al. Reference Campos-Silva, Peres, Hawes, Abrahams, Andrade and Davenport2021). The Orinoco Goose migrate seasonally over extensive spatial scales, enabling them to traverse major geographical barriers and stop at sites with similar habitat characteristics (Viana et al. Reference Viana, Santamaría and Figuerola2016). This adaptability underscores the need to protect key stepping-stone habitats that support their migratory routes. Although Orinoco Goose are primarily terrestrial grazers, they also rely on aquatic environments as safe refuge, especially when adults accompany young broods (Endo et al. Reference Endo, Haugaasen and Peres2014). In such contexts, individuals frequently swim or even dive when disturbed, underscoring that the ‘river’ category in our analysis may reflect both use of marginal habitats and active aquatic behavior under specific conditions.
Inter-individual variation in habitat selection plays a critical role in shaping population-level patterns, as extreme values from certain individuals can disproportionately influence mean coefficients, potentially masking underlying behavior diversity (Gillies et al. Reference Gillies, Hebblewhite, Nielsen, Krawchuk, Aldridge and Frair2006). We found substantial variation in beach preference among individuals, suggesting that factors such as experience, physiological state, social interactions, or seasonal variations may drive heterogeneous modes of habitat selection (Lele et al. Reference Lele, Keim and Solymos2017). The functional response in habitat selection provides insights into the degree of individual specialisation, as a strong relationship between habitat availability and selection typically indicates flexible or opportunistic behavior (Mysterud and Ims Reference Mysterud and Ims1998). In this study, the absence of steep slopes suggests that habitat selection is not strictly driven by habitat availability, implying that individuals may exhibit specialised preferences regardless of resource abundance (Lele et al. Reference Lele, Keim and Solymos2017). The RSS analysis further corroborates the selectivity for river habitat as the overall selection strength (log-RSS) decreases with increasing distance to river.
The seasonal flood pulse, which inundates important grazing sites, may be one of the primary reasons for the evolution of migratory behavior, and indeed waterbirds are dependent on river and beach habitats that become flooded during the high-water season (Tubelis et al. Reference Tubelis, Mendonça, Vieira and Borges2020). Breeding pairs of Orinoco Goose with young are also found along river margins, particularly beaches, across the Amazon (Tubelis et al. Reference Tubelis, Mendonça, Vieira and Borges2020). In this context, the behavioral responses observed in 2015, when river levels remained abnormally high even during the dry season, are particularly relevant. The reduced selection or even avoidance of beaches by individuals tracked in that year likely reflects limited beach availability and altered habitat structure caused by the extreme flood conditions. Such hydrological anomalies may temporarily blur the ecological distinction between habitat types, affecting typical selection patterns. Further studies, investigating aspects of nest-building and nest-site selection, are necessary to better understand to what extent the species use river margins for shelter and other activities during dry months, since the only information on Orinoco Goose nesting in Brazil was briefly reported by Sick Reference Sick1997.
Protected areas for Orinoco Goose
Amazonian freshwater ecosystems are critical not only for maintaining regional ecological balance but also for supporting global climate regulation through carbon sequestration and influencing local and regional weather patterns (Campos-Silva et al. Reference Campos-Silva, Peres, Hawes, Abrahams, Andrade and Davenport2021). These ecosystems provide essential services such as clean water, food resources, and flood regulation, which are vital for both the surrounding communities and the broader environment (Castello Reference Castello2021). Additionally, they support an extraordinary level of biodiversity, with numerous aquatic species found exclusively in this region (Scherer et al. Reference Scherer, Boom, Barbarossa and van Bodegom2023). Given that these ecosystems are interconnected through the hydrological cycle (Caldas et al. Reference Caldas, Thieme, Shahbol, Coelho, Grill, Van Damme and de Brito Ribeiro2023), they are particularly vulnerable to anthropogenic threats such as deforestation, pollution, overexploitation, mining, and the construction of large hydropower infrastructure (Forsberg et al. Reference Forsberg, Melack, Dunne, Barthem, Goulding, Paiva and Weisser2017, Duarte Ritter et al. Reference Duarte Ritter, Muñoz, Fabrício Machado, Albert, Ribas, Carnaval and Guayasamin2025). Consequently, conservation strategies focused on preserving the biodiversity and ecological functions of Amazonian freshwater environments are urgently needed.
Protected areas are a vital conservation strategy that spans both terrestrial and freshwater ecosystems, aiming to preserve biodiversity and maintain essential ecosystem services (Campos-Silva et al. Reference Campos-Silva, Hawes, Andrade and Peres2018). Both male and female Orinoco Goose demonstrated a preference for river and beach habitats, which serve as key foraging and transitional zones between nesting areas on beaches, island patches, and gallery forests (Tubelis et al. Reference Tubelis, Mendonça, Vieira and Borges2020). This preference is also linked to the species’ migratory behavior, which is partly driven by the availability of nesting cavities (Davenport et al. Reference Davenport, Nole Bazán and Carlos Erazo2012). Protected areas, particularly when integrated with community-based conservation (CBC) initiatives, where local communities are empowered to take an active role in local surveillance, can enhance the protection of riverine and beach habitats (Campos-Silva et al. Reference Campos-Silva, Hawes, Andrade and Peres2018). By combining formal conservation measures with local knowledge and stewardship, PAs can achieve more effective and lasting conservation outcomes.
CBC is particularly important because most existing protected areas in Amazonia are inhabited by human populations, including both indigenous and non-indigenous communities (Peres Reference Peres2011). These communities often rely on local wildlife as a primary source of protein, which could create conflicts between conservation objectives and human needs (Endo et al. Reference Endo, Haugaasen and Peres2014). In these areas, management guidelines created to reconcile local livelihoods with the long-term sustainability of wildlife populations are imperative (Peres and Zimmerman Reference Peres and Zimmerman2001; Endo et al. Reference Endo, Haugaasen and Peres2014). Our results show that the Orinoco Goose mainly use the mainstream Juruá River channel as its preferred foraging and brood-rearing area. Therefore, those conservation guidelines could, for example, implement the spatial zoning of the riverscape targeting the breeding areas of this important species as no-take zones, including strict protection of some river margins and beaches and harvesting zones, where hunting could be allowed (Endo et al. Reference Endo, Haugaasen and Peres2014). Increasingly heavier speedboat traffic along the main river channel during the dry season, which can easily disrupt the critically vulnerable period when adults are foraging along river margins with their goslings, should also be managed. However, we emphasize that given the transboundary nature of their long-range migration patterns (Davenport et al. Reference Davenport, Nole Bazán and Carlos Erazo2012), conservation actions, scientific research, and citizen science initiatives will be essential at wider scales (Tubelis et al. Reference Tubelis, Mendonça, Vieira and Borges2020).
Conclusion
The conservation of Orinoco Goose is intricately linked to the protection of both their breeding and non-breeding habitats. The observed variation in home range size and space use among individuals underscores the need to preserve diverse habitat types, particularly within protected areas that maintain the natural disturbance regime of free-flowing rivers, seasonal flood pulses, sediment transport, bank erosion, and point-bar/beach formation, free from the impacts of dams and flow regulation.
As migratory species, Orinoco Goose depends on accessible resources throughout their seasonal movements, making it essential to address potential conflicts between conservation goals and local livelihoods. Implementing sustainable-use practices within protected areas can foster a harmonious balance between human needs and wildlife conservation. Furthermore, collaborative efforts in scientific research and conservation practices are crucial for enhancing our understanding of migratory patterns and habitat requirements of the Orinoco Goose. By prioritizing conservation actions that protect critical breeding and foraging sites, we can ensure their long-term survival and contribute to the broader ecological integrity of Amazonian waterscapes.
Supplementary material
The supplementary material for this article can be found at http://doi.org/10.1017/S0959270926100616.
Acknowledgements
Foremost we thank the Medio Juruá fishing communities and organisations from Jurua River for their time and cooperation during the data collection period, including Secretaria de Estado do Meio Ambiente do Amazonas (SEMA), Instituto Chico Mendes de Conservação da Biodiversidade (ICMBio), Associação dos Produtores Rurais de Carauari (ASPROC) and Associação dos Moradores da Reserva de Desenvolvimento Sustentável Uacari (AMARU). LD thanks the financial support from the National Geographic Society: Grant #WW1-277R-18 (“Mapping Waterbird Migrations in Tropical South America”). JVC-S and CAP thanks the Gordon and Betty Moore Foundation, Mulago Foundation, The Pilot House, Synchronicity Earth, International Conservation Fund and International Conservation Fund of Canada,Frontiers Planet Prize, and National Geographic and the Rolex Perpetual Planet Amazon Expedition for their support to Instituto Juruá. We also thank Dr. Brett Jesmer (Virginia Tech) for providing the RSF tutorial and recommending literature that guided our analysis.
Author contribution
FVA: Conceptualisation, Data analysis, Methodology, writing; CDR: Data analysis, Methodology, writing, review; HCMC: Data analysis, Methodology, writing; LD: Conceptualisation, Data acquisition, Data analysis, Funding acquisition, Methodology, Project administration, review; PRC: Data analysis, Methodology, review; CAP: Conceptualisation, Funding acquisition, Methodology, review; Data analysis, Funding acquisition, Methodology, Project administration; TB: Review, supervision; JVC-S: Conceptualisation, Data acquisition, Funding acquisition, Methodology, Project administration, Supervision, writing, review.