Introduction
Among many beef quality traits marbling is one of the most important quality characteristics of meat demanded by consumers (Platter et al., Reference Platter, Tatum, Belk, Koontz, Chapman and Smith2005). According to Troy et al. (Reference Troy, Tiwari and Joo2016) marbling not only provides higher eating quality of beef but also contains good fatty acids: high level of polyunsaturated fatty acids and monounsaturated fatty acids compared with other fats in beef. Consequently, analysis of marbling plays an important role in the evaluation of meat quality. Marbling score is a component of several beef quality grading systems in the world including the United States, Japan and Australia. It refers to visible fat found between muscle fibre bundles within the longissimus thoracis muscle (LT). Marbling score is assessed subjectively (visual appraisal) by a grader during the process of assigning beef quality grade. Chemical analysis is another conventional method for meat marbling evaluation, and it has been widely used as a standard method for the accurate determination of intramuscular fat (IMF) content. Intramuscular fat simply quantifies the amount (percentage) of fat within the muscle, but marbling score considers amount, distribution and texture of fat, too.
In Europe, either IMF level or other meat quality traits have not yet been introduced in the EUROP-based grading system. However, to meet increasing consumer demands for improved beef quality, these expectations have become relevant. Nowadays, several innovative instrumental methods are being developed in the meat industry for a rapid and on-line evaluation of marbling scores. These are mainly spectroscopic methods (NIR, NMR) but several imaging techniques are also studied, such as computer image analysis (Irie and Kohira, Reference Irie and Kohira2012), X-ray computed tomography (CT) (Nade et al., Reference Nade, Fujita, Fujii, Yoshida, Haryu, Misumi and Okumura2005) and magnetic resonance imaging (Lee et al., Reference Lee, Lohumi, Lim, Gotoh, Cho and Jung2015) measurements.
The aim of this study was to evaluate marbling traits of LT with different methods: USDA marbling score, IMF content by image analysis of X-ray CT scans and by conventional analytical method in order to investigate possible relationships between methods, and to determine the effect of EUROP conformation/fat score on the IMF level.
Material and methods
Bulls (n=46) were slaughtered at an average weight of 535.94±126 kg and an average age of 645.66±437 days. Overall data represented a wide range of slaughter weights (351 to 767 kg). At slaughter, bulls were stunned with a captive bolt gun and killed by exsanguination. Following traits were recorded at slaughter: slaughter weight, hot carcass weight and EU carcass classification data. Carcasses were assessed by a trained operator for conformation on an 18-point scale (from 1 (the poorest) to 18 (the best)) and fatness on a 15-point scale (from 1 (the leanest) to 15 (the fattest)) according to EU beef carcass classification scheme with the use of subclasses. After 24 h, chilled LT samples were taken from the right-half carcass at the 12th rib. USDA marbling score was assessed visually at the cut surface of the 12th ribeye in one of ten different degrees, from practically devoid to abundant. Computed tomography examination of rib cuts was performed 3 days postmortem at the Institute of Diagnostic Imaging and Radiation Oncology of Kaposvár University. Scans were executed by using a 16-slice CT system (Siemens Somatom Sensation Cardiac, slice thickness: 5 mm, 120 kV). On each scan, LT area as region of interest was selected by manual method. Volumetric tissue content and tissue area were determined according to methods previously described by Holló et al. (Reference Holló, Szűcs, Tőzsér, Holló and Repa2007) with the use of MANGO (3.8, 2016) software. With simple thresholding, pixels between −200 and +19 CT value were included in the evaluation of IMF. Following CT examination, samples were transported to the Analytical Laboratory of the University. After removing surface fat, IMF level was determined gravimetrically by Soxhlet method, using petroleum ether as solvent.
Data were statistically analysed by ANOVA using IBM SPSS 20.0 software. Mean values between main EUROP conformation and fat scores have been compared. Tukey’s test was used to compare differences between mean values at a 5% level of significance. All the results are given in tables as means and standard deviations. Pearson’s correlation was calculated between IMF values measured with different methods and carcass traits.
Results and discussion
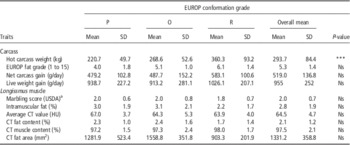
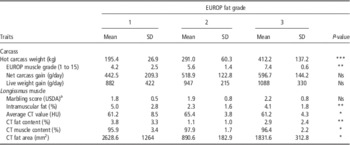
Tables 1 and 2 summarise the carcass and LT traits according to EUROP conformation and fat classes. The average hot carcass weight was 294 kg and there was a significant difference between conformation and fat grades. It seems that carcass weight increased with conformation class and fat grade, too. Mean values of EUROP fat grade in conformation classes varied from 4 to 6.1 (Table 1), whereas mean values of EUROP conformation grade in fat classes varied from 4.2 to 7.4 (Table 2). Higher fat grade was associated with a significantly more favourable conformation grade. The average live weight growth rate and the net carcass gain of bulls were 955 and 519 g/day, respectively. There were no significant differences between EUROP classes for these traits, but the growth rate tended to be higher in better EUROP conformation and higher fat grades (Tables 1 and 2).
Carcass and longissimus muscle traits among EUROP conformation classes

CT=computed tomography.
a 1: slight, 2: small, 3: modest.
***P<0.001.
Carcass and longissimus muscle traits among EUROP fat classes

CT=computed tomography.
a 1: slight, 2: small, 3: modest.
*P<0.05; **P<0.01; ***P<0.001.
The marbling traits of LT were similar across the different EUROP conformation classes (Table 1). However, examined marbling traits, except USDA marbling score, significantly differed between fat classes (Table 2). Average chemical fat content of LT varied between 2.2% and 3.1% across conformation classes, compared with 2.3% to 5.0% across fat classes. Similar to chemical fat content, CT fat content was the highest in O conformation class and in 1 fat class. Marbling is an economically important factor in many beef carcass classification systems such as USDA. The highest frequency of USDA marbling score was ‘small’ (55.2%), followed by ‘slight’ (25.5%), ‘modest’ (17.2%) and ‘moderate’ (2.1%). The highest USDA marbling scores were given for bulls belonging to ‘O’ and ‘P’ conformation classes and to ‘3’ fat class. According to our results, higher IMF level was found in lower conformation classes. However, Nogalski et al. (Reference Nogalski, Wroński, Wielgosz-Groth, Purwin, Sobczuk Szul, Mochol and Pogorzelska2013) showed no differences in IMF level between fat classes of carcasses. In our study, the highest intramuscular chemical fat level and CT fat percentage of LT were observed for bulls with the fat grade 1, followed by fat grade 3 and the lowest IMF level was measured in carcasses with EUROP fat grade 2, which was unexpected.
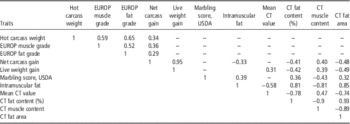
Table 3 presents the simple correlation matrix of the examined traits. Bonny et al. (Reference Bonny, Pethick, Legrand, Wierzbicki, Allen, Farmer, Polkinghorne, Hocquette and Gardner2016) concluded that EUROP conformation and fat score have no relationship with eating quality. In our study, carcass traits moderately correlated with each other, but did not relate to LT traits. Guzek et al. (Reference Guzek, Głąska, Pogorzelski, Kozań, Pietras, Konarska, Sakowska, Głąski, Pogorzelska, Barszczewski and Wierzbicka2013) described similar findings in Limousin bulls. USDA marbling traits loosely correlated with IMF values obtained by CT and Soxhlet method. The fat percentage and fat area in LT on CT-scans closely correlated with chemical fat content (r=0.81 and 0.85, respectively). A negative correlation was detected between CT fat and CT muscle percentage, as well as between average CT value and fat content (Table 3). It is also important to evaluate correlations between growth rate and marbling traits. Both live weight gain and carcase gain demonstrated a negative association with CT fat percentage and CT fat area. A positive association was observed between growth rates and CT muscle percentage.
Simple correlation coefficients for examined traits

CT=computed tomography.
Only significant values (P<0.05) are indicated.
P<0.05 r<0.29; P<0.01 r<0.43; P<0.001 r<0.51.
Conclusion
There was no relationship between EUROP classification of carcasses and IMF content of LT, yet in contrast to the fact that IMF was highly correlated to CT data. Intramuscular fat was affected by slaughter weight and was negatively correlated with growth rate (r=−0.40 to −0.49).
Acknowledgement
This work was supported by the Hungarian Scientific Research Fund (Project 111645).