Introduction
The famous site of Çatalhöyük in central Anatolia (32:49:41N, 37:40:01E) is made up of two distinct tells, the eastern of which includes over 19m of Neolithic deposits. Excavations were first undertaken in the 1960s under the direction of James Mellaart (Reference Mellaart1967), and since 1993 further excavations have been undertaken under the direction of Ian Hodder (Reference Hodder2006). The natural deposits at the base of the mound were reached in a deep sounding in 1999 (Hodder Reference Hodder2007: 59–101). Since then work has concentrated on later deposits with the aim of producing an excavated sequence through the whole mound.
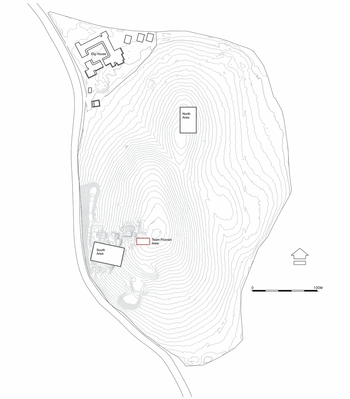
Traditionally, research at Çatalhöyük has focused on the earlier Neolithic levels; by contrast, the Late Neolithic occupation has been clearly under-researched. Considerable destruction by post-Neolithic activities has occurred on the surface of the site, resulting in the preservation of only a relatively small area, on the crest of the East Mound, which provided the best opportunity for the recognition of Late Neolithic structures (Figure 1). This area is close to where Mellaart identified the last phase of occupation. Extensive survey on the surface of the mound and excavation of many areas has failed to clearly define a concentration of Late Neolithic material elsewhere.
Location of the TP Area on Çatalhöyük East.

The excavation of the upper strata at Çatalhöyük was carried out in the Team Poznań (TP) Area between 2001 and 2008, and directed by Arkadiusz Marciniak and Lech Czerniak. Their main objective was to investigate the demise of the affluent Neolithic community along with accompanying changes in economy, social organisation and cult practices. The strata that were excavated were equivalent to Levels 0, I and II in Mellaart’s (Reference Mellaart1967) chronological scheme, and were dated to the end of the seventh millennium cal BC on the basis of material culture.
In 2006, a new dating project began with the intention of providing a precise calendrical chronology for the whole sequence of the East Mound. To obtain a complete record of the Neolithic occupation, this dating programme is composed of two separate elements: a longer and earlier sequence of dates in the South Area, and a shorter and later sequence of dates in the TP Area. This paper presents the chronological modelling of the Late Neolithic deposits in the TP Area and discusses its importance. The modelling makes it possible to recognise the pace of change in the last centuries of the mound’s occupation and to understand its mechanisms and dynamics. This change proved to be of pivotal significance for the development of farming communities in the Neolithic and Early Chalcolithic in central Anatolia and beyond.
Until very recently, the occupation at Çatalhöyük East was portrayed as homogeneous and unchanging. The domestic structures in the earlier levels were commonly built of loam and clustered in streetless neighbourhoods, which were separated from each other by alleys and courtyards. Buildings have a great degree of continuity, being rebuilt on the same location, with the same proportions and interior arrangements for up to six building levels.
The results from the TP Area have revealed a new picture of the Late Neolithic community. Their houses were composed of a series of small, cell-like spaces surrounding a larger central ‘living room’, and lacked symbolic elaboration. They also lacked intramural burials, which were replaced by dedicated burial chambers with elaborate decoration (Marciniak & Czerniak Reference Marciniak and Czerniak2007, Reference Marciniak, Czerniak, Matthews and Curtis2012). The later Neolithic period also marks a change in regional occupation with the appearance of many smaller sites in the surrounding area. This is in contrast to the earlier phases of the site when there were few, if any, permanent sedentary communities in the region other than Çatalhöyük itself (Marciniak & Czerniak Reference Marciniak and Czerniak2007).
The results of a new dating programme, as well as revealing the previously unknown character of occupation in the last centuries of occupation at Çatalhöyük, have far-reaching implications for the understanding of a prehistoric village history, beyond the settlement itself and the Near Eastern Neolithic. The marked differences in the character and use of individual houses challenges the traditional understanding of the site as one where subsequent dwellings overlie previous structures, time and again, with little change. This in turn has a direct impact upon our understanding of the biography of the village and its social geography, in particular the nature of both individual households and larger communities such as extended households or neighbourhoods.
Implementing the Bayesian approach in the TP Area
The new programme of radiocarbon dating for Çatalhöyük East was conceived from the outset within a Bayesian statistical framework (for an overview see Bayliss et al. Reference Bayliss, Farid, Higham and Hodder2014). This allows its chronology to be estimated, using an explicit statistical methodology, from both the radiocarbon dates and the sequence revealed by archaeological excavation. This approach has already been applied to part of the South Area of the site (Cessford Reference Cessford and Hodder2005). The impact of this methodology is beginning to become apparent in British archaeology (e.g. Whittle et al. Reference Whittle, Healy and Bayliss2011), where it has been routinely applied for almost 20 years (Bayliss Reference Bayliss2009).
This methodology, which combines more than one type of dating evidence, can provide a more robust and precise chronology for the site than those reliant on only one set of data. It has the potential to be particularly powerful at Çatalhöyük because of the long sequences of vertical stratigraphy represented in the Harris matrices. In the earlier levels, where truncation is less severe, deposits from an individual building are often bracketed by the construction features at its base and the closure deposits overlying it. This allows the stratigraphy of the interior of the building to be represented as a single block in the matrix (e.g. B.18 in the South Area; Hodder Reference Hodder2007: fig 5.15). In contrast, in the TP Area, there are long stratigraphic strings of units in the matrix (up to 161 units in a single strand) but, because of the nature of the buildings and the extent of truncation, these are usually separated from each other. Consequently, the strands of the Harris matrix float separately and can only be grouped together by the uncertain process of archaeological phasing.
This distinction has been of great practical importance in the construction of the chronological model for the TP Area. Bayesian chronological modelling uses the relative dating provided by the stratigraphic sequence of units to constrain the calibrated radiocarbon dates of samples from those units. For this to be valid, two conditions must be met. First, the samples must have ceased exchanging carbon with the biosphere at the time when the deposit from which it was recovered was formed. Short-life, single-entity samples are therefore preferred, and are chosen to minimise the possibility of residuality or reworking (e.g. articulated bones or charred plant material functionally related to the use of an oven). Second, the relative order of deposits included in the model must be accurate. All matrices are interpretative constructions, but the sequence of units is much more securely known when stratigraphic and physical relationships have been recorded on site than when units have been grouped on the basis of their character and location during post-excavation analysis.
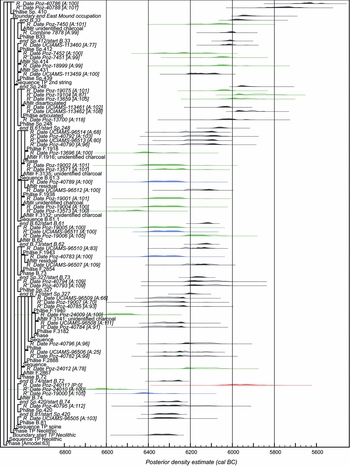
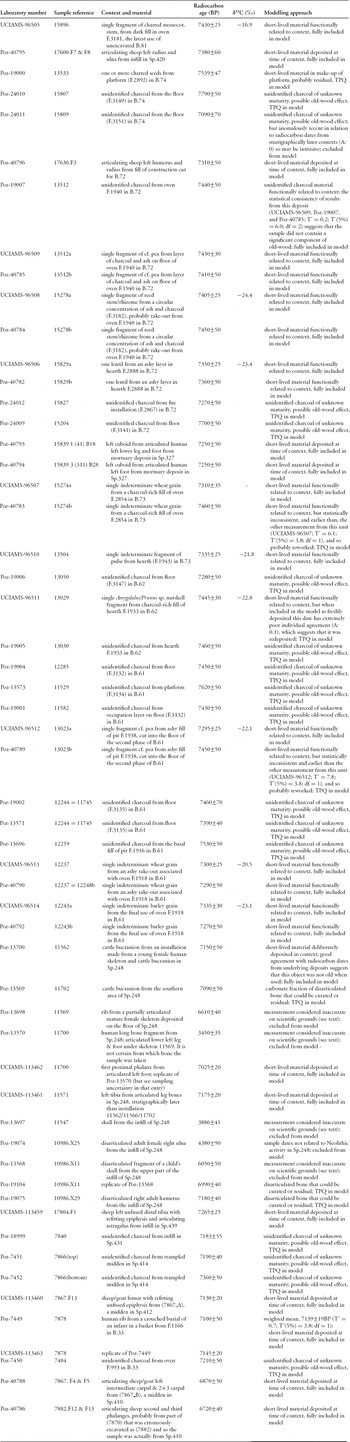
In total, 56 radiocarbon measurements are available from Neolithic deposits in the TP Area (Table 1 & Figure 2). The samples were dated at the Poznań Radiocarbon Laboratory (Poz-) and the University of California, Irvine (UCIAMS-), using methods outlined at Poznań Radiocarbon Laboratory (n.d.) and Department of Earth System Science (n.d.) respectively. In 2004–2005 five bones dated in Poznań were processed simply to gelatin (Longin Reference Longin1971), and two experimental measurements were made on the carbonate fraction of unburnt bone (Saliège et al. Reference Saliège, Person and Paris1998). All other bone samples were gelatinised and then ultra-filtered (Brown et al. Reference Brown, Nelson, Vogel and Southon1988). Poor collagen preservation was a severe limiting factor for sample selection, and less than half the bones that were processed could be dated successfully.
Probability distributions of dates from Neolithic deposits in the TP Area. Distributions followed by a ‘?’ have been excluded from the analysis (see Table 1). (Black: fully modelled; green: TPQ possible old-wood effect; blue: TPQ short-life sample, probably residual; red: probably intrusive).

Radiocarbon measurements from Neolithic deposits in the TP Area of Çatalhöyük East (14C ages have been corrected for fractionation using δ13C values measured by AMS (not cited); quoted δ13C values have been measured by IRMS).

Three pairs of replicate measurements are available, one statistically consistent pair from burial 7878 (Poz-9450 and UCIAMS-113463; T’ = 0.7; T’(5%) = 3.8; df = 1; Ward & Wilson Reference Ward and Wilson1978), and inconsistent pairs from bone group 11700 (Poz-13570 and UCIAMS-113462; T’ = 5993.1; T’(5%) = 3.8; df = 1) and skull 10986.X11 (Poz-13568 and Poz-19104; T’ = 209.0; T’(5%) = 3.8; df = 1) from Sp.248. In both instances the results produced using ultra-filtration of the bone gelatin are much older than those produced simply by gelatinisation. It seems that, for these bones, the ultra-filtration is removing a recent contaminant. For this reason, we have excluded from the model the four measurements from this area processed using this method (Poz-13697, Poz-13698, Poz-13570 and Poz-13568). The other result produced using this technique (Poz-9450) has been replicated and appears to be accurate.
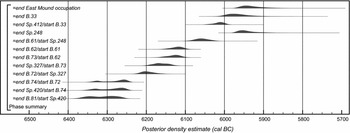
The chronological modelling has been undertaken using the program OxCal v4.1 (Bronk Ramsey 2009) and the calibration dataset of Reimer et al. (Reference Reimer, Baillie, Bard, Bayliss, Beck, Blackwell, Ramsey, Buck, Burr, Edwards, Friedrich, Grootes, Guilderson, Hajdas, Heaton, Hogg, Hughen, Kaiser, Kromer, McCormac, Manning, Reimer, Richards, Southon, Talamo, Turney, van der Plicht and Weyhenmeyer2009). The algorithm used in the model is defined exactly by the brackets and OxCal keywords on the left-hand side of Figure 2 (ORAU 2014). The posterior density estimates output by the model are shown in colour, with the unconstrained calibrated radiocarbon dates shown in outline. The other distributions correspond to aspects of the model. For example, the distribution ‘end B.81/start Sp.420’ (Figure 2) is the posterior density estimate for the time when B.81 was abandoned and deposits started to accumulate in Sp.420. In the text and tables, the Highest Posterior Density intervals of the posterior density estimates are given in italics.
The chronological model
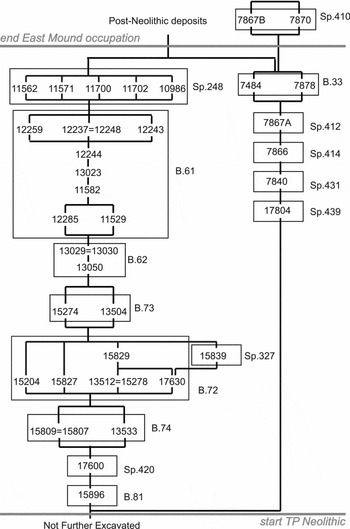
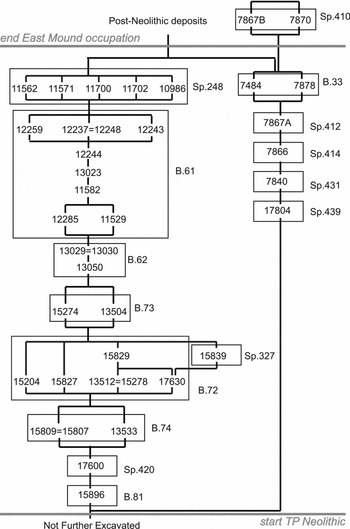
A chronological model for Neolithic deposits in the TP Area of Çatalhöyük East is shown in Figure 2. The stratigraphic information included in the model is summarised in Figure 3, and the rationale for the way in which we have incorporated each radiocarbon date is explained in Table 1.
Schematic diagram showing the stratigraphic information included in the chronological model defined in Figure 2.
A number of general rules have been adopted:
-
1) Samples of short-life material have been included as freshly deposited in their contexts (n = 14), unless they are statistically inconsistent with other measurements on short-life material from the same deposit or feature (n = 2), or have a very poor individual index of agreement (Bronk Ramsey Reference Bronk Ramsey1995: 429) with the stratigraphic sequence (n = 2). In these cases, the samples have been interpreted as reworked older material and have been used as termini post quos.
-
2) Samples of unidentified charcoal, which may incorporate an old-wood offset, have been included in the model as termini post quos (n = 15) unless they are statistically consistent with other measurements on short-life material from the same unit or feature (n = 1), when they have been included fully in the model.
-
3) Samples of articulated or refitting bone have been included as freshly deposited in their contexts (n = 12); a weighted mean (Ward & Wilson Reference Ward and Wilson1978) was taken of the measurements from burial 7878 before calibration.
-
4) The cattle bucranion from installation 11562 has, with reservations, been included in the model as freshly deposited. It was deliberately placed in the position in which it was found, but it need not have been fresh when deposited.
-
5) Other disarticulated bones, animal and human, could be reworked and have been modelled as termini post quos for the contexts from which they were recovered (n = 3).
-
6) Six measurements have been excluded from the model: the four results on bone considered anomalous for scientific reasons (n = 4; see above); Poz-24011, which is anomalously recent in comparison to the radiocarbon dates from overlying deposits, and seems to be intrusive; and Poz-19074, which suggests the further use of this area of the mound for burial in the Bronze Age (Table 1).
The model, which incorporates the stratigraphy (Figure 3) with the radiocarbon dates according to these interpretations of the character of the dated samples, has good overall agreement (Amodel: 63). Only one date has poor individual agreement (UCIAMS-96506, A: 25), which is no more than would be expected on statistical grounds for an assemblage of radiocarbon measurements of this size.
It should be noted that the two experimental measurements on bone carbonate are statistically consistent (Poz-13569 and Poz-13700; T’ = 0.7; T’(5%) = 3.8; df = 1), and the calibrated dates have good agreement with their positions in the sequence (A: 105 and A: 118 respectively, Figure 2). This suggests that, despite the anomalous ages that can be produced by dating this fraction of unburnt bone (Hedges et al. Reference Hedges, Lee-Thorp and Tuross1995 and references therein), these dates may be accepted as accurate.
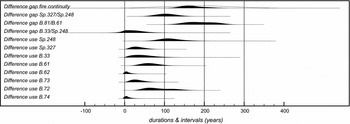
A summary diagram showing key parameters from the model is given in Figure 4. By comparing these probability distributions we can estimate the duration of different activities on the site and the intervals between dated events (Figure 5).
Summary of key dates from the TP Area.

Summary of durations and intervals from the TP Area.

The date and pace of change at the end of Çatalhöyük East
Developments in the TP Area mark a significant departure from the rules and practices that constituted the Neolithic community in earlier phases. They eventually led to the emergence of new economic and social arrangements at the end of the mound occupation. The process in question was complex and multi-faceted; it marked the continuation of one set of practices and the emergence of new ones. Changes in subsequent domains such as house architecture, procurement strategies of different resources or consumption practices had different pace and tempo.
In more general terms, the TP sequence is characterised by a striking continuation of two types of constructions: large houses (B.81 & B.61) and burial chambers (Sp.327 & Sp.248). Houses were of similar size and internal layout, and had distinctive solid floors made of white pebbles, which appear only in the final centuries of the mound occupation. These buildings were separated by a period when this area was used as an open space and occupied by a series of less substantial structures. Equally striking is continuity in the position of burial chambers. Built in the period after the practice of burying the dead in the domestic domain had ceased, both of them were cut into the eastern platforms of the preceding buildings.
Building 81 is at the bottom of the dated sequence. It was a c. 70m2 structure with only one fire installation and one platform in its final phase. The upper floor surface was made of numerous white pebbles mixed with silt, which suggests that no burials may be present. The walls were not preserved, implying a lack of the deliberate infilling customary throughout most of the Çatalhöyük sequence. Due to incomplete excavation, we can only estimate that it went out of use and became a midden area in 6375–6255 cal BC (end B.81/start Sp.420; 95% probability; Figure 4), probably in 6360–6330 cal BC (24% probability) or 6315–6265 cal BC (44% probability).
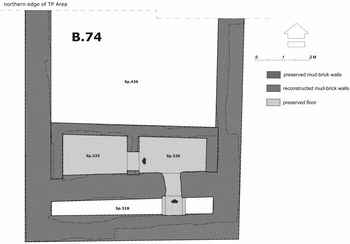
Building 74 (Figure 6), 47m2, was built on the site of B.81 in 6350–6245 cal BC (end Sp.420/start B.74; 95% probability; Figure 4), probably in 6345–6320 cal BC (16% probability) or 6295–6245 cal BC (52% probability). It was significantly smaller than its predecessor and was composed of four distinct rooms constructed over time and without internal features. The house was deliberately abandoned and infilled in 6345–6240 cal BC (end B.74/start B.72; 95% probability; Figure 4), probably in 6335–6320 cal BC (14% probability) or 6280–6245 cal BC (54% probability). By comparing the probability distribution for the start and end of B.74 we can estimate that it was used for 1–30 years (use B.74; 95% probability; Figure 5), probably 1–15 years (68% probability). This is a very short time for such a solid construction.
Plan of the solidly constructed but briefly occupied B.74.

Building 72 was built directly above B.74 immediately after its abandonment. The size, shape and internal layout of B.72 directly correspond with those of the preceding structure. It too comprised an open space to the north, probably surrounded by walls, and a hut-type construction, with a light roof, to the south. The open space was intensively used, as indicated by numerous hearths. B.72 was abandoned in 6230–6160 cal BC (end B.72/start Sp.327; 95% probability; Figure 4), probably 6220–6180 cal BC (68% probability). It had been in use for 30–155 years (use B.72; 95% probability; Figure 5), probably for 40–105 years (61% probability) or 110–125 years (7% probability).
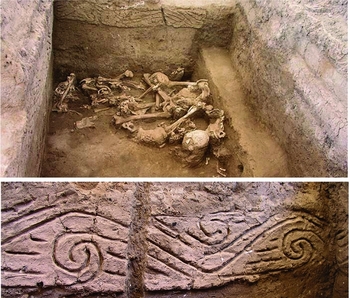
Late in the history of B.72 an elaborate burial chamber (Sp. 327) was constructed. It was cut carefully into the eastern platforms of B.74 & B.81. It had elaborate wall decoration that is, to our knowledge, unique in the entire Anatolian Neolithic (Figure 7). Remains of eight to nine individuals were found in the chamber, both resting on its floor and in subsequent infills, along with numerous rich grave goods, many of them of foreign origin, such as from south-western Anatolia. The burial chamber went out of use in 6200–6125 cal BC (end Sp.327/start B.73; 95% probability; Figure 4), probably 6185–6140 cal BC (68% probability). It was used for 5–70 years (use Sp.327; 95% probability; Figure 5), probably for 10–50 years (68% probability).
Top) burial deposits in Sp.327; Below) close-up of the incised motif decorating its interior.

The abandonment of the roofed chamber as a burial site saw a return to the exploitation of this area as an open space. A midden began accumulating (B.73) and a small structure was constructed (Sp.320) to the east, directly above the burial chamber (Sp. 327). Interestingly, the midden area was continuously used, as demonstrated by five fire installations placed in the open area. After a period of 5–65 years (use B.73; 95% probability; Figure 5), probably 10–45 years (68% probability), B.73 was abandoned and B.62 was constructed, in 6170–6100 cal BC (end B.73/start B.62; 95% probability; Figure 4), probably in 6145–6110 cal BC (68% probability).
B.62 was constructed on top of the midden and infill layers of the open area. Its alignments are identical to those of the older B.81. It was reconstructed a number of times, but had very few internal features. A central, square oven was placed directly above one of the fire installations from the preceding open space. The walls were not preserved, indicating a lack of a deliberate abandonment practice and infill. They may have been dismantled. B.62 was in use very briefly, for a period of only 1–30 years (use B.62; 95% probability; Figure 5), probably for 1–15 years (68% probability). It was demolished and the succeeding B.61 constructed in 6155–6090 cal BC (end B.62/start B.61; 95% probability; Figure 4), probably 6140–6100 cal BC (68% probability).
B.61 was built directly above B.62. It was reconstructed three times. The latest floor was particularly distinctive, being composed of pebbles set into a solid calcareous base. The building was almost devoid of internal features, although a central, square oven was placed directly above that of B.62 below. The walls of B61 did not survive, indicating that it probably was not deliberately infilled at its abandonment. After a period of 20–110 years (use B.61; 95% probability; Figure 5), probably of 40–85 years (68% probability), B.61 was abandoned and Sp.248 was constructed, in 6095–6020 cal BC (end B.61/start Sp.248; 95% probability; Figure 4), probably in 6080–6040 cal BC (68% probability).
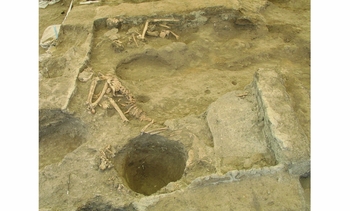
Following the abandonment of B.61, a new burial chamber (Sp. 248) was built inside its eastern part directly above the earlier burial chamber (Sp.327). Remains of six to eleven adults and three infants were placed on the floor, covered by plaster and thereby interred in the chamber (Figure 8). A deliberate installation comprising a cattle bucranion and a female skeleton was located to the north of these remains. This juxtaposition has not been found in earlier levels. Burial in Sp.248 occurred over a period of 60–185 years (use Sp.248; 95% probability; Figure 5), probably of 80–140 years (68% probability). It ceased in 5980–5885 cal BC (end Sp.248; 95% probability; Figure 4), probably in 5975–5930 cal BC (68% probability).
Plan of the later burial chamber Sp. 248.

To the east of the sequence of structures B.81–B.61 was another sequence of buildings and midden deposits (Sp.439–Sp.410). This area was severely truncated and consequently forms a separate stratigraphic string that could not be tied into the main string of the TP Area matrix. This sequence was dated (Figure 3), but there are two gaps in the sequence of samples: no samples were taken from the midden in Sp.413 (between Sp.439 and 431) or from B.34 (between Sp.412 and B.33). This means that, while this element of the model cannot stand alone, it does provide further evidence about the latest Neolithic occupation on the East Mound at Çatalhöyük. Critically, the latest structure in the sequence, B.33, is apparently the latest building recovered from the East Mound. B.33 is an irregular rectangular structure with two small hearths located in the centre. There was also a hearth further to the east associated with a feasting deposit; underlying this hearth was an infant burial. These spatial arrangements mark another significant departure from the patterns revealed in earlier phases. B.33 was contemporary with Sp.248; it was constructed in 6050–5985 cal BC (end Sp.412/start B.33; 95% probability; Figure 4), probably in 6030–5995 cal BC (68% probability), and was abandoned in 6015–5905 cal BC (end B.33; 95% probability; Figure 4), probably in 6000–5945 cal BC (68% probability). It was used for 1–110 years (use B.33; 95% probability; Figure 5), probably for 10–70 years (68% probability).
With the abandonment of B.33 came the end of the settlement on the East Mound at Çatalhöyük. It is 83% probable that burial continued in Sp.248 for -30–85 years (gap B.33/Sp.248; 95% probability; Figure 5), probably for -10–45 years (68% probability). (As we do not know with certainty whether B.33 was abandoned before Sp.248, this distribution spans zero. So, this interval is positive when Sp.248 ended after B.33 (83% probable), and negative when B.33 ended after Sp.248 (17% probable).) Neolithic occupation on the mound finally ended at 5975–5865 cal BC (end East Mound occupation; 95% probability; Figure 4), probably in 5965–5915 cal BC (68% probability). This estimate is probably robust, as it is based on evidence from more than one sequence of buildings, which were targeted as the latest visible structures on the mound following extensive surface survey and large-scale excavation. As evidenced by the dated bones from Sp.410, episodic activity certainly continued on the mound, both in the centuries immediately after it had been abandoned and in later periods.
Implications
The chronological modelling of Neolithic deposits in the TP Area of Çatalhöyük East makes it possible to grasp the nature and pace of the Late Neolithic change in the final period of the settlement’s occupation. In particular, it provides a temporal dimension to distinctive changes in spatial organisation, patterns of architecture and furnishing, burial practices, and chipped stone tool and pottery manufacture (see Marciniak & Czerniak Reference Marciniak and Czerniak2007).
In the Early Neolithic, social patterning appears to be based around neighbourhood communities constituted on the basis of both co-residence and economic pooling. Accordingly, the site was characterised by orderliness, including the careful regulation of activities and discard directed by taboos and long-term repetition (Hodder Reference Hodder2006: 135). The dominant mode of organisation was based upon collective and long-term memories, centred around material engagement with the house.
The Late Neolithic marks an emergence of a domestic mode of production and consumption featuring the increasingly independent household. Household arrangements were based upon individualised, and usually short-term, memories. People may have begun referring to specific pasts of their own houses and genealogies rather than the generic past of the entire settlement (for further discussion see Düring & Marciniak Reference Düring and Marciniak2006).
In earlier levels, a range of signifiers such as wall paintings and reliefs or burials underneath floors and platforms provided markers of supra-individual identities. Dissociated from their original context and deprived of their referential significance, they were given a different meaning in the Late Neolithic, becoming metonymic, or even ironic, and later rationalised and naturalised. As the significance of the Late Neolithic house diminished, its constitutive elements became dissociated from its original context. The wall images turned into decorative motifs on pottery and other portable objects, while bodies were interred in extramural cemeteries.
A number of intertwined memory regimes were at play in the last centuries of occupation of the East Mound. The first is of a semi-generic character and refers to the elements of wider significance for the community. Pebble floors appeared for the first time in A.III.1 (Mellaart Reference Mellaart1962: 49–50, figs. 3 & 12) in the central room of the so-called hunting shrine. Two levels later, pebble flooring appeared again in B.81, and then again 125–260 years later (gap B.81/B.61; 95% probability; Figure 5), probably 150–230 years (68% probability) later in B.61. The remembrance of the kind of construction was handed down through many generations, although the original meaning may have been lost when it was used in the purely domestic building B.61.
Second, the placement of burial chambers Sp.327 and Sp.248 above the eastern platforms of underlying buildings was clearly deliberate. The chambers were constructed in the place where bodies were certainly interred in earlier phases, and the reference to these earlier practices is unquestionable. The temporal gap between the disuse of Sp.327 and the construction of Sp.248 was 55–155 years (95% probability; gap Sp.327/Sp.248; Figure 5), probably 75–130 years (68% probability). This is significantly shorter than the gap between buildings with pebble floors. This may indicate a different memory regime that probably referred to the past of the individual household and its specific genealogy.
A third scale of memory is indicated by the placement of different fire installations, including hearths and ovens. The traditional spatial arrangements of the house with its northern ceremonial and southern domestic parts that appear to have been strictly respected in earlier periods were completely abandoned by the beginning of the TP sequence. However, the significance of spatial repetition as a social practice is still apparent. For example, fire installations were constructed on the same spot between a hearth in the open space of B.72 and the central oven in B.61. This represents a continuity of practice over a period of 115–240 years (95% probability; gap fire continuity; Figure 5), probably of 135–195 years (68% probability), although this was probably transmitted on a generational scale through personal memory.
The results of this new dating programme, applied to the previously unknown occupational sequence in the last centuries of the settlement occupation at Çatalhöyük, also have far- reaching implications for the understanding of the micro history and geography of the prehistoric village far beyond Çatalhöyük itself and the Near Eastern Neolithic.
The significant differences revealed in the duration of use of individual houses challenge both an, admittedly largely speculative, estimation of 60–70 years as an average lifetime of a Neolithic dwelling, and the sequential development of their arguably homogeneous clusters. Individual houses had different biographies that can either imply different social groupings or changeable organisational arrangements in subsequent generations. This difference in house rebuilding cycles requires a re-thinking of the village biography. The results of the analysis also lead to a better understanding of the underpinnings of settlement phasing, which inevitably suppresses a considerable variability of individual structures.
The results of the dating programme also make an important contribution to our knowledge of village geography by offering an insight into the poorly understood problem of the contemporaneity of houses that appear to be in clusters, both at Çatalhöyük and beyond. Houses that were in use for many decades certainly abutted houses used for a much shorter time. This requires a reformulation of the nature of social, economic and ceremonial linkages between people living in buildings of different temporalities. It further requires the re-definition of the social fabric of life at the settlement, in particular the ways in which the inhabitants of an individual house were integrated into a broader community, such as those of neighbourhoods or extended households. As the different materialities and temporalities of individual houses manifest the character of the task-focused groups who lived there, they also reflect the nature of rapidly changing nuclear households in terms of the regimes of acquisition, production, consumption and reproduction.
The Late Neolithic sequence at Çatalhöyük, however, may not necessarily be representative of other parts of the village in terms of the size, shape and duration of occupation of individual buildings. As revealed by the surface survey and extensive excavation, it is very unlikely that its other parts were occupied in these centuries. It indicates that the community inhabiting the settlement shrank dramatically. Moreover, the newly built houses in this latest period must have followed the contour of the already-large mound, making any social agglomerations of houses, as known from the classic phase, increasingly difficult to achieve.
Conclusions
Applying the Bayesian statistical framework to provide a precise calendrical chronology for the Late Neolithic deposits in the TP Area of Çatalhöyük East yielded interesting results. It has long been argued that changes around c. 6500–6400 cal BC signal the beginning of new forms of social, economic and religious organisation of the local community. Transformations in the TP Area can be seen as a further continuation of these processes. The tempo revealed allows us better to understand the nature of the change, which involved a gradual disassociation of dwelling, ritual and burial domains that were previously integrated in the house.
A departure from the classic arrangements of the earlier levels is already visible in B.81. It is manifested in its sheer size, its pebbled floor, and the lack of intramural burials and monumental installations. The occupation of the following building (B.74) was cut short, perhaps by some kind of sudden event in the household. It marked the beginning of a crisis that lasted 90–225 years (95% probability; gap end B.74/start B.62; distribution not shown), probably 105–185 years (68% probability). This crisis is manifested in the demise of solid dwelling structures which were replaced by light shelters and open space (B.73 & 72). Interestingly, a monumental burial chamber (Sp. 327) was erected during this period. These crisis conditions appear to have been difficult to overcome, and the return to the previous mode of life proved to be complicated. A failure of the first attempt, demonstrated by the very short use of B.62, led to the final mobilisation of important resources (pebbled floors, burial chamber and hearths). B.61 epitomised the classic Çatalhöyük structural template for the very last time.
The Bayesian model, in addition to other high resolution datasets, makes it possible to see a range of universal changes in a new perspective; it can chart their pace and reveal how they related to each other. This opens up new possibilities for examining a range of different social and economic developments such as the emergence of an integrated management and procurement system, conversion of riparian woodlands into increasingly managed anthropogenic habitats, or changes in architectural practices and construction techniques. This mode of life was retained by the Çatalhöyük community after 6200 cal BC, although it did not involve other apparently contemporaneous developments in the region, such as the appearance of painted pottery, new styles of house architecture and the avoidance of reliance on large cattle.
Acknowledgements
We thank Ian Hodder for the opportunity to participate in the Çatalhöyük Research Project. Funding for the radiocarbon dating was provided by the Adam Mickiewicz University in Poznań, the Gdańsk University Foundation, the National Science Center of Poland, the Templeton Foundation and the Çatalhöyük Research Project. We are grateful to Amy Bogaard, Tomasz Kozłowski, David Orton, Kamilla Pawłowska and Lisa Yeomans for the identification of samples prior to dating, and to Peter Ditchfield and Anna Oh for carbon and nitrogen measurements on whole bone powder to pre-screen bones for collagen preservation.