

Introduction
Western flower thrips (WFT), Frankliniella occidentalis (Pergande) (Thysanoptera: Thripidae), is a major constraint to French bean and tomato production in Kenya. To manage thrips in French beans and tomato, farmers rely extensively on synthetic pyrethroid applications, especially lambda-cyhalothrin (Nderitu et al., Reference Nderitu, Waturu, Olubayo, Aura, Kasina, Wesonga, Losenge, Ndung'u, Ngamau, Ombwara and Angong2001; Kasina et al., Reference Kasina, Nderitu, Nyamasyo, Olubayo, Waturu, Obudho and Yobera2006). The majority of smallholder growers depend on chemical pesticides with application rates reaching as high as 10–15 sprays per season for French bean (Nderitu et al., Reference Nderitu, Anyango and Ampofo1997). These insecticides have been shown to possess minimal efficacy due to high levels of resistance in thrips species, such as WFT and bean flower thrips (BFT) (Nderitu et al., Reference Nderitu, Waturu, Olubayo, Aura, Kasina, Wesonga, Losenge, Ndung'u, Ngamau, Ombwara and Angong2001). In addition to increased environmental risks associated with pesticides, frequent use of these chemicals increases production costs and pesticide resistance. Furthermore, use of pesticides contributes to loss of export market opportunities through quarantine restrictions imposed by importing countries, especially the European Union, due to non-compliance with maximum residue levels (MRLs) (Burkett-Cadena et al., Reference Burkett-Cadena, Kokalis-Burelle, Lawrence, van Santen and Kloepper2008). Thrips management methods that are based on the use of synthetic insecticides have often failed, because of the cryptic feeding behaviour, rapid multiplication, and development of insecticide resistance in thrips, and contribution to non-compliance with MRLs (Immaraju et al., Reference Immaraju, Paine, Bethke, Robb and Newman1992).
Both small- and large-scale farmers across the central, eastern, western and coast provinces of Kenya cultivate French bean, Phaseolus vulgaris (Fabaceae) (Onkoba, Reference Onkoba2002). The crop constitutes nearly 20% by volume (and 10% by value) of all fresh horticultural exports (HCDA, 2014), ranking second only to roses (Nderitu et al., Reference Nderitu, Wambua, Olubayo, Kasina and Waturu2007). A complex of four thrips species—WFT, BFT, F. schultzei and Hydatothrips adolfifriderici—inflict nearly 60–80% yield loss in French bean production. The insects attack flowers leading to abscission and poor yield. Furthermore, the damaged pods are malformed and are prohibited for export (Nderitu et al., Reference Nderitu, Waturu, Olubayo, Aura, Kasina, Wesonga, Losenge, Ndung'u, Ngamau, Ombwara and Angong2001; Nyasani et al., Reference Nyasani, Meyhöfer, Sevgan and Poehling2010; Nyasani et al., Reference Nyasani, Meyhöfer, Subramanian and Poehling2012).
In Kenya, tomato Lycopersicon esculentum Mill. (Solanaceae), is cultivated in diverse agroecological zones—from the coastal zones of Kilifi, across to the central, mid and high altitude zones, to the humid zones of Western and Nyanza provinces—on over 18,000 ha, with an output of over 500,000 tonnes (t) (HCDA, 2008). Tomato spotted wilt virus (TSWV), vectored by WFT, often compounds the damage by thrips on tomato. In Kenya, WFT causes up to 80% yield loss in tomato (Wangai et al., Reference Wangai, Mandal, Pappu and Kilonzo2001).
Integrated pest management (IPM) is a strategy that draws on a range of management tools with the goal of using the least ecologically disruptive techniques to manage pests to economically acceptable levels, as well as to encourage natural pest control mechanisms. Previous studies have revealed the success of IPM adoption in terms of reduction in pesticide expenditure and yield losses due to pest damage and increased farm incomes (Debass, Reference Debass2000; Gajanana et al., Reference Gajanana, Krishna Moorthy, Anupama, Raghunatha and Prasanna Kumar2006; Verghese et al., Reference Verghese, Tandon and Stonehouse2004; Orr et al., Reference Orr, McDougall and Mullen2008; Song and Swinton, Reference Song and Swinton2009; Hristovska, Reference Hristovska2009; Vayssieres et al., Reference Vayssieres, Sinzogan, Korie, Ouagoussounon and Thomas-Odjo2009; Nyasani et al., Reference Nyasani, Meyhöfer, Subramanian and Poehling2012; Reference Nyasani, Meyhöfer, Subramanian and Poehling2013; Reference Nyasani, Subramanian, Poehling, Maniania, Ekesi and Meyhöfer2015; Kibira et al., Reference Kibira, Affognon, Njehia, Muriithi, Mohammed and Ekesi2015; Muriithi et al., Reference Muriithi, Affognon, Diiro, Kingori, Tanga, Nderitu, Mohammed and Ekesi2016). The use of IPM strategies with less reliance on synthetic pesticides has been advocated for management of thrips and tospoviruses vectored by thrips (Gillett-Kaufmann et al., Reference Gillett-Kaufman, Leppla, Hodges and Merritt2009).
Consequently, the International Centre of Insect Physiology and Ecology (icipe) and partners are proposing an IPM strategy for suppressing thrips in tomato, onion and French bean production, to enhance food and nutritional security and income generation capacity of smallholders in eastern Africa. The broader IPM project proposes several IPM components for thrips management; however, for this study, we focus on an IPM strategy comprising three components: (1) the use of coloured sticky traps, (2) the use of kairomonal attractants with lures for attracting thrips and (3) the application of biopesticides. The effectiveness of these components has been evaluated in Kenya with positive results. For instance, in a study on the potential of coloured sticky traps and kairomonal attractants in the management of thrips on tomato and French beans in Kenya, Muvea (Reference Muvea2015) observed that blue sticky traps caught 13.24–59.12 times more thrips than clear traps on tomato and 22.07–29.31 times on French bean. The addition of kairomonial attractant increased the percentage of thrips captured by between 0.87 and 66.97% on tomato and 29.6 and 158.4% on French bean (Muvea et al., Reference Muvea, Waiganjo, Kutima, Osiemo, Nyasani and Subramanian2014; Reference Muvea, Kutima, Osiemo, Waiganjo and Subramanian2017). The application of M. anisopliae to manage thrips on French bean crop at an action threshold of 300 thrips captured per coloured sticky trap per week resulted in a Cost−Benefit ratio (CB ratio) of 1: 13.09 compared to weekly application of alpha cypermethrin 10EC with a CB ratio of 1: 7.52 (Muvea, Reference Muvea2015). Similarly, the application of M. anisopliae @ 1013 spores per ha was as effective as imidacloprid 200SC in reducing thrips infestation on French bean in three agroecological zones of Kenya (Kuboka, Reference Kuboka2013).
Application of M. anisopliae @ 1013 spores per ha was also effective in the management of thrips and thrips-transmitted tospoviruses in both resistant and susceptible onion cultivars. The CB ratio for biopesticide application was estimated at 1:14–18 compared to application of carbosulfan 25% EC with a CB ratio of 1:6–9 (Birithia, Reference Birithia2013). An IPM approach to management of thrips-infesting French bean, based on intercropping and use of M. anisopliae, resulted in a CB ratio of 2.62–3.47 compared to application of imidacloprid alone at a ratio of 2.98–3.49 (Nyasani et al., Reference Nyasani, Subramanian, Poehling, Maniania, Ekesi and Meyhöfer2015).
Although the above evidence on the technical performance of the IPM strategy exists, to our knowledge, there are no empirical studies on the potential impact of the developed IPM strategy for management of WFT on French bean and tomato production. The objective of this study, therefore, was to assess the potential economic impact of the use of the IPM strategy in the control of thrips in selected vegetables in Kenya, before its release and dissemination to farmers. Specifically, this study assessed the potential impact of an IPM strategy for the management of WFT on French bean and tomato production in Kenya. Our null hypothesis was that research on an IPM strategy for the management of WFT would have no positive impact on French bean and tomato production in Kenya. An economic surplus model was employed to assess the ex-ante impact of IPM, assuming an open economy in the case of French bean and a closed economy in the case of tomato, since French bean is grown for export with a small quantity consumed in the domestic market but tomato is grown for domestic consumption (HCDA, 2008).
Materials and methods
Study area and sampling technique
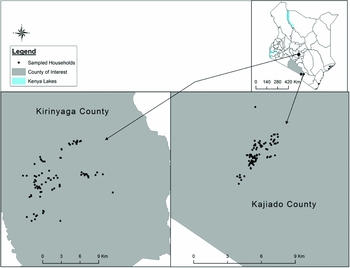
The purposive sampling technique was used to select two sub-counties from two major vegetable producing counties in Kenya (Mwea sub-county in Kirinyaga County and Loitokitok sub-county in Kajiado County) (HCDA, 2014) as shown in Fig. 1.
Map of Kirinyaga and Kajiado counties in Kenya showing the study sites.

Selection was done based on the intensity of tomato and French bean production and agroecology. Kirinyaga County is located at a higher altitude comprising the Tropical Alpine (TAI), Upper Highlands (UH), Lower Highlands (LH) and Upper Midland to Inner Lowland (IL5) zones producing a range of green beans and peas, and other commercial crops including tea and rice. Most parts of Kajiado County lie in the semi-arid and arid zones (zones V and VI) with livestock rearing being the predominant economic activity, while horticulture is gaining popularity through irrigation schemes mainly in Isinya sub-county and Kajiado North. The crops were selected for their unique production patterns in that both are rain-fed as well as irrigated; furthermore, both have shorter maturity periods compared to cereals.
This study adopted a geographic random sampling technique (Eng et al., Reference Eng, Wolkon, Frolov, Terlouw, Eliades, Morgah, Takpa, Dare, Sodahlon, Doumanou, Hawley and Hightower2007), since a list of farmers producing French bean and tomato in the area was unavailable. Geographical random sampling involves defining the survey area as a circular area, with imaginary households in the circle. The circular survey area is then divided into grid cells, depending on population density, such that, on average, each cell contains at least one household. Urban, unpopulated areas, forests and marshy areas are then masked out. In applying a simple random sampling technique, grids equivalent to the sample size are selected. The process of identifying respondents involved assigning latitude and longitude coordinates of the selected grids, which were then uploaded into a global positioning system (GPS) instrument. The enumerators were then guided by the GPS instrument to the location/grid, and administered a survey tool to the household situated in that particular grid. If the enumerators encountered more than one household in the grid cell and the coordinate, they randomly selected one of the households. If there were no households in the vicinity of the GPS coordinate, then the enumerators randomly selected a direction (north, south east or west) and walked (being guided by the GPS/compass) to a farmhouse that produced French bean and tomato.
In this study, a sample of 200 farmers was interviewed, based on Cochran (Reference Cochran1963). According to the author, n = (Z2pq)/e2, where n is the sample size and Z is the standard normal deviate at the selected confidence level. The value is 1.96 for the commonly used 95% confidence interval, p is the proportion in the target population estimated to have characteristics being measured, q = 1 – p and e is the desired level of precision (5% to 10%). In this case, p was determined as the proportion of farm families in Mwea East and Loitokitok districts growing tomato and French bean. Thus, n = 1.962 × 0.04 × 0.96/ (0.05)2 = 59, rounded to 60.
According to Ortiz and Pradel (Reference Ortiz and Pradel2010), samples of 60 to 100 farmers who participated in IPM technology and a similar number of farmers who did not were found to be sufficient in estimating the impact. Farmers (100) in Loitokitok sub-county and an equivalent number in Mwea were randomly selected. Data were collected using a questionnaire that was pre-tested between 1 and 8 May 2013. Interviews were conducted between 9 and 30 May 2013 to obtain primary data on farmers’ demographics, socioeconomic characteristics, yields, prices, costs of production, production constraints and cost of mitigation of constraints in both French bean and tomato production.
Methods and data analysis
Economic surplus analysis (ESA) and empirical framework
There are several approaches used to evaluate the potential impact of agricultural technologies (such as IPM), including the economic surplus model, benefit−cost analysis and econometric models (Alston et al., Reference Alston, Norton and Pardey1998; Verghese et al., Reference Verghese, Tandon and Stonehouse2004; Muriithi et al., Reference Muriithi, Affognon, Diiro, Kingori, Tanga, Nderitu, Mohammed and Ekesi2016). Econometric estimation is suitable for ex-post studies where the effect of past investments in research can be estimated using data on inputs, outputs and research expenditure (Khandker et al., Reference Khandker, Koolwal and Samad2010). The economic surplus method is used in both ex-ante and ex-post studies and is one of the most commonly used (Alston et al., Reference Alston, Norton and Pardey1998).
ESA has been used in past studies to measure IPM impacts, for instance, by Debass (Reference Debass2000), Song and Swinton (Reference Song and Swinton2009) and Orr et al. (Reference Orr, McDougall and Mullen2008). We used the change of economic surplus to estimate the potential benefits of icipe’s research and outreach for IPM of WFT, and then calculated the Net Present Value (NPV) of the annual costs and benefits with a real discount rate of 10% (the opportunity cost of capital) in 2008 dollars.
The economic surplus approach provides a simple, flexible way to assess the value of research, by comparing the situations with and without it. The approach uses the concepts of supply, demand and equilibrium. Supply represents producers’ production costs and demand represents consumers’ consumption values. Equilibrium quantity (Q) and price (P) result from the interaction of these two forces (Alston et al., Reference Alston, Norton and Pardey1995). Economic surplus is a measure of economic welfare equal to the sum of producers’ earnings above their marginal costs, and consumers’ willingness to pay above and beyond the market price. These can be illustrated using supply and demand curves.
For this ex ante analysis of the economic impact of IPM on production of French bean and tomato research, a partial-equilibrium, comparative static model was used (Alston et al., Reference Alston, Norton and Pardey1995; Kristjanson and Zerbini, Reference Kristjanson and Zerbini1999). In the case of tomato, a closed economy model was assumed, because of the modest international trade of tomato as a result of the stringent international export requirements. Assuming a closed economy implies that the adoption of a cost-reducing or yield-enhancing technology increases the supply of a commodity such as tomato. In the case of French bean, Kenya was assumed to be a small exporting country, thus a model that encompasses international trade was explored.
The release and adoption of the developed IPM technologies were expected to increase the supply of the total output of the produce (i.e. a downward shift in the supply curve), while the demand curve remained unchanged. As the increase in supply may reduce prices, consumers gain through paying less for the commodity while producers benefit through larger supplies to the market. The economic surplus model shows to what extent research-induced reductions in per unit cost of production and adoption by farmers may reduce market prices (Dey and Norton, Reference Dey and Norton1993). The simple case of linear supply and demand curves with parallel shifts was assumed (Kristjanson and Zerbini, Reference Kristjanson and Zerbini1999).
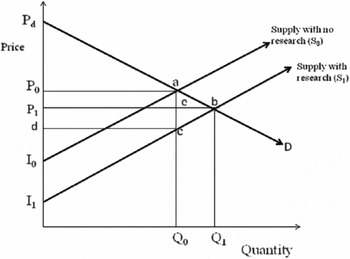
The basic model of research benefits in a closed economy is shown in Fig. 2, where D represents the demand function for tomato, while S0 and S1 represent the supply function for tomato before and after research-induced change, respectively. P0 is the initial equilibrium price while P1 is the price after research induced-change. Q0 is the initial equilibrium quantity while Q1 is the quantity after research-induced change. The area P0abP1 represents the change in consumer surplus while the area P1bcd represents the change in producer surplus. The area I0abI1 represents the change in total surplus (P0abP1 + P1bcd).
Measuring change in total surplus.

The release and eventual adoption of IPM practises shifts the supply curve of tomato production to S1, resulting in a new equilibrium price and quantity of P1 and Q1, respectively. The area beneath the demand curve and between the two supply curves is used to measure the gross research benefits. The area I 0 abI 1 represents the total increase in economic welfare (change in total surplus), and comprises changes in both producer and consumer surplus resulting from the shift in supply. The size of the area I 0 abI 1 depends on the slopes of the supply and demand curves, known as the price elasticities of supply and demand. They are used to measure how strongly producers and consumers respond to price changes.
Since IPM for management of WFT is a new agricultural technology, adoption interval among French bean and tomato growers was expected. Based on expert opinions, we estimated that it would take 16 years from when IPM thrips research began in the year 2008 for the technology to be adopted by all French bean and tomato growers in the susceptible area in the year 2023.
Factors determining the surplus change
Detailed formulas to estimate the change of producer and consumer surplus are provided in Alston et al. (Reference Alston, Norton and Pardey1998) and are not repeated here. We assumed linear supply and demand, parallel shift and a closed economy in the case of tomato. By solving the equilibrium conditions before and after the IPM release and converting them to elasticity forms, the change in consumer surplus and producer surplus can be calculated as follows:
 $$\begin{equation}
\Delta CS = Z\;{{\rm{P}}_0}{{\rm{Q}}_{\rm{0}}}\left[ {1 + \left( {0.5Z\eta } \right)} \right],
\end{equation}$$
 $$\begin{equation}
\Delta PS = (K - Z)\;{{\rm{P}}_0}{{\rm{Q}}_{\rm{0}}}\left[ {1 + \left( {0.5Z\eta } \right)} \right],
\end{equation}$$
 $$\begin{equation}
\Delta TS = K\;{{\rm{P}}_0}{{\rm{Q}}_{\rm{0}}}\left[ {1 + \left( {0.5Z\eta } \right)} \right],
\end{equation}$$
where ΔCS is the change in consumer surplus, ΔPS is the change in producer surplus and ΔTS is the change in total surplus. P0 is the initial equilibrium price. Q0 is the quantity before research induced change. Z = Kε/ (ε + η) is the reduction in price relative to its initial pre-research value, due to the supply shift. ε is the elasticity of supply and η is the absolute value of the elasticity of demand, which can be represented by the slope of the supply and demand curves and is obtained from the existing literature. K = C – E(c) is the vertical shift of the supply function expressed as a proportion of the initial price. E(c) is the percentage input cost change. C = E(Y)/ε is the percentage cost change. E(Y) is the proportionate increase in production as a percentage.
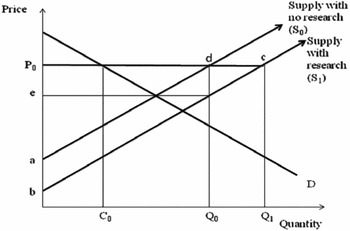
Since French bean constitutes nearly 20% by volume and 10% by value of all fresh horticultural exports (HCDA, 2008), a small open economy was assumed in the model. Fig. 3 illustrates the changes in economic surplus from the adoption of IPM in French bean production. The adoption of IPM will shift the supply curve downward from S0 to S1, and the domestic demand curve (D) of French bean is assumed to remain unchanged. The price of French bean is determined by the world market at P 0, and will not change when supply in Kenya increases. Consumer surplus thus remains constant, whereas producer surplus increases equal to the area abcd. In this case, Kenya could increase its exports from Q0 to Q1.
Changes in economic surplus from IPM adoption in French bean production in a small exporting country.

The change in total surplus is equal to the change in producer surplus, since the consumer surplus remains constant as follows:
 $$\begin{equation}
\Delta PS = \Delta TS = {{\rm{P}}_0}{{\rm{Q}}_0}K\left( {1 + 0.5K\varepsilon } \right),
\end{equation}$$
where ΔPS is the change in producer surplus, ΔTS is the change in total surplus and P0 is the world price. ε is the supply elasticity. K = {[E(Y)] / ε – [E(C)] / [1 + E(Y)]} pA (1–δ) is the proportionate downward shift in the supply curve due to IPM adoption in French bean production. E(Y) is the expected proportionate yield change per hectare. E(C) is the proportionate change in variable input costs per hectare to achieve the expected yield change. p is the success rate or the probability that IPM will achieve the expected yield. A is the adoption rate (proportional area of French bean under IPM to total French bean production area). δ is the rate of annual depreciation of French bean under IPM (reduction of expected yield). The methods used to obtain each element in the formulae are explained below in more detail.
Data sources and assumptions
Tomato and French bean price elasticities were obtained from existing literature (Table 1). There was little information on price elasticity of supply in the case of both tomato and French bean. According to Alston et al. (Reference Alston, Norton and Pardey1995), in the absence of better information, supply response parameters for agricultural crops in low-income countries (LICs) are often estimated with a value near 1. A minimum of 1 was, therefore, assumed. Supply of tomato was found to be price elastic, with the elasticity of supply ranging from 1 to 1.2. When supply is elastic, producers can increase output without a rise in cost or time delay. Demand for tomato was found to be inelastic with price elasticity of demand for tomato ranging from 0.52 to 0.79. Supply of French bean was found to be price inelastic, with the elasticity of supply ranging from 0.05 to 1. For the baseline scenario, we used mean values of the price elasticities.
Kenya and regional tomato and French bean supply and demand price elasticities used in previous studies

The IPM adoption process can be represented by the logistic ‘S’ shaped curve (Alston et al., Reference Alston, Norton and Pardey1998). The curve describes an adoption path in which adoption begins slowly, followed by a period of rapid growth and then reaches a plateau adoption level. Based on information obtained from expert opinions and previous studies, the IPM strategy for control of WFT would on average increase both French bean and tomato yield by 57% and the adoption rate would be 54% (Birithia, Reference Birithia2013; Kuboka, Reference Kuboka2013; Nyasani et al., Reference Nyasani, Meyhöfer, Subramanian and Poehling2012; Reference Nyasani, Subramanian, Poehling, Maniania, Ekesi and Meyhöfer2015; Muvea, Reference Muvea2015). In this study, a maximum conservative adoption rate of 1% was assumed. The experts also maintained that it would take farmers 3 years (adoption lag), after release of the technology for them to adopt the technology. On average, farmers would utilize the technology for 7 years with the technology depreciating at a rate of 4% per annum, before reaching the plateau adoption level. Success rate was estimated at 47%. In the sensitivity analysis part of the Results section, we considered the effect of higher adoption rates.
The public programme for developing an IPM strategy for WFT presents a combination of research and diffusion costs. These were obtained from icipe’s work plans and budgets. The value of WFT management depends on French bean and tomato price and quantity assumptions. For the base scenario, we used historic French bean and tomato prices and quantities for the period 2006–2012 obtained from the Ministry of Agriculture and HCDA. We assumed no inflation, reporting present values using a real discount rate of 10%. This was the lending rate in Kenya by the Agricultural Finance Corporation for the purchase of farm inputs during the survey period.
Results and discussion
Descriptive analysis
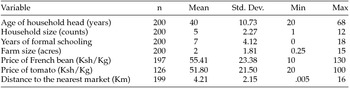
Table 2 reports summary statistics of selected variables for the surveyed households. The average age and years of formal education of the household head were relatively high and estimated at 40 years and 7 years, respectively. This was expected, since French bean and tomato are high value crops. The average price of French bean estimated at Kshs 55 per kg was lower than the average world market price, which was Kshs 128 per kg (HCDA, 2014). This was expected, since Kenya was assumed to be a small exporting country. According to HCDA (2014), the price of tomato per kg was Kshs 29. This was much lower than our estimated average price of Kshs 51 per kg. This was attributed to the shorter distances to the nearest market, which averaged 4 km (Chamberlin and Jayne, Reference Chamberlin and Jayne2013).
Descriptive statistics of selected variables for the surveyed households in Mwea and Loitokitok sub-counties, Kenya

Note: The exchange rate at the time of the survey was approximately 85 Kenyan Shillings per dollar (KSh/US$).
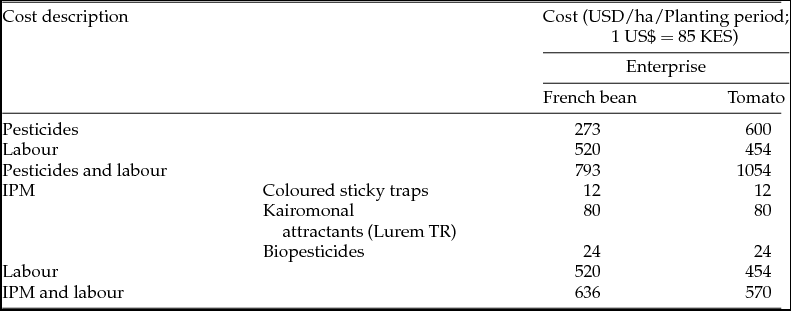
On average, the cost of pesticides was US$1054 per ha/season on tomato and US$793 on French bean (Table 3). The cost incurred in application of the IPM package (use of coloured sticky traps, kairomonal attractants that have lures for attracting thrips and biopesticides) was estimated through field experiments, at US$ 570 on tomato and US$ 636 on French bean.
Cost of pesticides, IPM and labour per season of tomato and French bean in Kenya

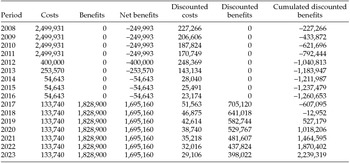
For the base or ‘most likely’ scenario, the cost stream comprised annual project costs since inception in the year 2008 (Table 4) to 2013 when IPM research came to an end. Based on expert opinions, a research lag of 3 years was expected and farmers would adopt the technology on average, for 7 years. During the research lag and all through the adoption period, the project would carry out extension activities at the rate of US$5 per farmer per annum (Gaaya, Reference Gaaya and Plaza1994). Assuming that 10% of French bean and tomato growers would be reached, the cost of extension would be US$54,643 per annum.
Results of the financial Cost–Benefit Analysis (in USD) of investment from 2008 to 2013 in research on integrated thrips management on tomato and French bean in Loitokitok and Mwea sub-counties of Kenya.

Sum of discounted costs = 1,536,783.
Sum of discounted benefits = 3,776,102.
NPV = 2,239,319 IRR = 23.26 BCR = 2.46.
One percent of the farmers were assumed to adopt the technology from the year 2017 to the year 2023. Within this period, the cost of adoption was added to the cost of extension. Benefits were assumed to accrue to farmers from the year 2017. Changes in total surplus of both French bean and tomato were adjusted by the number of farmers assumed to benefit from the knowledge and information generated from the project, and these adjusted, but uncertain, benefits compared to the research costs, and discounted using a discount rate of 10% to calculate the NPV, the IRR and the BCR of the research.
The net benefit stream is shown in Table 4. The NPV of the research regarding the assumptions made for the calculation was estimated at US$2.2 million, with an IRR of 23% and a BCR of 2.46. The estimated NPV of the proposed IPM thrips project indicates attractive returns, even with the cautious assumptions made about likely adoption rates. The estimated IRR can be compared to market rates on alternative investments. Most longer run, low-risk, private-sector investments yield rates of return of around 8–10%, for example, suggesting this research investment would have returns three times as high as alternative investments. These findings are consistent with findings by Gajanana et al. (Reference Gajanana, Krishna Moorthy, Anupama, Raghunatha and Prasanna Kumar2006) who assessed the economic impact of adoption of IPM in tomato in India. The authors employed partial budgeting technique and estimated the BCR at 3.66.
Sensitivity analysis
Since economic evaluation is a predictive tool, it is difficult to determine accurately what a technology's benefits and costs will be in the future. Future values are difficult to predict and there will always be some uncertainty about the analysis results (Qaim, Reference Qaim1999; Edmeades and Smale, Reference Edmeades and Smale2006). A sensitivity analysis is the comparison of outputs from a model, given certain changes in model structure or model input. It aims to ascertain how the model depends upon the information fed into it, upon its structure, and upon the framing assumptions made to build it (Qaim, Reference Qaim1999).
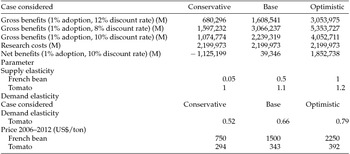
This study attempted to assess the impact of research investments that were yet to be adopted, with uncertain timing of benefits and adoption of knowledge and information generated from the research. It was thus important that an analysis of the sensitivity of the results to some of the assumptions or estimates that were used in the economic surplus model was carried out. We evaluated sensitivity of these results to four key parameter assumptions: elasticity of supply, elasticity of demand, discount rates and adoption levels. For simplicity, we developed three sensitivity analysis scenarios by varying all four key parameters. Table 5 reports the parameter assumptions and the corresponding estimated results.
Sensitivity analysis of net returns to research and outreach for IPM of western flower thrips, 2008–2023 (in $)

The conservative case has lower estimated IPM research benefits by assuming a lower IPM adoption rate, lower French bean and tomato prices, and lower demand and supply price elasticities. Results of the sensitivity analysis bracket the base scenario estimate of US$0.4 million in net benefits to IPM research and outreach for WFT during 2008–2023 (Table 5). The conservative estimate of net benefits equals US$1 million, a 30% reduction from the base scenario. The optimistic case yields an estimate of net benefits of US$1.8 million.
Context for the findings
Hristovska (Reference Hristovska2009), in his study of the economic impacts of IPM in developing countries, found that the tomato IPM programme in Albania, the plantain IPM programme in Ecuador and the tomato IPM programme in Uganda resulted in net present values of approximately US$8 million, US$7 million and US$1 million, respectively. We estimated the NPV of the tomato and French bean IPM research at US$2.2 million. The higher NPV estimated from our study is because our results encompass the NPV for both tomato and French bean. Furthermore, French bean is a high value export crop.
Conclusion
Thrips represent an immense threat to the vegetable industry in Kenya, especially for tomato and French bean production. Use of synthetic pesticides has resulted in adverse human and environmental effects, in addition to exerting pressure on production costs and pest resistance. This study has demonstrated that icipe’s integrated thrips management strategy is a more sustainable and efficient alternative to minimizing extensive use of pesticides in tomato and French bean production in Kenya. Using the economic surplus approach, results show investment in IPM research and outreach yields positive returns over an estimated period of 16 years, from the inception of IPM research to the maximum adoption of the technology. The net present value within the same period is US$2.24 million ($0.14 million every year), while the Internal Rate of Return and benefit–cost ratio is 23.3 and 2.46%, respectively. The results thus support development and dissemination of the IPM strategy for combating thrips in tomato and French bean production. In economic impact assessment, periodic revision and update of production budgets, price information, experimental data and adoption profiles are necessary. Further research on uncertainty analysis using the Monte Carlo simulation, to determine the influence of uncertain assumptions on the balance (net present value), is worth considering.
Acknowledgements
This study was funded by BMZ (the German Federal Ministry for Economic Cooperation and Development) through the GIZ (Deutsche Gesellschaft für Internationale Zusammenarbeit) funded project entitled ‘Implementation of integrated thrips and tospovirus management strategies in smallholder vegetable cropping systems of Eastern Africa’ (Project no. 11.7860.7-001.00, contract no. 81141840). We also gratefully acknowledge core support to icipe, Kenya provided by UK Aid from the UK Government, Swedish International Development Cooperation Agency (Sida), the Swiss Agency for Development and Cooperation (SDC), Federal Ministry for Economic Cooperation and Development (BMZ), Germany and the Kenyan Government. The views expressed herein do not necessarily reflect the official opinion of the donors. We are also indebted to our project colleagues, Patrick Onchieku, Jane Maundu, Josephine Simiyu, Jacqueline Oseko and Wilfred Yako for supporting this study with data and for valuable discussions. We appreciate the staff members that were involved in this study from the Ministry of Agriculture, Livestock and Fisheries (MOALF) and the Kenya Agricultural & Livestock Research Organization (KALRO).