Although a large variety of methods to estimate party policy positions exist, there is a need for a flexible, tailored approach to estimating party positions in cases where information is scarce or country-specific sources of differences in party policy play a role. A confrontational approach to the measurement of party positions, which focuses on a limited number of specific policy items that capture the policy differences between parties on an issue dimension, has been shown to provide such measurements (Pellikaan, Van der Meer and De Lange Reference Pellikaan, Van der Meer and De Lange2003; Pellikaan, De Lange and Van der Meer Reference Pellikaan, De Lange and Van der Meer2007; Gemenis and Dinas Reference Gemenis and Dinas2010). Thus far, however, analyses using the confrontational approach have not included an estimate of uncertainty of party positions (Pellikaan, Van der Meer and De Lange Reference Pellikaan, Van der Meer and De Lange2003; Pellikaan, De Lange and Van der Meer Reference Pellikaan, De Lange and Van der Meer2007; Gemenis and Dinas Reference Gemenis and Dinas2010). We address this problem by restating the confrontational approach as an ordinal item response theory (IRT) model. This provides researchers with estimates based on a properly specified model of party positions and the uncertainty that is associated with the party position estimates.
We will first shortly discuss the theory behind the confrontational approach, to outline its use in addition to existing methods of estimating party positions. Next, we reformulate the scaling method as a Bayesian IRT model, which provides us with uncertainty estimates. We illustrate the use of these estimates with data from Dutch election manifestos and European election manifestos in France, Ireland and the Netherlands.
The Confrontational Approach
The confrontational approach offers a tailored method of analyzing party manifestos. Its aim is to provide valid measurements of party policy positions in particular settings, rather than comparing party positions across many countries and years. The method is complementary to alternative ways to measure party policy positions such as expert surveys (Laver and Hunt 1992; Benoit and Laver Reference Benoit and Laver2006; Bakker et al. Reference Bakker, Vries, Edwards, Hooghe, Jolly, Marks, Polk, Rovny, Steenbergen and Vachudova2015; Rohrschneider and Whitefield Reference Rohrschneider and Whitefield2012) and content analysis techniques that are aiming to provide comparative measurements such as the Comparative Manifesto Project (CMP) (Budge Reference Budge2001; Klingemann et al. Reference Klingemann, Volkens, Bara, Budge and McDonald2006). This comparative approach usually comes at a cost in terms of measurement validity for particular settings.
The confrontational approach is a straightforward method that relies on hand coding of party positions on a limited number of relevant policy items. The basic assumption of the method is that it is possible to capture policy positions of political parties by determining their positions on a small number of specific policy items on which, in principle, divergent positions can be taken. This assumption is best understood when contrasting it with the saliency theory of political competition, which states that parties on many issues take relatively similar issue positions; they compete rather by selectively emphasizing certain issues over others (Budge Reference Budge2001). For example, very few parties would argue that the preservation of environmental beauty is a bad thing, but some find it more important than others. Similarly, (almost) everyone favors economic growth, but some find it more important than, for example, social welfare, whereas others do not.
It has been pointed out before that the saliency approach conflates issue position and issue saliency: in terms of the saliency theory these are not separate, but (left-right) positions can be derived from measuring parties attention to “leftist” and “rightist” issues (cf. Benoit and Laver Reference Benoit and Laver2006, 66). We agree with Kriesi et al. (Reference Kriesi, Grande, Lachat, Dolezal, Bornschier and Frey2006, 930–1) that it is better to separate parties’ policy position on an issue and the saliency they attach to it. Whether or not saliency and position are related is an empirical question. According to a recent study by Dolezal et al. (Reference Dolezal, Ennser-Jedenastik, Müller and Winkler2014, 57) the “core assertion [of the saliency theory] (…) fails to materialize in the majority of cases.”
The confrontational approach is concerned with parties’ policy positions rather than issue saliency. It stems from the observation that the electoral competition between political parties can be summarized very well by looking at specific issues on which they disagree (Kriesi et al. Reference Kriesi, Grande, Lachat, Dolezal, Bornschier and Frey2006, 931). For virtually each policy dimension there are specific items of disagreement between parties. For example, parties’ positions on the well-known “Taxes versus Spending” dimensions may in a particular country at a particular time be captured very well by looking at debates on cutting pensions, increasing tax levels for the rich or increasing the fuel allowance. As the confrontational method is related to IRT, as we will outline below, we call these specific issues items. By coding party positions on a number of items that represent the policy dimension correctly, we can establish party policy positions on virtually any dimension that is of interest to the researcher. The main requirement is that documentary sources, such as election manifestos or parliamentary debates, provide enough material to establish parties’ positions on items relating to the policy dimension.
Party positions on items can be expressed in terms of a three-or higher point scale. We prefer a three-point scale (agree, neutral or disagree with a specific item) over a five-point scale, because it is generally easier to determine the direction of the position of a party (does it agree or disagree with a specific item?) than to capture the intensity of this position (does the party fully agree or agree?). Selecting multiple items per dimension enables us to sufficiently discriminate between extreme and moderate parties.
It will usually be impossible to score party positions on all selected items: not all parties comment on all items. The question is how to deal with this missing information. We argue that, in line with what earlier applications of confrontational theory have done (Pellikaan, Van der Meer and De Lange Reference Pellikaan, Van der Meer and De Lange2003), it is reasonable to assign a neutral score to these “non-positions.” After all, parties are free to take positions on any issue they wish and they are, certainly in the context of election manifestos, not bound by restrictions of length as the manifestos are no longer printed but placed on the websites of parties.
The manifestos are an integral part of the political competition between parties. Parties must choose among conflicts and “the reduction of the number of conflicts is an essential part of politics” (Schattschneider Reference Schattsneider1960, 64). The choice of having a position of pro and contra on some issue is the choice of conflicts a party wants to compete. Take, for example, the legalization of euthanasia in the Netherlands in 2001. In all subsequent elections, the orthodox Christian parties (CU and SGP) stated that they are against legalizing euthanasia and want to abolish this legislation. Contrarily, the social liberals (D66) want to extent the grounds for euthanasia and have included this in their manifestos since 2002. All other parties have no desire to change the status quo of 2001 concerning the law that legalizes euthanasia and therefore keep quiet on the issue in their manifesto. Our three-point scale measures policy change in two opposite directions (restricting versus broadening euthanasia); the middle position represents the status quo. If a party has no desire to change the status quo—for whatever reason—then it gets a zero score. We will discuss this assumption in greater detail below and show how researchers who do not want to make the assumption that keeping quiet means support for the status quo can treat these non-positions as missing data.
Existing applications for the confrontational approach have used a simple additive model to aggregate parties’ positions on specific items into an estimate of their position on a policy dimension (Pellikaan, Van der Meer and De Lange Reference Pellikaan, Van der Meer and De Lange2003; Pellikaan, De Lange and Van der Meer Reference Pellikaan, De Lange and Van der Meer2007; Gemenis and Dinas Reference Gemenis and Dinas2010). For example, if a party scored −1 on five items, 0 on three items and +1 on two items, its position on the dimension would be calculated as −5+2=−3. Unlike other methods of estimating party positions, users of the confrontational approach have not yet provided confidence intervals for their estimates.
The Confrontational Approach as an IRT Model
Our goal is to provide estimates of the uncertainty associated with confrontational estimates of party positions. For example, if a party is located one point to the left of another party, how sure can we be that this party is really more left wing than its competitor? It may very well be that the situation might be reversed with a different selection of items, even if the items are carefully selected. Many research questions require an uncertainty estimate of party positions in order to be answered. For example, if one wants to make the claim that one party is to the left of another party or that a party has changed its position over time it is necessary to have an estimate of uncertainty.
Uncertainty estimates can be obtained by restating the confrontational approach as a special case of an IRT model. These models have been applied successfully to estimate legislator’s ideal points based on roll call voting behavior (Clinton, Jackman and Rivers Reference Clinton, Jackman and Rivers2004). The items used in a confrontational analysis are, in many ways, very similar to roll calls in that a party either supports or rejects a particular proposal. Just as with roll call data sets, a confrontational approach data matrix contains mainly “plusses” and “minuses.”
The estimation of these roll call vote models relies on Bayesian methods, which allows estimation of the model through Markov Chain Monte Carlo (MCMC) simulation. In addition, the Bayesian approach allows researchers to take into account prior beliefs about parties’ positions (if available).
There is one important difference between the confrontational approach and the analysis of roll call votes. The data set of a confrontational-style study generally contains a substantial number of “zero scores”: instances at which a party took neither a “pro” nor “contra” stance on an item. A party may be ambiguous about a particular item or may simply not mention it in an effort to maintain the status quo. In the standard roll call model, these positions would be treated as (randomly) missing data. However, in this case, the data is not really “missing”: a zero score is substantively meaningful, as we argue above (Rosas, Shomer and Haptonstahl Reference Rosas, Shomer and Haptonstahl2015). Therefore, we estimate parties’ positions using an ordinal item response model, which differentiates between “pro,” “neutral” and “contra” positions on items (Treier and Jackman Reference Treier and Jackman2008; Rosas, Shomer and Haptonstahl Reference Rosas, Shomer and Haptonstahl2014).Footnote 1 In our empirical illustration, we will explore the differences between our approach and treating zero scores as missing. Eventually, researchers applying the confrontational method will have to decide if they are willing to make the assumption that a zero score implies support for the status quo. In contrast to the existing additive scale, the IRT model is easily adapted to either situation.
The model is specified as follows. Let the party positions on a specific item be measured on a three-point scale, 1 (contra), 2 (neutral) or 3 (pro). Then the probability:
 $$\eqalignno{ {\rm Pr(}y_{{ij}}\,=\,{\rm 1)}= \,& F(\tau _{j_{\rm 1}} {\minus}x_{i} \beta _{j} ), \cr {\rm Pr(}y_{{ij}} ={\rm 2)}= \,& F(\tau _{j_{{\rm 2}}} {\minus}x_{{\rm i}} \beta _{{\rm j}} ){\rm }{\minus}F(\tau _{j_{{\rm 1}}} {\minus}x_{i} \beta _{j} ), \cr {\rm Pr(}y_{{ij}} ={\rm 3)}=\, & {\rm 1 }{\minus}F(\tau _{j_{{\rm 2}}} {\minus}x_{i} \beta _{j} ), $$
where y ij is the score of party i∈I on item j∈J, τ j a vector of length two containing the cut-points for item j, x i the unobserved party position of party i and β j the item discrimination parameter. F(⋅) the normal cumulative density function (a probit link).
For the x
i
we use standard normal priors and for the β
j
parameters we employ normal priors with a mean of 0 and variance 4. For the threshold parameters τ
j1 and τ
j2 we use an ordering constraint to make sure that the first cut-point has a lower value than the second. The first cut-point follows a normal prior with mean 0 and variance
 $6{2 \over 3}$
. The second cut-point equals the sum of the value of the first cut-point and δ
j
which is assigned an exponential prior with mean 0.5 (Treier and Jackman Reference Treier and Jackman2008). The model is identified by excluding an intercept β
0 from the model and setting the scale of the error density σ to 1. The values of x
i
are constrained to have mean 0 and variance 1.Footnote
2
The model was estimated using an MCMC algorithm in JAGS 3.4, using code based on Rosas, Shomer and Haptonstahl’s (Reference Rosas, Shomer and Haptonstahl2014) study. We provide R code that makes it possible to run this model without knowledge of JAGS/BUGS; this should enable applied researchers to use this procedure for their own data.
Empirical Illustration
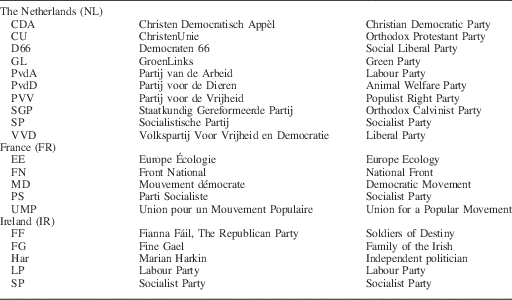
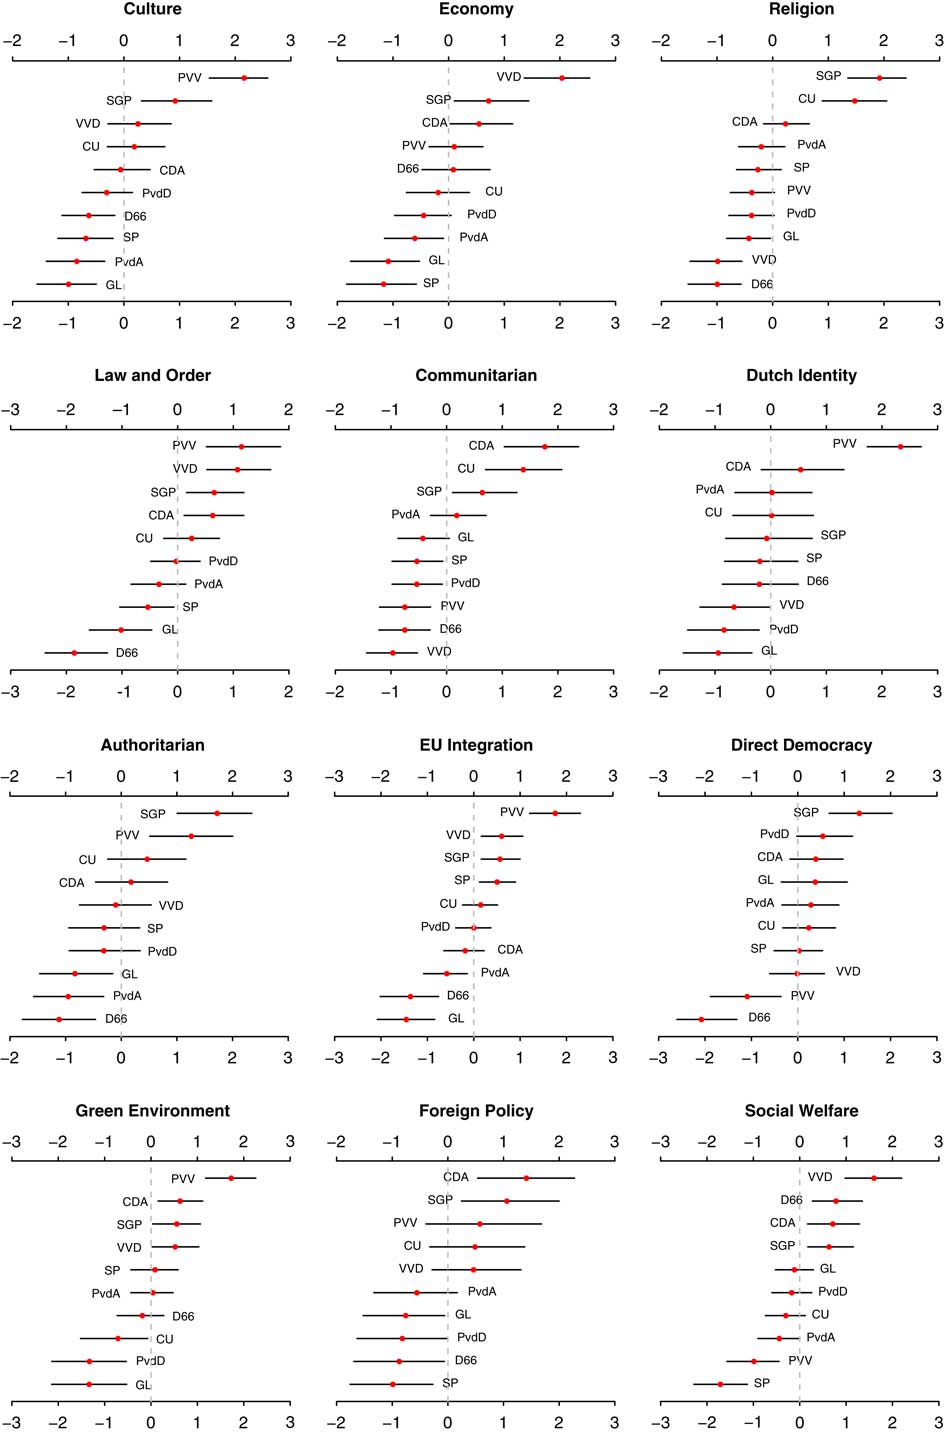
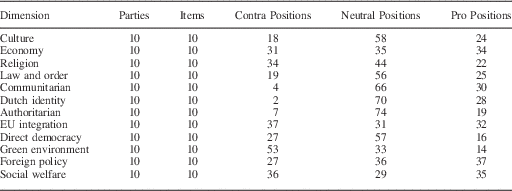
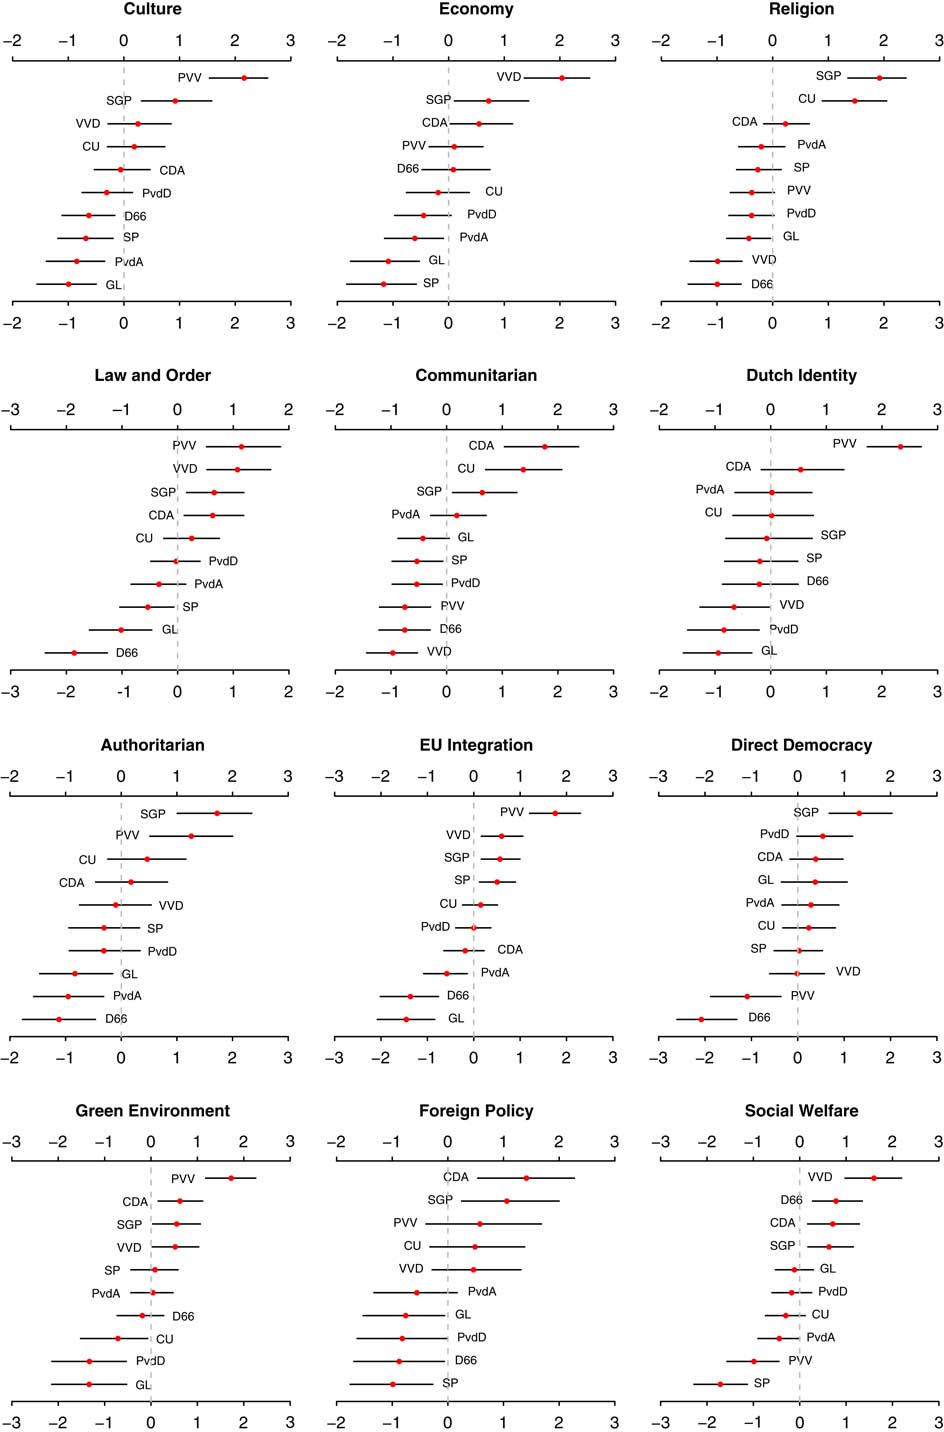
We illustrate the approach using 12 policy dimensions for the Dutch national elections of 2010. The data, derived from parties’ election manifestos, were collected by the second author and contains ten items for each policy dimension (see Table 1). Parties’ ideal point estimates are displayed in Figure 1.Footnote 3 The religious dimension illustrates the classic Dutch antithesis between the religious parties (SGP, CU and CDA) on the one hand and the secular parties on the other, and with the Liberal Party (VVD) and the Social Liberals (D66) at the other end of the dimension. The economic dimension shows the distinction between the economic rightist parties (VVD, SGP and CDA) and the leftist parties (SP, GL and PvdA). The religious and economic dimension are frequently used to describe the Dutch political space (Lijphart Reference Lijphart1982; Schofield Reference Schofield2008, 139). The social movement of the 1960s has made new dimensions salient such as direct democracy, green environment, social welfare and the authoritarian dimension, which show a different ranking of parties. The globalization of West European politics (Kriesi et al. Reference Kriesi, Grande, Lachat, Dolezal, Bornschier and Frey2006) has made other new dimensions salient like the cultural dimension, Dutch identity and EU integration. These dimensions can shed some new light on the positions of parties in the political competition. For example, the PVV is often referred to as a radical right-wing populist party, and this label suggest that the PVV would be on the right side of most dimensions. The PVV has radical right-wing position on the law and order dimension and the cultural dimension, which includes the issues of the multicultural society and integration of foreigners. Moreover, on the EU integration has the PVV an extreme view. However, if we take a closer look at the social welfare dimension, we see that the PVV is close to the SP and the PvdA on this issue, and on the direct democracy dimension is the PVV with D66 supporter of a more decentralized and more democratic form of government. These examples show that we need a high number of policy dimensions to understand the political competition in some party system. According to Schattschneider, there are many potential conflicts and each new political conflict produces a new allocation of power, “but only a few become significant” (Schattschneider Reference Schattsneider1960, 64). With the confrontational approach is it possible to construct tailor-made policy dimensions to analyze a specific political competition. Furthermore, it possible to go back in time and analyze party manifestos from earlier elections to examine the roots of a political conflict. We can show how established parties freeze the political conflict of the multicultural society and how the new parties exploit this political conflict.
Confrontational estimates of party policy positions with uncertainty estimates Note: point estimates with 95 percent credible intervals. For party abbreviations refer to Appendix A.
Characteristics of the Data on Party Policy Positions on 12 Issue Dimensions (the Netherlands, 2010)

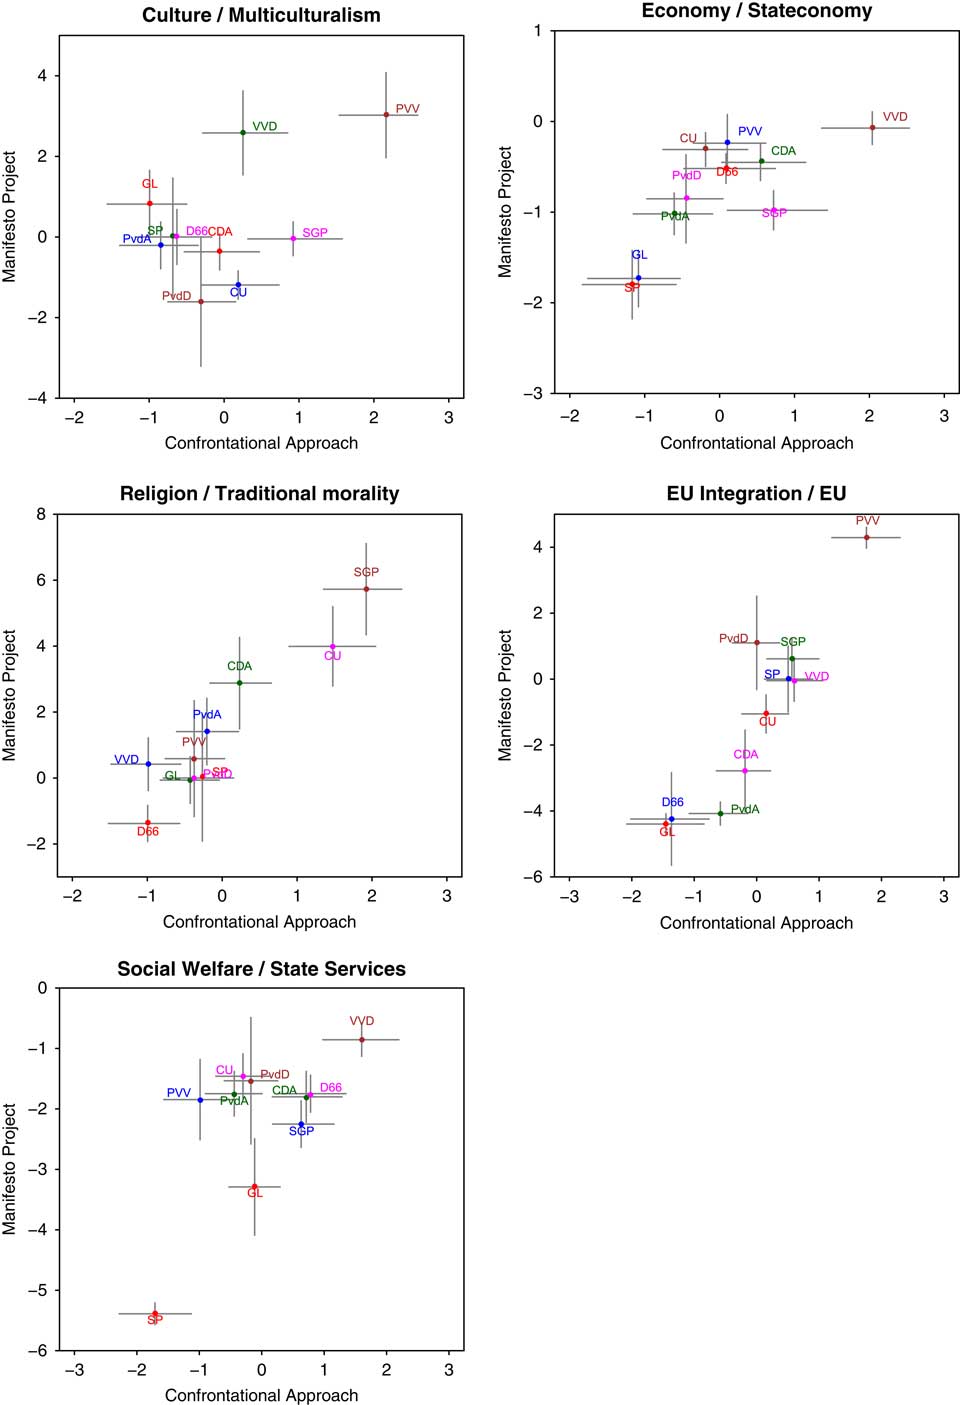
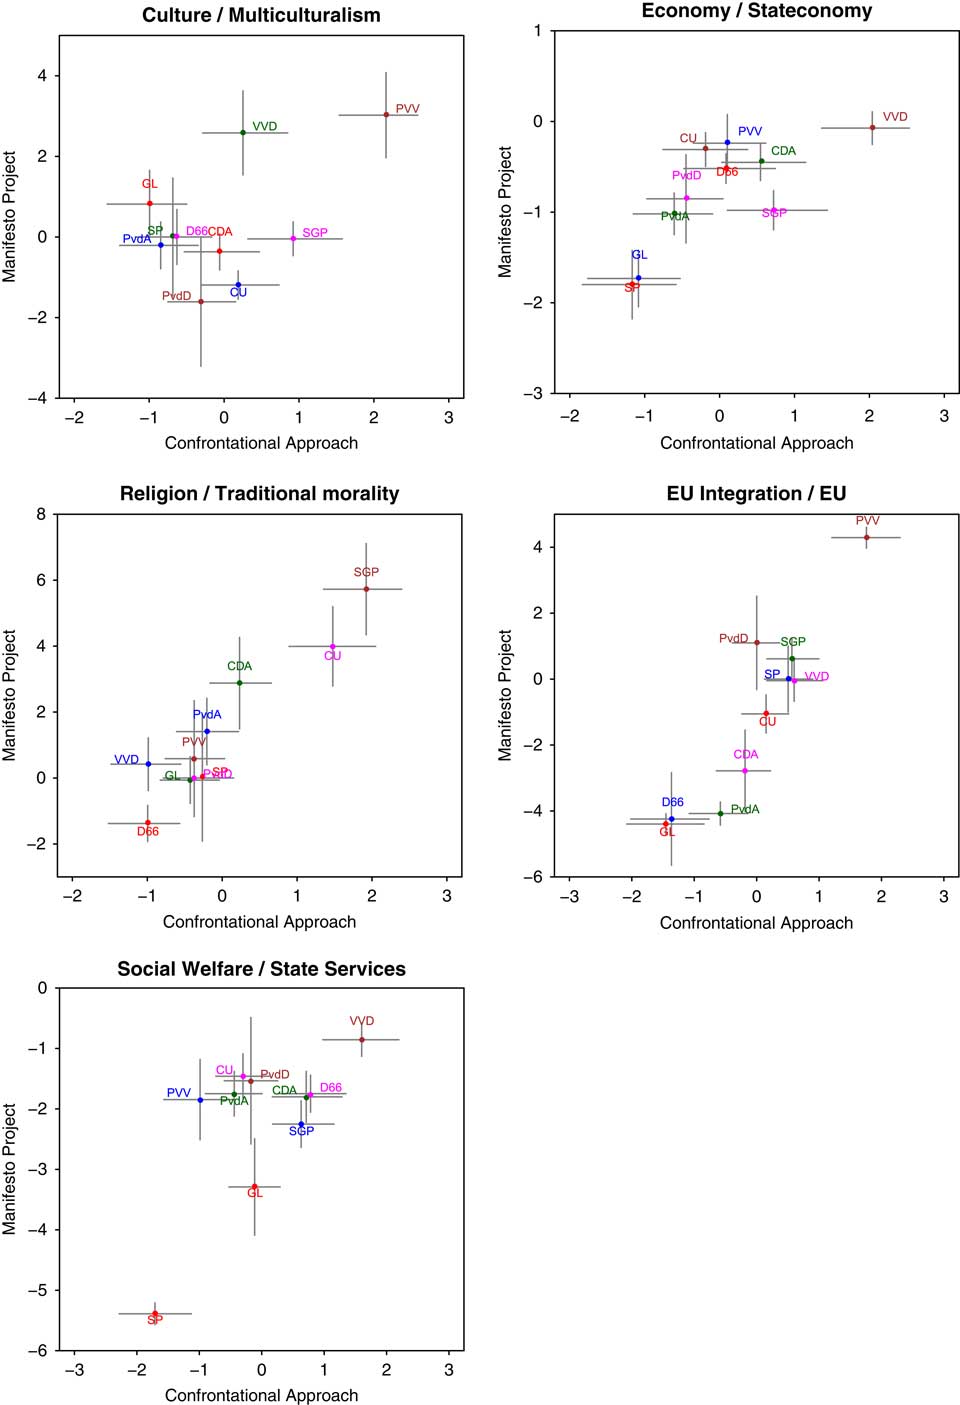
Figure 1 displays 95 percent Bayesian credibility intervals, which indicate that we can be 95 percent sure that the (unobserved) ideal point of a party lies within this interval. To some researchers, these credibility intervals might seem relatively wide. However, the uncertainty associated with the confrontational estimates is comparable with the uncertainty inherent in other manual content analysis techniques. To illustrate this, we compare the uncertainty of our confrontational estimates to the uncertainty of estimates derived from the CMP for similar issue dimensions. Figure 2 provides the confrontational and CMP estimates for five comparable policy dimensions.Footnote 4 For those dimensions about which parties write a lot in their manifesto, the CMP estimates are more certain, but the confrontational credible intervals are smaller for issues on which parties talk less such as Religion, EU integration and Culture for some parties. This indicates that the confrontational approach works particularly well when dealing with short manifestos and less discussed issues.
Comparing confidence/credible intervals for confrontational and manifesto project estimates Note: figure includes point estimates and 95 percent credible/confidence intervals. For party abbreviations refer to Appendix A.
Particular research questions may need more certain party ideal point estimates than the ones produced here. In those cases, the most straightforward course of action would be to increase the number of items. By including more items, one can learn more about parties’ ideal points. This would be a particularly appropriate strategy when dealing with very salient issues or longer party manifestos, that is, in those cases in which more items can easily be found. Another means of reducing uncertainty is to include informative prior beliefs about parties’ positions in the analysis. For example, we could use mass survey or expert survey estimates of party positions as “prior beliefs.” This would lead to more certain estimates of parties’ ideal points. If we use the Chapel Hill Expert Survey estimates as priors in our analysis, taking into account the variance in expert estimates, we are able to reduce the width of the confidence intervals by 25 to 42 percent, whereas the point estimates remain largely the same as in the models with flat priors (0.82<r<0.98 and 0.60<τ<0.96). In general, the reduction of the width of the credible interval is larger when the CHES and Confrontational estimates were more alike: in those cases all information regarding parties’ positions points in the same direction, which strengthens our posterior beliefs about them. If the priors correspond to the data, the party position estimates are likely to be similar to the model without the addition of information on prior beliefs, but more certain. The use of prior information is, therefore, likely to provide more efficient estimates of parties’ positions.
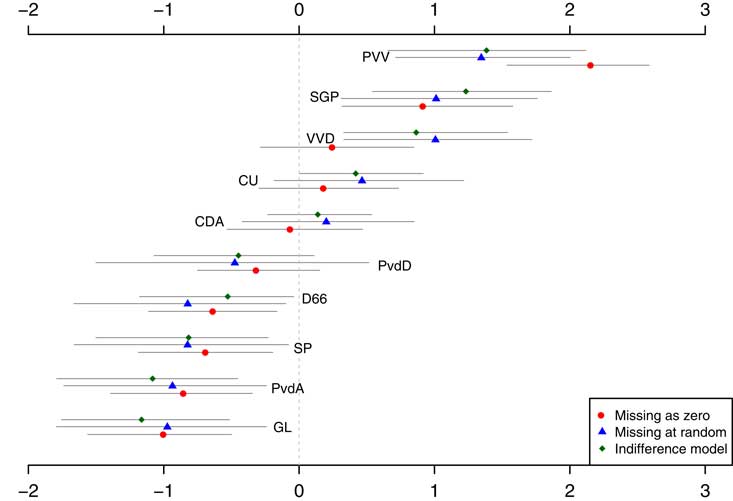
We have argued that for our manifesto data, it makes sense to treat parties being silent on an item as support for the status quo. What would happen to our estimates if we would not be willing to make this assumption? Figure 3 displays estimates according to three methods of dealing with missing scores: (a) treating missing scores as zero scores, support for the status quo, (b) treating missing scores as randomly missing, not providing any information on a party’s position on the dimension and (c) by applying an indifference model (Rosas, Shomer and Haptonstahl Reference Rosas, Shomer and Haptonstahl2014), stating that parties that are likely not to mention an item if it is close to the status quo.Footnote 5 We use the cultural dimension, which is particularly instructive, for one party supports all items, whereas other parties support or reject only a few. Although the ordering of parties is very similar for each method, the “missing as zero” approach estimates the PVV to be much more extreme than in the other two approaches. The reason is that the PVV supports all items on this dimensions, whereas SGP and VVD, support only six and three, respectively. None of these parties explicitly rejects any proposal. If we assume that the silence of the VVD on many issues is informative of their position (they might think that some of the proposals are so extreme that they would not even merit them with a rejection), it makes sense to estimate the PVV as far more extreme than the VVD. If we, however, make the missing at random assumption, it might very well be that the VVD is equally monocultural as the PVV, but just fails to mention a number of items in the manifesto. Therefore, the two parties are estimated to take a similar position according to the missing at random approach.
Different approaches to missing data (Culture dimension) Note: point estimates with 95 percent credible intervals. For party abbreviations refer to Appendix A.
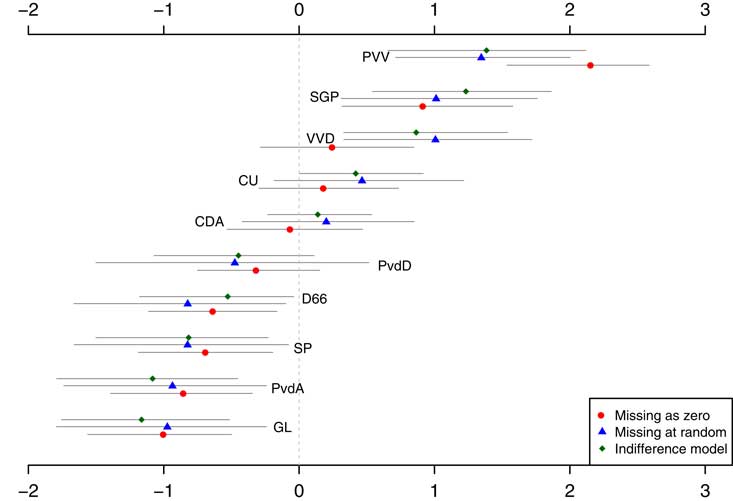
For the other parties, the point estimates are quite similar between the different approaches to missingness. The credible intervals for the “missing at random” approach are generally wider, reflecting the assumption that we cannot derive any information from a party’s missing stance on an item. This effect is stronger for parties in the center, which generally mention only a few items. The indifference model yields a compromise between the other two, both in terms of the point estimate and credible intervals.
We would argue that for this example of manifesto data, the estimates of the “missing as zero” yields more valid estimates. However, if one would estimate policy positions by analyzing other sources, like newspapers or editorials in newspapers (Kriesi et al. Reference Kriesi, Grande, Lachat, Dolezal, Bornschier and Frey2006), the missing at random approach can be appropriate.
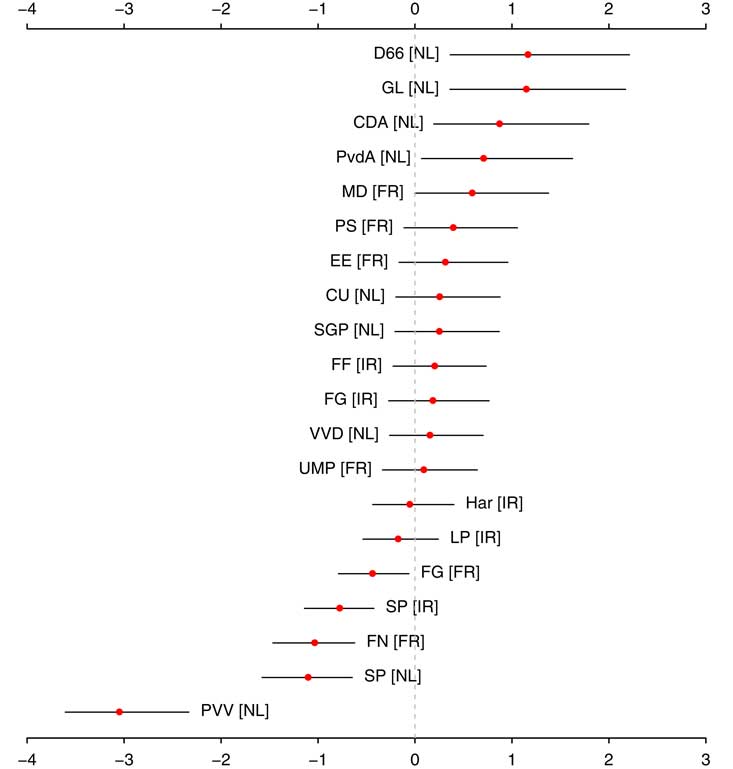
An analysis in the confrontational fashion need not be limited to a single election in a single country. As long as one can find items that are comparable over time or across space, it is possible to apply the confrontational method. We take the 2009 European election manifestos in the Netherlands, France and Ireland as an example. These countries have rejected the European Constitution or the Lisbon Treaty in a referendum, which poses the question whether these countries differ in terms of parties’ positions regarding European integration. We identified 20 items regarding both “economic” and “political” integration. These items combine very well into a single European integration dimension (Loevinger’s coefficient of homogeneity=0.51). We analyzed this data set using the IRT specification of the confrontational approach presented above. This yields the party position estimates displayed in Figure 4.
Estimated party ideal points on European Integration dimension Note: lines indicate 95 percent credible intervals. Figures are based on a single Markov Chain Monte Carlo (MCMC) run with 50,000 iterations (after discarding the first 5000 as burn-in). For party abbreviations refer to Appendix A.
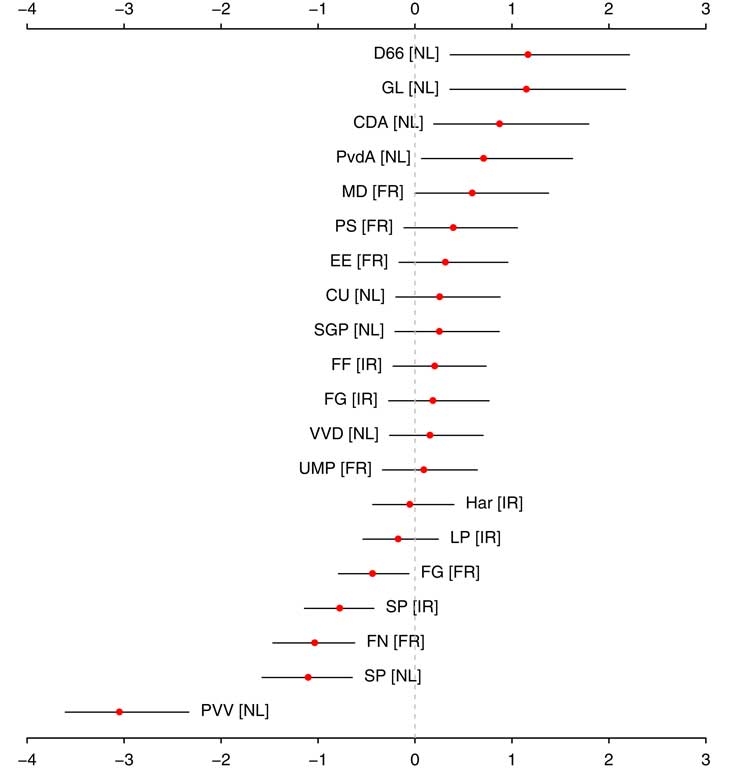
The most pro-European party is the Dutch social liberal party (D66), which campaigned with a clearly pro-European program. The populist right party, Party for Freedom (PVV), from the Netherlands is most clearly opposed to European cooperation: it basically wants to limit the extent of European cooperation to the free market. A number of other parties also oppose further Europeanization but they do not reject each and every item outright (the French Front National, the Irish Socialist Party and the Dutch Socialist Party).
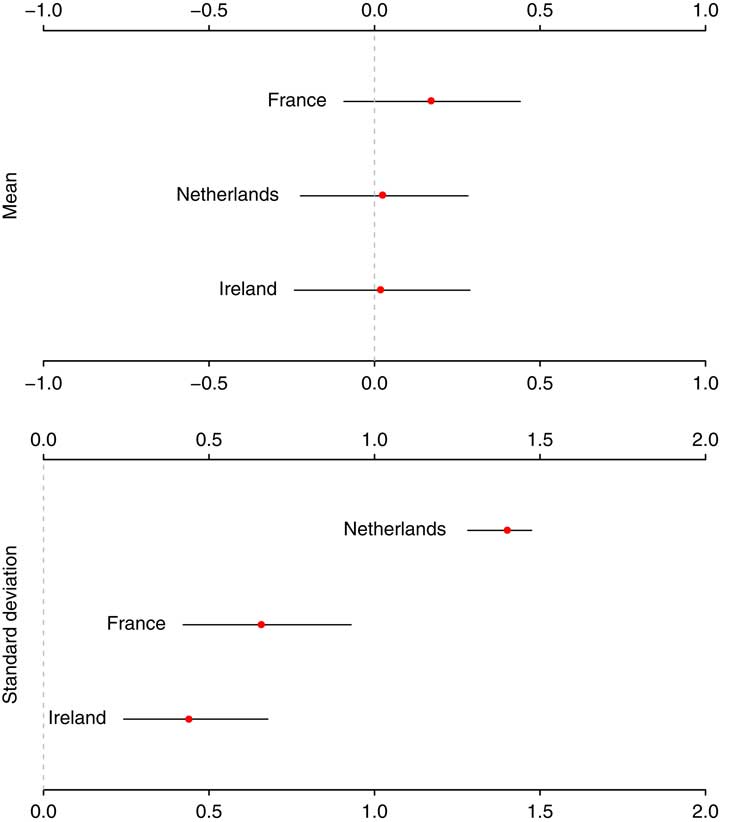
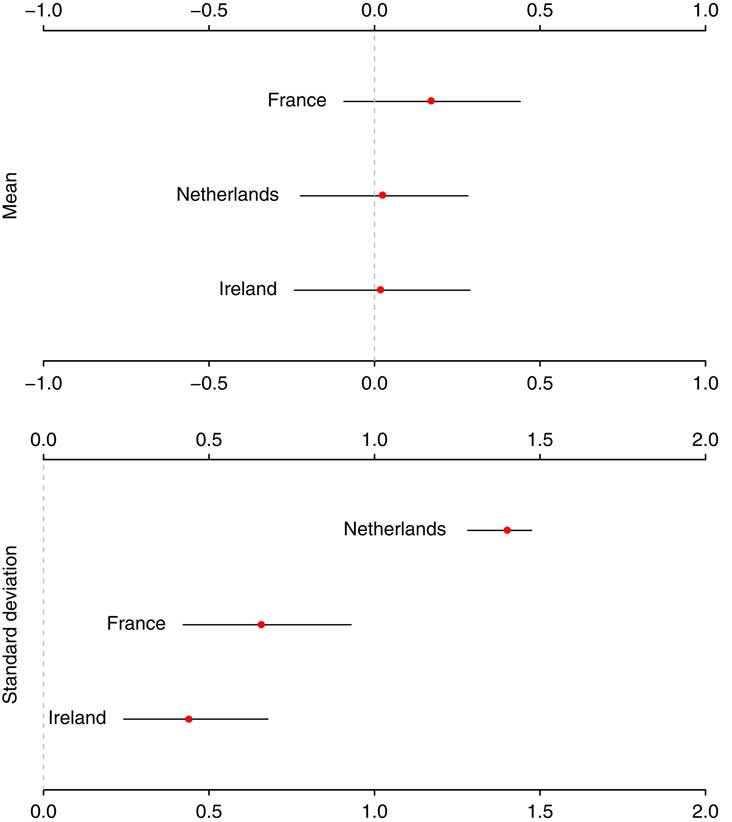
Using the uncertainty estimates associated with the confrontational position estimates, we can examine whether Dutch, French and Irish parties took different positions on European integration. The top panel of Figure 5 shows that in fact the mean position of political parties (weighted by the number of seats) is rather similar in each country. None of the differences between countries is statistically significant, as can be directly analyzed from the posterior distribution (p>0.05). Despite a lack of variation in the mean position of parties, there is a large and significant difference in the standard deviation of party positions per country. We can be very confident that there is a large standard deviation in the scores of the Dutch parties, which is exemplified by the fact that both the most pro-European and the most anti-European party are Dutch. The standard deviation of Dutch party positions is significantly larger than the standard deviation in France (p<0.01), which is in turn larger than the standard deviation in Ireland, but this difference just falls outside of conventional levels of significance (p=0.06). The average position of parties is similar between countries, but there is significant variation in the degree of polarization.
Estimates of party positions on EU integration per country Note: the mean scores for parties are weighted by the number of seats parties have in the European Parliament. Lines indicate 95 percent credible intervals.
The above analysis illustrates that the confrontational approach is suitable for single case as well as comparative research. The advantage of the confrontational approach lies primarily in its flexibility. It allows researchers to estimate parties’ positions on specific aspects of European integration, such as common defense policy or common agricultural policy, which are not available from expert surveys or pre-defined manifesto coding schemes.
Conclusion
The confrontational approach provides a tailored way to estimate party policy positions. Previous analyses have applied the approach by creating additive scales of specific issues, which together formed policy dimensions. Although this is generally a straightforward and valid method, it lacks a method to estimate the uncertainty associated with the point estimates obtained. Noting the similarity between estimates of roll call behavior and party positions as measured by the confrontational approach, we have provided a way to redefine the confrontational approach as an IRT model (Rosas, Shomer and Haptonshal Reference Rosas, Shomer and Haptonstahl2014).
The ability to estimate the uncertainty of party position estimates is central to the “value of a data set as a scientific resource” (Benoit, Laver and Mikhaylov Reference Benoit, Laver and Mikhaylov2009). It allows researchers to distinguish between differences between parties that might be the result of measurement error and “real” differences. This is especially important when looking at party position differences in subsequent elections: are (relative) changes in party positions beyond statistical margins of error? By restating the confrontational approach as a Bayesian IRT model, we have increased its capacity from heuristic tool to a means of testing hypotheses on party positions.
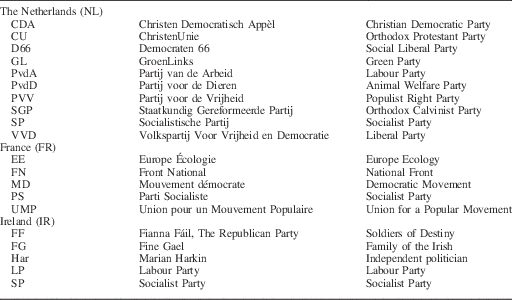
Appendix A
Abbreviations of Party Names