



Introduction
Water shortage is one of the main constraints for cassava growth, starch content of the roots and final production (Santisopasri et al., Reference Santisopasri, Kuroljanawong, Chontineeranat, Piyachomkwan, Sriroth and Oates2001; Janket et al., Reference Janket, Vorasoot, Toomsan, Kaewpradit, Jogloy, Theerakulpisut, Holbrook, Kvien and Banterng2020). Insufficient soil water reduces storage root yield in cassava by about 32% as compared to well-watered crops (Connor et al., Reference Connor, Cock and Parra1981), particularly during the first 6 months after planting (Santisopasri et al., Reference Santisopasri, Kuroljanawong, Chontineeranat, Piyachomkwan, Sriroth and Oates2001). This is the period of the maximum leaf growth rate and dry matter accumulation in the storage root for cassava (Alves, Reference Alves, Hillocks, Thresh and Bellotti2002).
In Thailand, cassava is mostly grown under rain-fed conditions, and the growing areas are mostly in the Northeast region, which has a low distribution of rainfall and less soil water-holding capacity. In this region, cassava has been planted both prior to the start of the rainy season and at the end of the rainy season, to consistently supply cassava flour factories with raw materials. In addition, some farmers aim to reduce plant diseases by rotating crops and planting cassava after sugarcane harvest at the end of the rainy season. When cassava is planted at the end of the rainy season, the crop is generally affected by the dry period during the early growth phase (Connor et al., Reference Connor, Cock and Parra1981). The unavailability of adequate soil moisture during the early growth of cassava in the Northeast of Thailand contributes to low cassava productivity. Using an appropriate cultivar and applying irrigation could help improve cassava productivity in this region.
A study on the performances of different cassava genotypes grown under different total amounts of irrigation could provide valuable information for designing appropriate management practices. Selecting the cassava genotypes for different total amounts of irrigation during the early growth phase is currently of significant interest to plant breeders. Previous studies have looked at the performances in terms of physiology, growth and yield of some cassava genotypes grown under different water regimes during the early growth phase (De Tafur et al., Reference De Tafur, El-Sharkawy and Calle1997; Oyetunji et al., Reference Oyetunji, Ekanayake and Osonubi2007; Vandegeer et al., Reference Vandegeer, Rebecca, Bain, Roslyn and Timothy2013; Srihawong et al., Reference Srihawong, Kongsil, Petchpoung and Sarobol2015; Orek et al., Reference Orek, Gruissem, Ferguson and Vanderschuren2020; Sanket et al., Reference Sanket, Ravi, Saravanan and Suresh2020). However, information from growth analysis that incorporates physiological characteristics, such as SPAD chlorophyll meter reading (SCMR), specific leaf area (SLA), relative growth rate (RGR), leaf area index (LAI) and harvest index (HI) for cassava genotypes grown with a different amount of irrigation during the early growth phase is necessary to design appropriate cassava cultivation practices.
There are reports based on cassava growth analysis for various growing conditions. For example, Phuntupan and Banterng (Reference Phuntupan and Banterng2017) studied the growth rate and physiological determinants of storage root yield of different cassava branching types under different rates of nitrogen fertilizer applications. Phoncharoen et al. (Reference Phoncharoen, Banterng, Vorasoot, Jogloy, Theerakulpisut and Hoogenboom2019) studied the growth analysis and yield of cassava at different planting dates in a tropical savanna climate. A growth analysis for cassava production during the off-season of paddy rice has also been reported by Sawatraksa et al. (Reference Sawatraksa, Banterng, Jogloy, Vorasoot and Hoogenboom2019). These previous studies suggested that a detailed growth analysis not only provides useful information for a better understanding of crop growth habits, but also offers a new criterion for supporting cassava varietal selection for particular production environments.
A study regarding growth analysis of the different cassava genotypes grown under different gradients of watering during the dry period of the early growth stage provides valuable information for understanding the fundamentals of crop growth, which helps support better decision-making for varietal selection and for designing the water management to achieve high productivity. The aim of this study was, therefore, to determine the SCMR, SLA, LAI, RGR and HI for the early growth phase of 20 different genotypes grown under different irrigation levels during the dry period.
Materials and methods
Experimental detail
The experiment was conducted under field conditions from October 2019 to October 2020 (2019/2020) and repeated again from October 2020 to October 2021 (2020/2021) at the Field Crop Research Station of Khon Kaen University, Khon Kaen Province, Thailand (latitude 16°28′ N, longitude 102°48′ E, 200 m above sea level). The soil type for this experimental site is Yasothon Series (Yt: Oxic Paleustults, fine – loamy, siliceous).
The experimental design was a strip-plot with four replications. The strips consisted of three irrigation levels created by a line source sprinkler system (W1 = 100% crop water requirement; 100% ETcrop, W2 = 60% ETcrop and W3 = 20% ETcrop) (Hanks et al., Reference Hanks, Keller, Rasmussen and Wilson1976). The 20 cassava genotypes (Table 1) were assigned randomly within the strips. The size of each experimental plot was 5m × 12 m.
The cassava genotypes used in this study
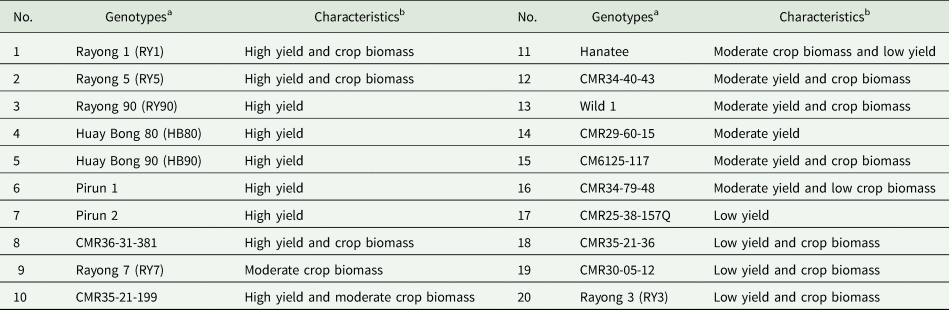
a The cassava genotypes were obtained from Rayong Field Crops Research Center, Thailand, and all genotypes are developed in Thailand.
Prior to planting, conventional land preparation and tillage were conducted according to method used for cassava cultivation in Thailand (Department of Agriculture, 2008). Soil ridges were created with a distance of 1 m between two ridges. The stems for the 20 different cassava genotypes used in this experiment were harvested from the same growing area at 270 days after planting (DAP), and they were cut as stakes to a length of 20 cm. To protect against cassava mealybug, all stakes were soaked with thiamethoxam (3-(2-chloro-thiazol-5-ylmethyl)-5-methyl-(1,3,5)-oxadiazinan-4-ylidene-N-nitroamine 25% WG) water dispersible granules at a rate of 4 g/20 litre of water for 30 min. The cassava sticks were planted by vertically inserting about 2/3 of it into the soil ridge on 17 October 2019, and on 27 October 2020, at a spacing of 1 m between rows and 0.8 m between hills within the row. Weed control was done manually throughout the crop season. At 30 DAP, fertilizer was applied based on soil properties that were determined prior to planting and cassava nutrient requirements proposed by Howeler (Reference Howeler, Hillocks, Thresh and Bellotti2002). The fertilizers carbonic diamide (CH4N2O) and potassium chloride (KCl) were applied at a rate of 46.9 and 56.3 kg/ha, respectively. In addition, the compound fertilizer of N-P2O5-K2O formula 15-7-18 was applied at a rate of 312.5 kg/ha at 60 DAP (Department of Agriculture, 2008). To enhance the uniformity of crop establishment, irrigation was applied to all experimental plots for up to 30 DAP, whereupon the soil moisture was maintained at field capacity to a depth of 60 cm. Irrigation was applied by using a line source sprinkler system from 30 to 180 DAP. The water requirement (ETcrop) for W1 was calculated as described by Doorenbos and Pruitt (Reference Doorenbos and Pruitt1992):

where ETcrop is a crop water requirement (mm/day), ETo is the evapotranspiration of a reference plant under specified conditions calculated by the pan evaporation method, and Kc is the crop water requirement coefficient which varies depending on the crop growth stage. The crop water requirement coefficient of cassava was not available in the literature.
Cassava has a similar duration of crop and growth stage to sugarcane. For cassava, the first 180 DAP is identified as the duration for the development of stems and leaves, and high carbohydrate translocation to roots occurs during 180–300 DAP (Alves, Reference Alves, Hillocks, Thresh and Bellotti2002). Whereas for sugarcane, the time between planting to 150 DAP is the growth stage for tillering and canopy development. The period for yield formation and ripening is 150–360 DAP (NaanDanJain Irrigation Ltd, 2013). However, the duration for the leaf (source) development stage and storage organ (sink) growth stage for cassava are similar to that of sugarcane. Therefore, the crop water requirement coefficient for sugarcane was used for our calculation (Win et al., Reference Win, Zamora and Thein2014). The amount of irrigation for W1, W2 and W3 for the 2019/2020 growing season was 364, 307 and 185 mm, respectively, and for the 2020/2021 growing season was 358, 301 and 174 mm, respectively.
Data collection
The measurement of SCMR was conducted with mature leaves (5th position from the top) for six plants in each experimental plot by using the Minolta SPAD-502 m (Tokyo, Japan). Four plants in the middle rows of each plot were sampled at 180 and 330 DAP. The plants were separated into leaves, stems, storage roots and fibrous roots. Then subsamples comprising of 10% of each of the plant parts were taken. Subsamples of green leaf were used to measure leaf area using a leaf area meter (LI-Cor 3100, LI-COR Inc., Lincoln, NE, USA). The subsamples of all plant organs were oven-dried at 80°C to achieve a constant dry weight. The LAI values were recorded as the amount of leaf area in a canopy per unit ground area. The SLA values were calculated as the ratio of leaf area to leaf dry weight. The HI was determined as the ratio of storage root dry weight to total crop dry weight (Banterng et al., Reference Banterng, Patanothai, Pannangpetch, Jogloy and Hoogenboom2003; Koutroubas et al., Reference Koutroubas, Papakosta and Doitsinis2009). The RGR value from the period of 180 to 330 DAP was calculated using the following equation:

(2)where ln is the natural logarithm and DW1 and DW2 are the dry weight of the plant (grams) at times T 1 and T 2 (days), respectively (Evans, Reference Evans1972). In addition, the daily temperature and rainfall during the experimental period were also recorded by an automatic weather station.
Statistical analysis
Analysis of variance (ANOVA) for each year was performed for all crop characteristics by following a model for strip plot design (Gomez and Gomez, Reference Gomez and Gomez1984) and by using the statistix 10 program (Statistix10, 2013). Mean comparisons were conducted by Duncan's multiple range test (DMRT) using MSTAT-C package (Freed and Nissen, Reference Freed and Nissen1992).
Results
Weather data
The weather conditions based on the data obtained from an automatic weather station for the 2019/2020 and 2020/2021 growing seasons showed that the average daily air temperatures ranged from 17.7 to 34.2°C for the 2019/2020 growing season and from 15.7 to 33.5°C for the 2020/2021 growing season (Fig. 1). For solar radiation, the total amount was 6177.9 MJ/m2 (from 4.4 to 30.3 MJ/m2/day) for the 2019/2020 growing season and 5922.6 MJ/m2 (from 4.1 to 26.2 MJ/m2/day) for the 2020/2021 growing season. The total amount of rainfall was 752.3 mm for the 2019/2020 growing season and 996.1 mm for the 2020/2021 growing season. The rainfall data showed a dry period from November to April (during 180 DAP). Thus, water was a limiting factor during the early growth phase of cassava.
The average daily air temperature (°C), rainfall (mm) and solar radiation (MJ/m2/day) for the 2019/20 and the 2020/21 growing seasons at the Field Crop Research Station, Khon Kaen University, Thailand.

Analysis of variance
The results for the ANOVA (Table 2) indicated that a variance of the different irrigation levels was significant for LAI at 180 DAP for both the 2019/2020 and 2020/2021 growing seasons. Similar results were observed for LAI at 330 DAP for the 2020/2021 growing season, but not for LAI at 330 DAP for the 2019/2020 growing season. There was also significant for a variance of irrigation levels for HI at 330 DAP during the 2019/2020 growing season, but not for the 2020/2021 season. The variances of genotypes and irrigation levels × genotypes were significantly different for all measured traits for both the 2019/2020 and 2020/2021 growing seasons. Irrigation levels shared the largest variation for LAI at 180 DAP for both growing seasons. Genotypes shared the largest variations for LAI at 330 DAP and HI for both growing seasons. For RGR from 180 to 330 DAP, irrigation levels, genotypes and irrigation levels × genotypes were significantly different for both the 2019/2020 and 2020/2021 growing seasons. Irrigation levels shared the largest variation for RGR in the 2019/2020 growing season. The largest variation for RGR in 2020/2021 was recorded for genotypes.
Percentage of sum squares (%SS) for leaf area index (LAI) at 180 and 330 days after planting (DAP), relative growth rate (RGR) during 180–330 DAP and harvest index (HI) at 330 DAP for 20 cassava genotypes grown under three irrigation levels in the dry seasons of 2019/2020 and 2020/2021
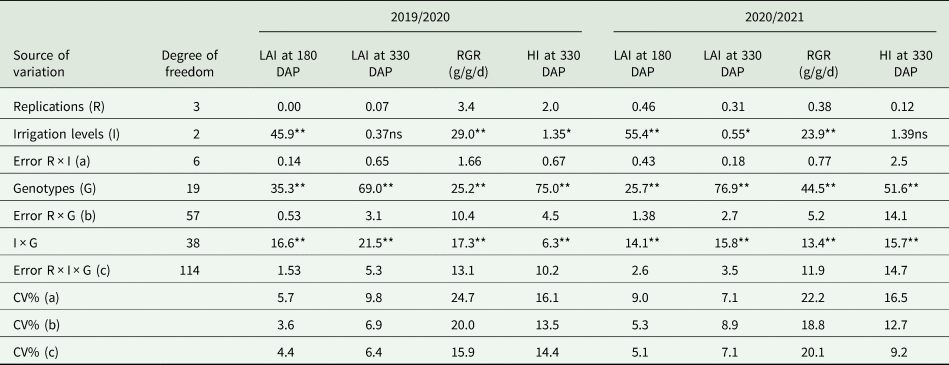
**P ⩽ 0.01; *P ⩽ 0.05; ns, not significant; DAP, days after planting.
Based on the ANOVA, the different irrigation levels significantly affected SCMR and SLA at 180 DAP for both the 2019/2020 and 2020/2021 growing seasons, but not at 330 DAP (Table 3). Genotypes were significantly different for all measured traits for both the 2019/2020 and 2020/2021 growing seasons for both sampling dates. The irrigation levels × genotypes significantly affected SLA at 180 and 330 DAP and SCMR at 330 DAP for both the 2019/2020 and 2020/2021 growing seasons. Non-significant differences for irrigation levels × genotypes were recorded for SCMR at 180 DAP for both growing seasons. Genotypes shared the largest variations for all measured traits for both growing seasons.
Percentage of sum squares (%SS) for SPAD Chlorophyll Meter Reading (SCMR) at 180 and 330 days after planting (DAP) and specific leaf area (SLA) at 180 and 330 DAP for 20 cassava genotypes grown under three irrigation levels in the dry seasons of 2019/2020 and 2020/2021

**P ⩽ 0.01; *P ⩽ 0.05; ns, not significant; DAP, days after planting.
Performances of cassava genotype grown under three irrigation levels
For W1, the results from the 2019/2020 growing season showed that the genotypes Huay Bong 90, CMR36-31-381, Rayong 7 and Rayong 5 were the top in terms of HI when compared to the other genotypes (Table 4). The genotypes Huay Bong 90, CMR36-31-381 and Rayong 5 also had a good response with respect to SLA at 180 and 330 DAP. The genotypes CMR36-31-381 and Rayong 7 had higher RGR values than the other genotypes. The genotype CMR36-31-381 also showed good performance in terms of SCMR at 330 DAP. SCMR at 330 DAP and LAI at 180 DAP for Huay Bong 90, LAI at 180 and 330 DAP for CMR36-31-381, and SCMR at 330 DAP and SLA at 330 DAP for Rayong 7 tended to be high. The results for the 2020/2021 growing season (Table 5) were mostly different compared to the 2019/2020 growing season. Only two genotypes, Huay Bong 90 and CMR36-31-381, that had good performance in HI was similar to the performance for the 2020/2021 growing season (Tables 4 and 5). Both Huay Bong 90 and CMR36-31-381 genotypes also had a good response for SCMR at 330 DAP, SLA at 180 DAP and LAI at 180 DAP for the 2020/2021 growing season when compared to the other genotypes.
Harvest index (HI) at 330 days after planting (DAP), relative growth rate (RGR, g/g/d) for 180–330 DAP, and SCMR, SLA and LAI for 180 and 330 DAP for 20 genotypes grown under irrigation levels at W1 (W1 = 100% ETcrop) for both 2019/2020
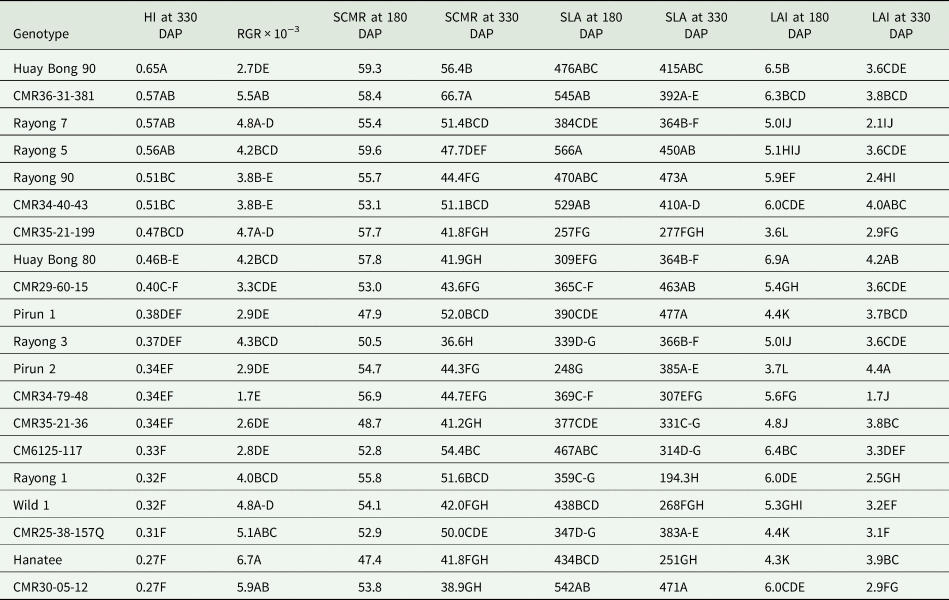
ETcrop, crop water requirement.
Different letters represent significant differences at P ⩽ 0.01.
Harvest index (HI) at 330 days after planting (DAP), relative growth rate (RGR, g/g/d) for 180–330 DAP, and SCMR, SLA and LAI for 180 and 330 DAP for 20 genotypes grown under irrigation levels at W1 (W1 = 100% ETcrop) for both 2020/2021

ETcrop, crop water requirement.
Different letters represent significant differences at P ⩽ 0.01.
When comparing the 20 cassava genotypes under W2 during the early growth phase (Table 6), the results for the 2019/2020 growing season indicated that the genotypes Rayong 7, Huay Bong 90 and CMR36-31-381 were classified as the best with respect to HI. These three genotypes also had higher values for RGR than the other genotypes. The genotypes Rayong 7 and Huay Bong 90 showed the highest LAI at 330 DAT and SLA at 330 DAP, respectively, as compared to the other genotypes. The genotype CMR36-31-381 was identified as the best in terms of SCMR at 330 DAP, and SLA and LAI at 180 DAP. Also, SLA at 330 DAP for Rayong 7, SLA at 180 DAP and LAI at 330 DAP for Huay Bong 90, and SLA at 330 DAP and LAI at 330 DAP for CMR36-31-381 tended to be high. For the results of the 2020/2021 growing season (Table 7), Huay Bong 90 and CMR36-31-381 were classified as the top genotypes when compared to the other genotypes that were similar to the 2019/2020 growing season. The genotype Huay Bong 90 had a high value for SCMR at 330 DAP and SLA at 180 DAP, and it tended to have high SLA at 330 DAP and LAI at 180 DAP. The genotype CMR36-31-381 had high values for RGR, SCMR at 330 DAP, SLA at 180 and 330 DAP, and LAI at 330 DAP. This genotype also tended to have a high LAI at 180 DAP.
Harvest index (HI) at 330 days after planting (DAP), relative growth rate (RGR, g/g/d) for 180–330 DAP, and SCMR, SLA and LAI for 180 and 330 DAP for 20 genotypes grown under irrigation levels at W2 (W2 = 60% ETcrop) for both 2019/2020
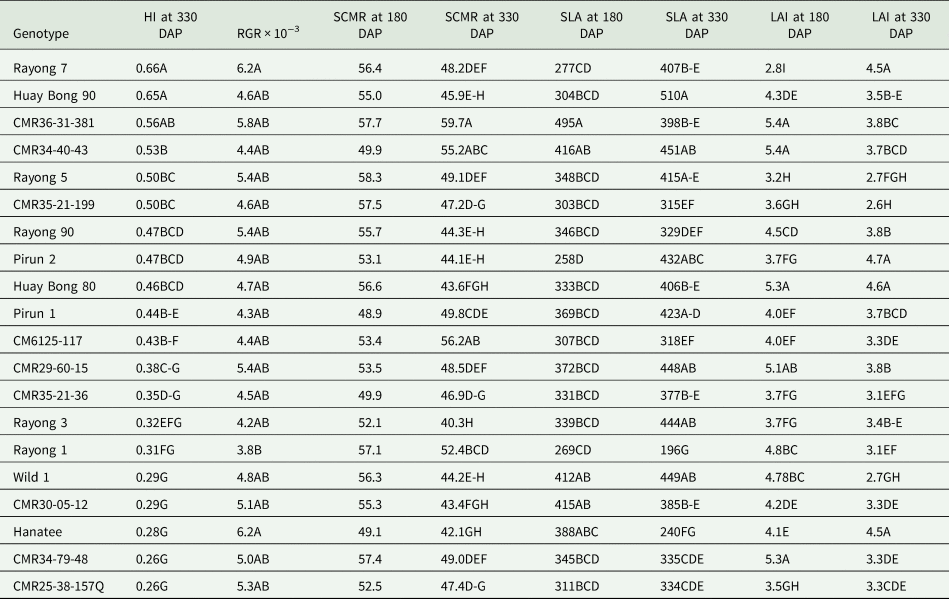
ETcrop, crop water requirement.
Different letters represent significant differences at P ⩽ 0.01.
Harvest index (HI) at 330 days after planting (DAP), relative growth rate (RGR, g/g/d) for 180–330 DAP, and SCMR, SLA and LAI for 180 and 330 DAP for 20 genotypes grown under irrigation levels at W2 (W2 = 60% ETcrop) for both 2020/2021

ETcrop, crop water requirement.
Different letters represent significant differences at P ⩽ 0.01.
When comparing the 20 cassava genotypes under W3 during the early growth phase (Table 8), Huay Bong 90, Rayong 7 and CMR36-31-381 were the top genotypes based on HI, RGR and SLA at 330 DAP for the 2019/2020 growing season. SCMR values at 330 DAP for genotypes Huay Bong 90 and Rayong 7 were higher than for the other genotypes, whereas the value for genotype CMR36-31-381 tended to be high. The genotype Huay Bong 90 had high values for SLA and LAI at 330 DAP, and its SLA value at 180 DAP tended to be high. The genotype CMR36-31-381 also performed well in terms of SLA and LAI at 180 and 330 DAP. For the 2020/2021 growing season (Table 9), the top genotypes that were similar to the results of the 2019/2020 growing season were Huay Bong 90 and CMR36-31-381. The genotype Huay Bong 90 showed good performance for SLA at 180 and 330 DAP, and this genotype tended to have high values for RGR and SCMR at 330 DAP. The genotype CMR36-31-381 had higher values for RGR, SCMR at 330 DAP, SLA at 180 and 330 DAP, and LAI at 180 DAP as compared to the other genotypes.
Harvest index (HI) at 330 days after planting (DAP), relative growth rate (RGR, g/g/d) for 180–330 DAP, and SCMR, SLA and LAI for 180 and 330 DAP for 20 genotypes grown under irrigation levels at W3 (W3 = 20% ETcrop) for both 2019/2020

ETcrop, crop water requirement.
Different letters represent significant differences at P ⩽ 0.01.
Harvest index (HI) at 330 days after planting (DAP), relative growth rate (RGR, g/g/d) for 180–330 DAP, and SCMR, SLA and LAI for 180 and 330 DAP for 20 genotypes grown under irrigation levels at W3 (W3 = 20% ETcrop) for both 2020/2021

ETcrop, crop water requirement.
Different letters represent significant differences at P ⩽ 0.01.
The results for the three different total amounts of irrigation also indicated that the cassava genotypes with a lower performance for HI showed good values for some other crop traits when compared to the other genotypes (Tables 4–9). For both experimental years, however, the association between low values of HI and high values of the other crop traits for each cassava genotype was not clear.
Discussion
This study investigated the performances in terms of SCMR, SLA, LAI, RGR and HI for different 20 cassava genotypes grown under three different irrigation conditions (W1 = 100% crop water requirement or 100% ETcrop; W2 = 60% ETcrop; W3 = 20% ETcrop) during the early growth phase (30–180 DAP). Then, all cassava genotypes were treated with the same amount of water from 180 to 330 DAP (when the crop was harvested).
The significant effect of irrigation levels × genotypes for almost on crop traits indicated that each tested genotype responded differently for these traits to different irrigation management practices, except for the SCMR at 180 DAP. Therefore, the effect of the combinations between irrigation levels × genotypes on crop traits must be explained. On the other hand, the non-significance of irrigation levels × genotypes demonstrated that the performance of the tested genotypes was relatively constant across three irrigation management practices. The large variation for some of the crop traits of the different genotypes, i.e. LAI, HI, RGR for the 2020/2021 growing season, SCMR at 330 DAP, and SLA, indicating more effect of genotypes than irrigation levels and irrigation levels × genotypes. This information, thus, is useful for designing the methodology for varietal selection in the breeding programme for cassava.
The HI value explains the proportion of economic yield to the biomass of the plant. It represents the efficiency of the plant in converting photosynthesized products into an economic yield. Kawano (Reference Kawano1990) suggested determining HI in order to improve the efficiency of cassava breeding. Therefore, this crop trait has been used as an additional criterion worldwide for varietal selection. The results from this study revealed that the genotypes Huay Bong 90 and CMR36-31-381 mostly had the highest HI when compared to the other genotypes for all three different irrigation management practices during the early growth phase for both the 2019/2020 and 2020/2021 growing seasons (Tables 4–9). The results from a report of Ruangyos et al. (Reference Ruangyos, Banterng, Vorasoot, Jogloy, Threerakulpisut, Vongcharoen and Hoogenboom2023) for these genotypes planted under similar growing conditions also indicated that the genotypes Huay Bong 90 and CMR36-31-381 tended to produce more storage root yield for three different total amounts of irrigation during the early growth phase when compared to the other genotypes. In addition, an analysis based on the ratio of W2 and W3 to W1 for the 2020/2021 growing season to determine the drought-tolerant genotypes was also done (Khonghintaisong et al., Reference Khonghintaisong, Songsri and Jongrungklang2023), and Huay Bong 90 and CMR36-31-381 were classified as desirable drought-tolerant genotypes (data not shown).
A higher value for the RGR trait indicates more capability for plants to recover following drought stress. This trait has been studied for many crops grown under water-limited conditions such as wheat (Abid et al., Reference Abid, Tian, Ata-Ul-Karim, Wang, Liu, Zahoor, Jiang and Dai2016), peanut (Awal and Ikeda, Reference Awal and Ikeda2002) and cassava (Vandegeer et al., Reference Vandegeer, Rebecca, Bain, Roslyn and Timothy2013). This study, therefore, focused on the RGR values or the recovery of cassava genotypes after being treated with less water at W2 and W3 during the early growth phase. Our findings demonstrate that the genotype CMR36-31-381 exhibits high RGR values for W2 and W3 during both the 2019/2020 and 2020/2021 growing seasons. This highlights its impressive ability to thrive in water-limited conditions, attributed to its high HI value. The genotype Huay Bong 90 also showed a strong ability to recover from water shortage, with high HI values, except for W2 in the 2020/2021 growing season.
The high value for the trait SCMR is related to the high density of chlorophyll, which enhances crop photosynthesis and dry matter accumulation (Ruttanaprasert et al., Reference Ruttanaprasert, Jogloy, Vorasoot, Kesmala, Kanwar, Holbrook and Patanothai2012; Puangbut et al., Reference Puangbut, Jogloy and Vorasoot2017, Reference Puangbut, Jogloy, Vorasoot and Songsri2022). At 330 DAP, however, the genotypes Huay Bong 90 and CMR36-31-381 with good value for HI also had high values for SCMR for both the 2019/2020 and 2020/2021 growing seasons, except for the genotype Huay Bong 90 for the 2019/2020 growing season. With respect to SLA, these two cassava genotypes also had high values, except for the SLA at 330 DAP for the 2020/2021 growing season. The SLA defines leaf thickness which increases with drought stress (El-Sharkawy et al., Reference El-Sharkawy, Hernandez and Hershey1992). Wongnoi et al. (Reference Wongnoi, Banterng, Vorasoot, Jogloy and Theerakulpisut2020) reported that the SLA values of cassava grown during the dry season were lower (thicker) than those grown during the rainy season, and they found that cassava genotypes that had high values for SLA produced more total crop biomass and storage root yield.
LAI defines the ratio of leaf area to ground area, which plays a major role in the light captured for photosynthesis, resulting in biomass accumulation and increased crop yield (Zhu et al., Reference Zhu, Long and Ort2010). Cassava yield was positively correlated with leaf retention, which can vary depending on genotypes and environmental factors (El-Sharkawy and Cadavid, Reference El-Sharkawy and Cadavid2002; Lenis et al., Reference Lenis, Calle, Jaramillo, Perez, Ceballos and Cock2006; Mahakosee et al., Reference Mahakosee, Jogloy, Vorasoot, Theerakulpisut, Banterng, Kesmala, Holbrook and Kvien2019). Our results revealed that the best genotypes for HI such as the genotypes Huay Bong 90 and CMR36-31-381 did not have the highest values of LAI as compared to the other genotypes. However, these two genotypes had values for LAI in the range of optimum values for cassava (ranging from 3 to 3.5) to achieve high storage root yield for the 2019/2020 growing season (Cock et al., Reference Cock, Franklin, Sandoval and Juri1979). For the 2019/2020 growing season, the genotypes Huay Bong 90 and CMR36-31-381 had LAI values lower than the optimum values at 330 DAP when the leaf has less effect on storage root accumulation as compared to at 180 DAP or during the growth stage of maximum canopy establishment (Cock et al., Reference Cock, Franklin, Sandoval and Juri1979; Alves, Reference Alves, Hillocks, Thresh and Bellotti2002). The LAI values at 330 DAP were generally lower than at 180 DAP due to the senescence of older leaves in the lower strata of the canopy during the later part of the growing season (Mahakosee et al., Reference Mahakosee, Jogloy, Vorasoot, Theerakulpisut, Holbrook, Kvien and Banterng2020).
An evaluation of the cassava genotypes based on SCMR, SLA, LAI and RGR coupled with HI could support better decision-making for varietal selection. Overall, our study revealed that the genotypes CMR36-31-381 and Huay Bong 90 had good characteristics in terms of partitioning to storage root, as indicated by high values of HI, similar to what was reported by Ruangyos et al. (Reference Ruangyos, Banterng, Vorasoot, Jogloy, Threerakulpisut, Vongcharoen and Hoogenboom2023). These two genotypes showed high values for SCMR, SLA and RGR for W2 and W3 as compared to the other genotypes. The LAI values during the period of high leaf growth rate and maximum canopy size for the genotypes CMR36-31-381 and Huay Bong 90 were also in the optimum range. Therefore, this study showed that SCMR, SLA and LAI traits can be used to explain performance for different genotypes based on leaf (source), relating to the growth and yield of cassava under different planting conditions. The source strength is an important factor in enhancing the photosynthate, leading to high dry matter accumulation, especially in the storage root of cassava (Pellet and El-Sharkawy, Reference Pellet and El-Sharkawy1994). However, performance based on sink strength, i.e. the storage organ is also important to better explain dry matter partitioning (Pellet and El-Sharkawy, Reference Pellet and El-Sharkawy1993). In addition, our study demonstrated that the capability of cassava to recover from a shortage of water relates to an increase in dry matter accumulation and ultimately a high storage root yield. The genotypes CMR36-31-381 and Huay Bong 90 can serve as valuable genetic resources for cultivation and further breeding programmes under different total amounts of irrigation.
Conclusions
This study provided valuable information on the traits SCMR, SLA, LAI, RGR and HI for 20 cassava genotypes grown under different levels of irrigation during the early growth phase. The genotypes CMR36-31-381 and Huay Bong 90 were desirable in terms of HI, and they also performed well concerning SCMR, SLA and RGR for the W2 and W3 irrigation regimes. The values for LAI values for these two genotypes were also in the range of optimum values during the maximum canopy size. The genotypes CMR36-31-381 and Huay Bong 90, therefore, can be used as suitable genetic resources for cultivation and further breeding programmes under water-limited conditions.
Acknowledgements
The authors appreciate the editing support provided by Dr Carol J. Wilkerson.
Author contributions
C. R.: Conceptualization, data curation, formal analysis, investigation, methodology and writing-original draft. P. B.: Conceptualization, data curation, funding acquisition, investigation, methodology, project administration, resources, supervision, writing – review and editing. N. V.: conceptualization, data curation, investigation, methodology, writing – review and editing. S. J.: conceptualization, investigation, methodology, writing – review and editing. P. T.: conceptualization, investigation, methodology, writing – review and editing. K. V.: writing – review and editing. G. H.: writing – review and editing.
Funding statement
This study was supported by Khon Kaen University, Thailand, the Royal Golden Jubilee Ph.D. Programme (PHD/0130/2560). Support for the research was also provided by the Plant Breeding Research Center for Sustainable Agriculture, Khon Kaen University and from the National Science and Technology Development Agency (NSTDA).
Competing interests
None.
Ethical standards
Not applicable.



