Improving cheese yield and processing efficiency remains a major objective in industrial cheesemaking. In recent years, the use of membrane technologies, especially ultrafiltration (UF), has emerged as a potential strategy to achieve this goal. This technology allows for the selective concentration of milk proteins and enables the standardization of milk to produce cheeses with higher protein levels, resulting in potential yield increases and reduced process variability (Galli et al., Reference Galli, Hamed, Sheehan, King, Abdel-hamid and Rome2023; Guinee et al., Reference Guinee, O'kennedy and Kelly2006; Mistry and Maubois, Reference Mistry and Maubois2017).
However, increasing the protein content of milk through UF strongly affects its technological performance during manufacturing, as well as the composition and quality of the final product. Protein enrichment increases the concentration of rennet-reactive caseins and overall solids content, strengthening the curd matrix and leading to a denser paracasein network with high initial water and fat retention (Barbano and Lynch, Reference Barbano and Lynch2006; Guinee et al., Reference Guinee, O'kennedy and Kelly2006). This dense structural network alters the dynamics of the coagulation process and the microstructure of the rennet gel, which typically exhibits reduced syneresis rates. Consequently, if coagulum management and curd cutting conditions are not properly adjusted, there is an increased risk of structural fragility during processing, leading to excessive losses of fat, protein and total solids in the whey (Govindasamy-Lucey et al., Reference Govindasamy-Lucey, Jaeggi, Martinelli, Johnson and Lucey2011; Guinee et al., Reference Guinee, Pudja and Mulholland1994; Soodam and Guinee, Reference Soodam and Guinee2018).
Furthermore, high protein concentration can significantly influence cheese ripening. Several authors have reported alterations in the proteolytic profiles of cheeses when UF milk is used, due to modifications in the mineral balance of the matrix, greater retention of plasmin inhibitors and a higher concentration of native whey proteins, which can act as inhibitors of the residual coagulant (Reale et al., Reference Reale, Govindasamy-Lucey, Lu, Johnson, Jaeggi, Molitor and Lucey2022).
Semi-hard cheeses are among the most important varieties produced in Argentina. According to the Argentine Food Code, this category is characterized by a moisture content ranging from 36.0% to 45.9%, with Danbo, Tybo and Pategrás being the predominant varieties, which have fat levels in dry matter ranging from 25.0% to 44.9% (CAA, 2025). At a macroeconomic level, cheese production represents the main driver of value addition to the national dairy chain, historically absorbing more than 44% of the total available raw materials (OCLA, 2026). Semi-hard cheeses account for 24.4% of total industrial cheese production and play a strategic role in the export market, representing 7.4% of sectoral export value and generating USD 1.69 billion in national revenue (OCLA, 2026).
Given the economic importance of semi-hard cheeses in Argentina, there is a clear need to investigate innovative processing strategies that enhance cheese yield without modifying the quality attributes of the final product. In the case of Tybo cheese, different studies have been conducted using this popular Argentine variety, such as the assessment of textural parameters during ripening (Bertola et al., Reference Bertola, Bevilacqua and Zaritzky1992) or the influence of NaCl reduction on its main biochemical and sensory characteristics (Sihufe et al., Reference Sihufe, De Piante Vicín, Marino, Ramos, Nieto, Karlen and Zorrilla2018). However, there is no prior work evaluating the use of ultrafiltered milk to increase its yield. It was hypothesized that increasing milk protein concentration by UF would improve coagulation properties and cheese yield without compromising the quality of Tybo cheese. In this context, the objective of the present study was to investigate the effect of increasing milk protein concentration by UF on the coagulation behaviour, cheese yield and proteolysis during ripening of Tybo cheese, comparing fixed and casein-adjusted rennet dosing strategies. This integrated approach aims to provide applicable insights and define technological limits (maximum protein content in the processing of milk) for optimizing the use of UF milk in industrial cheesemaking systems.
Materials and methods
Materials
The CaCl2 (Merck, Darmstadt, Alemania) was purchased from La Raíz S.A. (Córdoba, Argentina). The commercial direct vat starter of Streptococcus thermophilus (ST1-12 Chr. Hansen) and the coagulant enzyme CHY-MAX® M, 1000 IMCU/mL Chr. Hansen were provided by Agrolac S.A. (Paraná, Argentina). The ultrafiltered concentrated milk was provided by Williner S.A. (Rafaela, Argentina). The following drugs and reagents were purchased from Redilab S.A. (Humberto Primo, Santa Fe, Argentina): trichloroacetic acid (p.a.) Cicarelli, phosphotungstic acid (p.a.) Biopack, sulfuric acid 95%–98% (p.a.) Cicarelli, sodium hydroxide (p.a.) Cicarelli and urea (p.a.) Cicarelli. Coomassie Blue R250 dye, αs1-casein and β-casein protein standards were purchased from Sigma Chemical Co. (St. Louis, MO, USA).
Experimental design
The effects of milk protein concentration and the method of coagulant enzyme addition on the yield, quality and proteolysis of miniature semi-hard cheeses were evaluated. Target protein concentrations were 3.70% (M0), 4.80% (M1) and 6.00% (w/v) (M2). These levels were selected based on literature reports to evaluate a progressive protein enrichment while ensuring the feasibility and compatibility of standard cheesemaking technology for Tybo cheese. Since adjusting rennet dosage according to casein content has been proposed as a critical strategy to achieve the expected ripening in cheeses produced from UF milk, the coagulant enzyme was added either at a fixed dose (FD) or at a variable dose (VD), adjusted according to the casein content of the milk used for cheese manufacturing. In total, six different treatments were evaluated, and each cheese was produced in five replicates.
Milk analysis and standardization
Whole milk (WM) was obtained from a dairy farm of the National Institute of Agricultural Technology (INTA, EEA-Rafaela). The whole ultrafiltered milk (UFM) was provided by a local dairy company. A PASILAC membrane UF system equipped with five 6-inch housings was used, combining spiral-wound membranes (modules 1–2) and flat-sheet membranes (modules 3–5). The system operates at a maximum capacity of 6 m3/h, at approximately 58°C and 2.5 bar. Feed milk contained 10–11°Bx total solids, while the retentate reached approximately 43°Bx, corresponding to a concentration factor of ∼6.2. The UF membranes used present molecular weight cut-off (MWCO) values of 10 kDa; this MWCO allows retention of caseins and the major whey proteins (β-lactoglobulin and α-lactalbumin), while smaller molecules such as lactose, minerals and non-protein nitrogen compounds permeate through the membrane (Galli et al., Reference Galli, Hamed, Sheehan, King, Abdel-hamid and Rome2023; Reale et al., Reference Reale, Govindasamy-Lucey, Lu, Johnson, Jaeggi, Molitor and Lucey2022). Under these operating conditions, a protein-enriched retentate suitable for cheese-milk standardization was obtained. This industrial-scale concentration system reflects current dairy membrane practices applied to cheese-milk standardization.
The mean compositional values ± standard deviation of the milk were as follows: 17.55% ± 2.30% fat; 17.08% ± 0.85% protein; 39.90% ± 3.34% total solids; pH 6.53 ± 0.13. Milk used in different treatments was standardized to protein levels of 3.70% (M0), 4.80% (M1) and 6.00% (M2), maintaining a fat-to-protein ratio (FPR) of approximately 1 by combination of WM and UFM. This FPR value was chosen because it is commonly used in Argentina to produce semi-hard cheeses (Bergamini et al., Reference Bergamini, Giménez, Meinardi, Wolf, George, Zacarías, Briggiler Marcó, Peralta, Perotti and Hynes2022). For the preparation of the mixtures, both milks were heated to 45°C and then cooled to the target coagulation temperature for cheesemaking prior to rennet addition. The pH value in all milks was determined by the potentiometric method, using a Titroline Alpha Plus automated autoanalyser (Schott Instruments, Mainz, Germany). The composition of the resulting milks was analysed using infrared methodology (ISO 9622 / IDF 141, 2013).
Cheesemaking
Miniature semi-hard cheeses were produced following a standard protocol for semi-hard cheese, adapted for laboratory-scale vats. Briefly, 1 L of milk was added with CaCl2 to a final concentration of 0.2 g/L, then placed in a mini-vat and put into a thermostatic bath until reaching the coagulation temperature (36.8°C ± 0.3°C). After this, the starter of ST1-12 was added at a concentration of 106 CFU/mL in milk. The coagulant enzyme (1000 IMCU/mL) concentration used was 0.05 mL/L milk for the cheeses prepared with FD (M0FD, M1FD and M2FD), while in cheeses prepared with a VD the concentration depended on the casein concentration in milk (M0VD: FD, M1VD: FD*M1 casein concentration/M0 casein concentration, and M2VD: FD*M2 casein concentration/M0 casein concentration). A hot wire viscosity sensor (INRA, Pignat, France) was then inserted into the vat to monitor and determine the coagulation time using the Coag software (INRA, Pignat, France). This sensor measures the time between the coagulant addition and the beginning of milk clotting. Once the desired firmness was achieved after coagulation, all the curds were manually cut simultaneously until reaching the appropriate grain size for this type of cheese. The mixture of the curd particles and whey was gently stirred and heated at 0.5°C/min until it reached 45°C, maintaining this temperature for 7 minutes to reduce moisture in the curd grains. After heating, the curds were separated from the whey and placed into miniature cylindrical moulds measuring 5.5 cm in diameter and 10 cm in height. The whey was collected, and its volume was recorded. The miniature cheeses were kept in their moulds in a chamber at 45°C until the pH reached 5.2. Then, they were pressed at room temperature (20°C) and brined for 2.7 minutes in saturated brine at 4°C. After brining, the cheeses were weighed and vacuum-packed in suitable Cryovac bags (Buenos Aires, Argentina). From each mini-vat, 4 miniature cheeses were obtained. The average cheese weight was 20 g. Finally, the cheeses were ripened for 45 days at 4°C.
Mean values and standard deviations of chemical composition, FPR and pH of standardized milk

Table 1 Long description
Mean values with standard deviations are listed for three milks labeled M0, M1, and M2, covering chemical composition, fat to protein ratio, pH, and two casein ratios. Total protein percent weight per volume is 3.65 plus or minus 0.02 with superscript c in M0, 4.80 plus or minus 0.01 with superscript b in M1, and 6.00 plus or minus 0.04 with superscript a in M2. Casein percent weight per volume is 2.74 plus or minus 0.01 with superscript c, 3.71 plus or minus 0.09 with superscript b, and 4.83 plus or minus 0.02 with superscript a; soluble protein percent weight per volume is 0.56 plus or minus 0.17 with superscript c, 0.80 plus or minus 0.03 with superscript b, and 1.04 plus or minus 0.02 with superscript a. Fat percent weight per volume is 4.05 plus or minus 0.02 with superscript c, 5.61 plus or minus 0.01 with superscript b, and 7.03 plus or minus 0.01 with superscript a; total solid percent weight per volume is 13.36 plus or minus 0.04 with superscript c, 15.99 plus or minus 0.02 with superscript b, and 18.60 plus or minus 0.05 with superscript a. FPR values are 1.11 plus or minus 0.08 for M0, 1.17 plus or minus 0.06 for M1, and 1.16 plus or minus 0.04 for M2. pH values are 6.76 plus or minus 0.03 for M0, 6.75 plus or minus 0.04 for M1, and 6.71 plus or minus 0.03 for M2. Casein to total protein is 0.76 plus or minus 0.03, 0.77 plus or minus 0.01, and 0.80 plus or minus 0.01 for M0, M1, and M2. Casein to soluble protein is 5.55 plus or minus 1.71 for M0, 4.65 plus or minus 0.11 for M1, and 4.64 plus or minus 0.11 for M2.
Note: FPR, fat-to-protein ratio relation.
a,b,c Average values in the same row with different superscript letters are significantly different (P < 0.05).
Mean values and standard deviations of coagulation time of milk, whey volume and whey composition, practical and theoretical yield and component recovery percentages (protein and fat); with statistical significance of the main effects

Table 2 Long description
Parameters are reported as mean plus or minus standard deviation for two processes, FD and VD, each across M0, M1, and M2. Whey volume in milliliters decreases from M0 to M2 for both processes: FD 1739, 1663, 1520 and VD 1726, 1651, 1512. Whey fat percent weight per volume increases from M0 to M2 for both processes: FD 0.83, 1.10, 1.70 and VD 0.83, 1.01, 1.58. Whey protein percent weight per volume increases from M0 to M2 for both processes: FD 1.03, 1.35, 1.74 and VD 1.03, 1.34, 1.75. Practical yield percent increases from M0 to M2 for both processes: FD 11.14, 16.25, 20.82 and VD 10.93, 16.19, 20.66. Theoretical yield percent increases from M0 to M2 for both processes: FD 12.05, 17.94, 22.03 and VD 12.51, 18.10, 22.51. Protein recovery percent stays near 71 to 72 across M0 to M2 for both processes, while fat recovery percent ranges from 75.86 to 80.35 for FD and from 77.55 to 82.04 for VD. Significance columns list main effects for F1 and F2: coagulation time shows F1 not significant and F2 significant; whey volume, fat, protein, practical yield, theoretical yield, and fat recovery show F1 significant and F2 not significant; protein recovery shows both F1 and F2 not significant.
Note: F1, protein concentration in the milk used for cheese manufacturing; F2, procedure of adding the coagulant: fixed dose (FD) or at a variable dose (VD); NS, no significant effect (P > 0.05).
* Significant effect (P < 0.05).
Cheese yield
To evaluate the efficiency of the cheesemaking process, both practical yield (PY) and theoretical yield (TY) were determined.
Practical yield
Practical yield (PY) was calculated as the ratio between the weight of the cheese after salting and the weight of milk used in the process, expressed as a percentage (Fox et al., Reference Fox, Guinee, Cogan and McSweeney2000, pp. 169–173).
 \begin{equation}\mathrm{PY} \left( \mathrm{\%} \right) = \frac{\mathrm{Cheese} \left( \mathrm{kg} \right)}{\mathrm{Milk} \left( \mathrm{kg} \right)}\times 100\end{equation}
Theoretical yield
TY represents the percentage of cheese expected to be obtained from milk. It was calculated from the chemical composition analysis of milk, whey and cheese during processing (Escobar et al., Reference Escobar, Pelaggio, Grille, Colzada, Rampoldi, Carro, Delucchi, Viola, Nolla, Reinares, Chilibroste and Piedrabuena2014; International Dairy Federation, 1993).
 \begin{equation}\mathrm{TY} \left( \mathrm{\%} \right) = \frac{\left( \mathrm{RF} \times \mathrm{F} +\mathrm{0} .94\left( \mathrm{0} .94\times \mathrm{CN} \right)+\mathrm{0} .78 \right)}{\left( 100-\mathrm{Mc} \right)}\times 100\end{equation}
This expression includes the fat (F) and casein (CN) content of milk, the milk fat recovery factor in cheese (RF) (defined as the fraction of milk fat retained in the curd and incorporated into the final cheese matrix), and the moisture content of the cheese (Mc). In this study, RF was assumed to be 0.97, according to the recommendations of the International Dairy Federation (1993) for semi-hard cheeses.
Components recovery
Additionally, component recovery in the curd was calculated to estimate the retention efficiency of the main components, especially in treatments with UFM and high casein content.
The recovery of fat and protein was calculated on a mass basis, as the ratio between the total amount (g) of each component in the cheese and its corresponding amount (g) in the milk used for cheesemaking (Gimenez et al., Reference Gimenez, George, Spotti, Perotti, Hynes and Bergamini2025).
 \begin{equation}\mathrm{Fat}\, \mathrm{recovery} \left( \mathrm{FR} \mathrm{\%} \right) = \frac{\mathrm{Cheese}\, \mathrm{Fat} \left( \mathrm{g} \right)}{\mathrm{Milk}\, \mathrm{Fat} \left( \mathrm{g} \right)}\times 100\end{equation}
 \begin{equation}
\mathrm{Protein}\, \mathrm{recovery} \left( \mathrm{PR} \mathrm{\%} \right) = \frac{\mathrm{Total}\, \mathrm{Protein}\, \mathrm{cheese} \left( \mathrm{g} \right)}{\mathrm{Total}\, \mathrm{Protein}\, \mathrm{milk} \left( \mathrm{g} \right)} \times 100
\end{equation}
The use of these standardized expressions allows for an accurate interpretation of the impact of protein standardization by UF on the overall efficiency of the cheesemaking process, regardless of variability between batches or operating conditions.
Whey analysis
Whey composition was analysed using the Infrared (IR) methodology used for milk (ISO 9622 / IDF 141, 2013). This analysis allows for the quantification of component losses in the whey, which is essential for determining process efficiency. Furthermore, it provides insight into the quality of the whey for potential industrial processing.
Cheeses analysis
All assays were performed in duplicate. Chemical composition and pH were determined after 15 days of ripening. Proteolysis assessments were analysed at 0, 15, 30 and 45 days after cheese manufacturing. The analyses were performed on each of the five cheesemaking replicates. On each sampling day, one cheese from each treatment was randomly selected for all analyses.
pH and chemical composition
Total protein was determined according to IDF (1993) by the Kjeldahl method. Fat content was determined according to IDF (1997) by the butyrometric method. Total solids were determined according to IDF (2004). The results for total protein and fat were expressed on a dry matter basis. The pH was determined as described by Bradley et al. (Reference Bradley, Arnold, Barbano, Semerad, Smith, Vines and Marshall1993), by immersing the electrode (Schott Instruments, Mainz, Germany) into a homogenate (1:1) of grated cheese thoroughly mixed with distilled water.
Proteolysis assessment
Proteolysis was assessed by the techniques described below.
Soluble nitrogen (SN). Three different SN fractions were obtained based on the method described by Hynes et al. (Reference Hynes, Bergamini, Suárez and Zalazar2003). Briefly, cheese samples were treated to obtain crude citrate extracts. The pH was then adjusted, and the samples were centrifuged to obtain the SN fraction at pH 4.6 (SN-pH 4.6). This soluble fraction was subsequently precipitated using 12% (w/v) trichloroacetic acid (SN-TCA) and 2.5% (w/v) phosphotungstic acid (SN-PTA) to obtain the remaining SN fractions. The nitrogen content in each fraction was determined by the Kjeldahl method (IDF, 1993). All SN fractions were expressed as the percentage of total nitrogen.
Electrophoresis. The electrophoretic procedure was adapted from the method described by Sihufe et al. (Reference Sihufe, Zorrilla and Rubiolo2010). In summary, 3 g of grated cheese was solubilized in 25 mL of urea solution (8.66 M), followed by fat removal through cold filtration using qualitative filter paper. The resulting fractions were separated into vertically discontinuous polyacrylamide gels under anodic buffer conditions. Electrophoresis was carried out at a constant current of 50 mA. After the run, the gels were stained with Coomassie Brilliant Blue R-250. The stained gels were then scanned, and band analysis was conducted with Gel-Pro Analyser software (Media Cybernetics, Silver Spring, MD, USA) to quantify the relative area of each protein band. As reference standards, αs1-casein and β-casein were loaded into two separate lanes on every gel.
Peptide profiles in cheeses. Peptide separation was carried out using a high-performance liquid chromatography (HPLC) system equipped with a quaternary pump, an online degasser and a UV/visible detector (Flexar series, PerkinElmer, Norwalk, CT, USA). Chromatographic data were collected through an interface module connected to a computer running Totalchrom software (PerkinElmer). The analysis employed an Aquapore OD-300 analytical column (C18, 5 nm–300 Å, 250 mm × 4.6 mm; PerkinElmer). Sample preparation and chromatographic conditions followed the methodology established by Hynes et al. (Reference Hynes, Bergamini, Suárez and Zalazar2003). Water-soluble extracts from cheese samples were obtained, filtered through 0.45 μm membranes (Millex, Millipore, São Paulo, Brazil) and injected into the HPLC system. Detection was carried out at 214 nm, with the column maintained at 40°C and a flow rate of 1 mL/min. Peptide separation was achieved using a linear gradient of acetonitrile in water over 107 minutes, as described by Hynes et al. 2003. The resulting peptide profiles were visually compared.
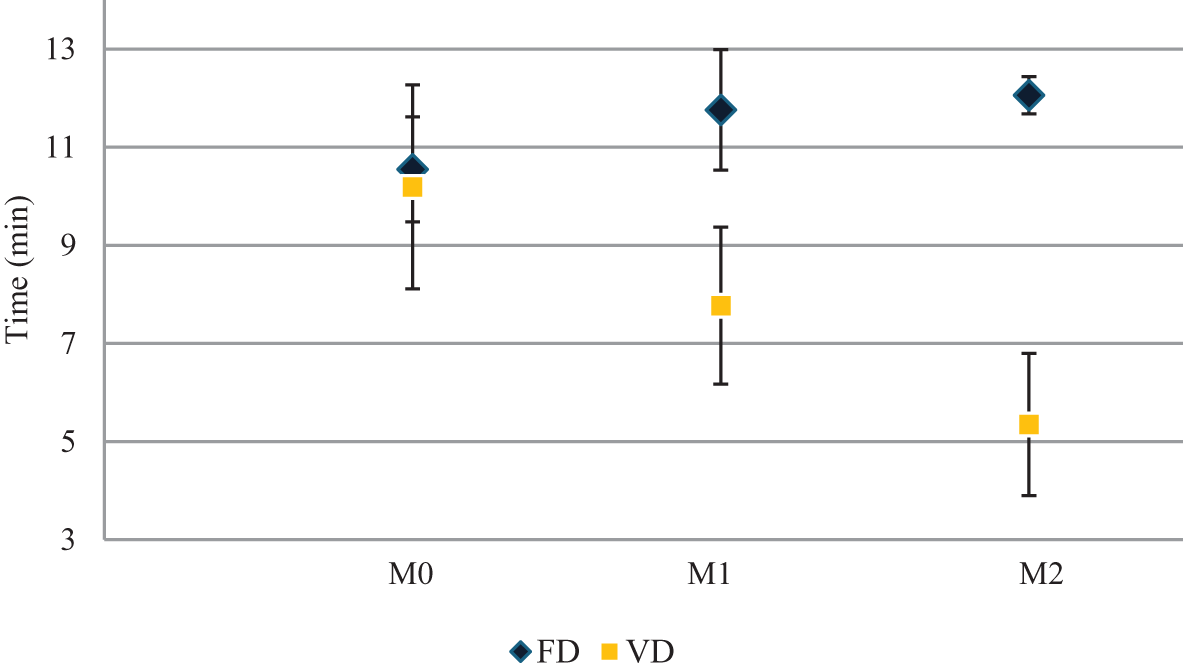
Coagulation time (CT, min) recorded during cheese making, carried out using different procedures for adding the coagulant: fixed dose (FD) or variable dose (VD). Data points represent the mean ± standard deviation of five replicates of each sample.

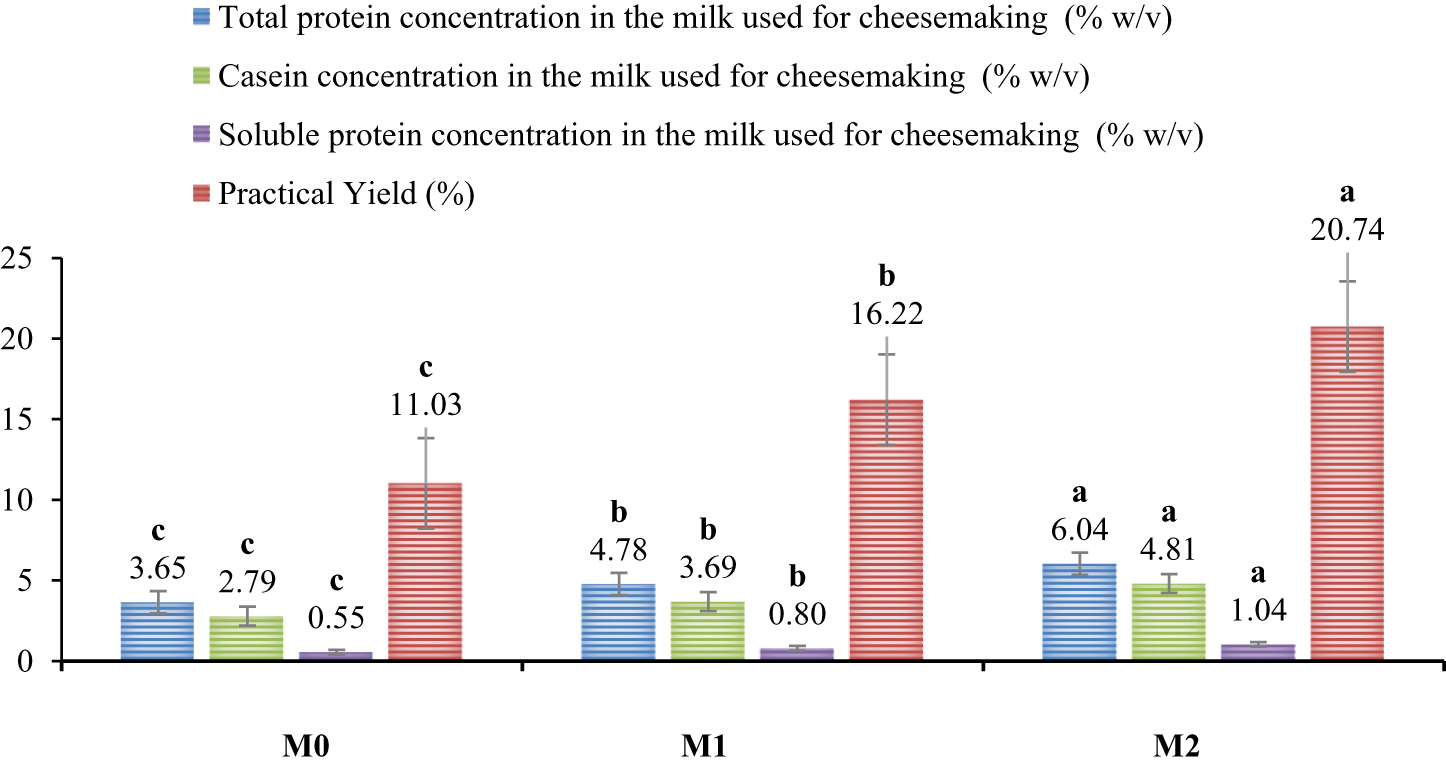
Relationship between milk protein concentration and practical cheese yield. Bars represent mean values and error bars indicate standard deviation. Colour-coded bars represent total protein concentration (blue), casein concentration (light green), soluble protein concentration (purple) and practical yield (red). Lowercase letters (a, b, c) indicate statistically significant differences (P < 0.05) among treatments (M0, M1, M2) for each parameter; different letters within the same parameter denote significant differences.

Figure 2 Long description
Grouped bar graph with four bars per category and error bars. Legend labels, Total protein concentration in the milk used for cheesemaking left parenthesis percent w over v right parenthesis, Casein concentration in the milk used for cheesemaking left parenthesis percent w over v right parenthesis, Soluble protein concentration in the milk used for cheesemaking left parenthesis percent w over v right parenthesis, Practical Yield left parenthesis percent right parenthesis. X axis categories, M0, M1, M2. Y axis tick labels, 0, 5, 10, 15, 20, 25. M0 values shown above bars with letters: Total protein concentration 3.65 with letter c. Casein concentration 2.79 with letter c. Soluble protein concentration 0.55 with letter c. Practical Yield 11.03 with letter c. M1 values shown above bars with letters: Total protein concentration 4.78 with letter b. Casein concentration 3.69 with letter b. Soluble protein concentration 0.80 with letter b. Practical Yield 16.22 with letter b. M2 values shown above bars with letters: Total protein concentration 6.04 with letter a. Casein concentration 4.81 with letter a. Soluble protein concentration 1.04 with letter a. Practical Yield 20.74 with letter a.
Statistical analysis
Milk composition and pH were processed by two-way analysis of variance (ANOVA). For statistical analysis of technological parameters and cheese composition, protein concentration in the milk used for cheese manufacturing (F1) and the procedure of adding the coagulant enzyme (F2) were selected as main factors for ANOVA with a test for interaction. For the ANOVA on the variables measured during ripening (F3), we used a repeated-measures model. All statistical analyses were performed using R software (version 4.3.1; R Core Team, 2023, Vienna, Austria). When differences between treatment effects were significant (P < 0.05), a multiple comparison of means was performed by the least significant differences test. The normality of data distribution was tested on the model residuals using the Shapiro–Wilk test, along with the construction of q–q plots.
Mean values and standard deviations of chemical composition of cheeses after 15 days of ripening, and significance of the main effects

Table 3 Long description
Mean and standard deviation are reported for cheese composition after 15 days of ripening, for two cheese groups labeled FD and VD, each with columns M0, M1, and M2. For moisture percent weight by weight, FD values are 42.19 plus or minus 0.93 at M0, 44.85 plus or minus 1.92 at M1, and 46.43 plus or minus 2.79 at M2; VD values are 41.97 plus or minus 0.85, 44.98 plus or minus 1.60, and 46.95 plus or minus 2.81. For fat percent weight by weight, FD values are 43.80 plus or minus 2.60, 54.68 plus or minus 3.88, and 62.68 plus or minus 3.61; VD values are 43.09 plus or minus 1.37, 54.04 plus or minus 2.84, and 63.68 plus or minus 3.62. For protein percent weight by weight, FD values are 40.08 plus or minus 1.43, 40.64 plus or minus 1.31, and 42.97 plus or minus 2.58; VD values are 39.90 plus or minus 1.94, 41.21 plus or minus 1.81, and 42.92 plus or minus 2.87. For sodium chloride percent weight by weight, FD values are 0.73 plus or minus 0.17, 0.79 plus or minus 0.22, and 0.69 plus or minus 0.19; VD values are 0.78 plus or minus 0.12, 0.69 plus or minus 0.08, and 0.65 plus or minus 0.18. For pH, FD values are 5.65 plus or minus 0.12, 5.58 plus or minus 0.06, and 5.51 plus or minus 0.04; VD values are 5.65 plus or minus 0.07, 5.57 plus or minus 0.05, and 5.52 plus or minus 0.07. A separate significance section lists parameters by F1 and F2: moisture, fat, protein, and pH are marked with an asterisk under F1 and NS under F2, while sodium chloride is marked NS under both F1 and F2.
Note: F1, protein concentration in the milk used for cheese manufacturing; F2, procedure of adding the coagulant: fixed dose (FD) or at a variable dose (VD); NS, no significant effect (P > 0.05).
Fat and protein are expressed in dry matter.
* Significant effect (P < 0.05).
Mean values and standard deviations of soluble nitrogen fraction (expressed as the percentage of total N). Significance of effects of protein concentration in the milk used for cheesemaking (F1), procedure of adding the coagulant (F2) and time of ripening (F3)

Table 4 Long description
Soluble nitrogen fractions are reported as mean plus or minus standard deviation for three parameters, SN pH 4.6, SN TCA, and SN PTA, across ripening times F3 of 0, 15, 30, and 45, split by coagulant addition procedure F2, fixed dose FD and variable dose VD, and milk protein level F1, M0, M1, and M2. For SN pH 4.6 at day 0, FD ranges from 3.81 plus or minus 0.75 at M0 to 4.20 plus or minus 0.61 at M2, and VD ranges from 3.41 plus or minus 0.06 at M0 to 4.51 plus or minus 0.71 at M2. By day 30, SN pH 4.6 is 5.46, 5.98, and 6.65 for FD at M0, M1, and M2, and 5.55, 6.62, and 6.50 for VD at M0, M1, and M2. At day 45, SN pH 4.6 is 6.48, 7.35, and 5.51 for FD at M0, M1, and M2, and 7.22, 7.09, and 7.60 for VD at M0, M1, and M2. For SN TCA, day 0 values are 2.00, 1.66, and 1.09 for FD at M0, M1, and M2, and 1.49, 1.56, and 1.94 for VD at M0, M1, and M2; by day 45 they are 4.96, 4.58, and 4.08 for FD and 5.54, 5.65, and 6.08 for VD. For SN PTA, day 0 values are 0.28, 0.49, and 0.57 for FD and 0.28, 0.29, and 0.37 for VD, and by day 45 they are 0.93, 1.17, and 1.12 for FD and 1.21, 1.26, and 1.24 for VD. In the significance section, SN pH 4.6 shows asterisk marks for F1, F2, and F3, while SN TCA and SN PTA show no significant effect for F1 and F2 and an asterisk mark for F3.
Note: F1, protein concentration in the milk used for cheese manufacturing; F2, procedure of adding the coagulant: fixed dose (FD) or at a variable dose (VD); F3, ripening time; NS, no significant effect (P > 0.05).
* Significant effect (P < 0.05).
Results and discussion
Milk composition
The chemical composition, FPR and pH of M0, M1 and M2 are shown in Table 1. As the proportion of UFM increased in the mixtures, the concentration of all milk components increased significantly. Changes in milk composition following UFM addition were expected (Ong et al., Reference Ong, Dagastine, Kentish and Gras2013), as UF using membranes with a nominal MWCO of 10 kDa (as used in the present study) promotes the retention of caseins and major whey proteins, while low-molecular-weight non-protein nitrogen compounds readily permeate. Consequently, the proportion of true protein relative to non-protein nitrogen increases in the retentate. Accordingly, both casein and soluble protein concentrations increased in UF milks (Table 1).
Cheesemaking and yield
Coagulation time
The parameters monitored during cheesemaking are shown in Table 2. The method of rennet addition (F2) significantly affected the coagulation time, but with opposite trends depending on protein concentration (F1) (Figure 1). When the coagulant was added at FD, coagulation time increased as milk protein concentration increased, probably because the same amount of enzyme was acting on a larger substrate. Similar results were reported by Catarino et al. (Reference Catarino, Martins, Duarte, Prudêncio and de Pinho2013) in ultrafiltered skimmed sheep milk. However, when the coagulant was added at VD according to the casein content of the milk used for cheese production, coagulation time decreased as protein concentration increased. These results indicate that rennet dosage had a greater influence on coagulation time than protein concentration, which is consistent with the findings of Gimenez et al. (Reference Gimenez, George, Spotti, Perotti, Hynes and Bergamini2025) for Cremoso cheese. In agreement with this, several authors have suggested that shorter coagulation times observed in Cheddar cheese elaborated with higher protein levels may result from rennet addition adjusted to casein concentration, thereby increasing both enzyme and substrate availability (Govindasamy-Lucey et al., Reference Govindasamy-Lucey, Jaeggi, Martinelli, Johnson and Lucey2011). In addition, increasing casein concentration reduces the intermicellar distance, which may facilitate micellar aggregation once κ-casein hydrolysis has occurred, contributing to faster gel formation (Guinee et al., Reference Guinee, O'kennedy and Kelly2006; Mistry and Maubois, Reference Mistry and Maubois2017).
Whey volume and composition
The volume of whey obtained decreased as the protein content of the processing milk increased for both FD and VD treatments. This reduction in whey volume as total solids of milk increased due to a greater addition of UFM to the milk mixture has been reported by other authors in different types of cheeses (Gimenez et al., Reference Gimenez, George, Spotti, Perotti, Hynes and Bergamini2025; Govindasamy-Lucey et al., Reference Govindasamy-Lucey, Jaeggi, Bostley, Johnson and Lucey2004; Panthi et al., Reference Panthi, Kelly, O'Callaghan and Sheehan2019). This may occur due to the higher concentration of soluble proteins in M1 and M2 milks, which have the capacity to retain water, as has also been observed in other research studies (Guinee et al., Reference Guinee, Pudja, Reville, Mulholland, Cotter and Cogan1995). According to the fat and protein concentration in the whey, the concentrations of both components increased significantly as the amount of UFM added increased, for both FD and VD (Table 2). This is consistent with findings reported by other authors (Govindasamy-Lucey et al., Reference Govindasamy-Lucey, Jaeggi, Martinelli, Johnson and Lucey2011; Guinee et al., Reference Guinee, O'kennedy and Kelly2006; Ong et al., Reference Ong, Dagastine, Kentish and Gras2013).
Electrophoretic profiles of insoluble cheese fractions at pH 4.6 during ripening. A: cheeses M0, B: cheeses M1 and C: cheeses M2. Standards of αs1-casein and β-casein were run in the first and last lanes of each gel.

Cheese yield
Practical and TYs were higher in UF cheeses than in control cheeses for both FD and VD treatments (Table 2). TYs exceeded practical values because TYs are derived from the compositional balance of milk, cheese and whey, whereas PYs are also affected by processing variability and operational losses. The increase in yield is mainly associated with the higher protein (Figure 2) and fat contents of the cheese-milk.
Mean values and standard deviations correspond to integrated optical density for the fractions analysed by urea-PAGE during miniature cheese ripening. Significance of effects of protein concentration in the milk used for cheesemaking (F1), procedure of adding the coagulant (F2) and time of ripening (F3) and their interaction on casein fraction levels

Table 5 Long description
Mean integrated optical density with standard deviation is reported for four casein fractions at ripening times F3 of 0, 15, 30, and 45, split by coagulant procedure F2 with FD and VD, and by milk protein concentration F1 with M0, M1, and M2. For gamma casein, FD values are 1.91 plus or minus 0.03 at time 0 for M0, 2.04 plus or minus 0.08 at 15 for M0, 2.20 plus or minus 0.05 at 30 for M0, and 2.23 plus or minus 0.02 at 45 for M0; VD values include 1.89 plus or minus 0.20 at time 0 for M0 and 2.28 plus or minus 0.07 at 45 for M0. For beta casein, FD values for M0 are 8.25 plus or minus 0.06 at time 0, 8.06 plus or minus 0.09 at 15, 7.88 plus or minus 0.08 at 30, and 7.39 plus or minus 0.13 at 45; VD values for M1 are 8.78 plus or minus 0.04 at time 0, 8.78 plus or minus 0.00 at 15, 8.34 plus or minus 0.01 at 30, and 8.39 plus or minus 0.07 at 45. For alpha S1 casein, FD values for M0 are 11.73 plus or minus 0.05 at time 0, 12.03 plus or minus 0.04 at 15, 9.89 plus or minus 0.21 at 30, and 9.84 plus or minus 0.15 at 45; VD values for M2 are 11.77 plus or minus 0.13 at time 0 and 9.89 plus or minus 0.22 at 45. For alpha s1I casein, FD values for M0 are 1.56 plus or minus 0.14 at time 0, 1.80 plus or minus 0.08 at 15, 2.19 plus or minus 0.21 at 30, and 2.35 plus or minus 0.24 at 45; VD values for M1 are 1.60 plus or minus 0.07 at time 0 and 2.87 plus or minus 0.16 at 45. The significance section lists, for gamma casein, F1 significant, F2 not significant, and F3 significant; for beta casein, F1 significant, F2 not significant, and F3 not significant; for alpha S1 casein, F1 not significant, F2 not significant, and F3 not significant; and for alpha s1I casein, F1 not significant, F2 not significant, and F3 significant.
Note: F1, protein concentration in the milk used for cheese manufacturing; F2, procedure of adding the coagulant: fixed dose (FD) or at a variable dose (VD); F3, ripening time; NS, no significant effect (P > 0.05).
* Significant effect (P < 0.05).
The increase in yield observed with increasing milk protein concentration is consistent with previous studies on ultrafiltered milk used for cheesemaking (Ong et al., Reference Ong, Dagastine, Kentish and Gras2013; Panthi et al., Reference Panthi, Kelly, O'Callaghan and Sheehan2019). Higher casein levels increase the proportion of rennet-reactive proteins and enhance the retention of fat and moisture within the curd matrix, contributing to improved cheese yield (Guinee et al., Reference Guinee, O'kennedy and Kelly2006). However, most previous studies have focused on Cheddar or soft cheeses, while information regarding semi-hard cheeses produced from highly protein-enriched milk remains limited. In this context, the present study provides additional insight into the technological performance of a traditional semi-hard Argentinian cheese manufacture when milk protein levels are increased through UF. In particular, the evaluation of protein concentrations up to 6.0% combined with two rennet dosing strategies showed that cheesemaking performance is strongly influenced by enzyme standardization relative to casein content. Protein and fat recoveries were within the ranges previously reported in the literature (Gimenez et al., Reference Gimenez, George, Spotti, Perotti, Hynes and Bergamini2025; Guinee et al., Reference Guinee, O'kennedy and Kelly2006; Heino et al., Reference Heino, Uusi-rauva and Outinen2010). The lower fat recovery observed in M2 cheeses was associated with greater fat losses in whey. Similar behaviour was reported by Ong et al. (Reference Ong, Dagastine, Kentish and Gras2013) when processing milk with a protein concentration of 5.8% (w/w), where increased gel porosity promoted the release of fat globules during curd cutting. Nevertheless, technological adjustments during cheesemaking may improve component retention. For example, Govindasamy-Lucey et al. (Reference Govindasamy-Lucey, Jaeggi, Martinelli, Johnson and Lucey2011) reported reduced nitrogen losses in UF-fortified cheeses when cutting time and coagulation temperature were adjusted according to milk protein content. Improving cheese yield is a key factor influencing the profitability of cheese plants (Papadatos et al., Reference Papadatos, Robinson, Tamime and Smit2003). In the present study, increasing milk protein concentration from 3.7% to 6.0% through UF significantly improved practical cheese yield in both treatments. PYs increased from approximately 11% in control cheeses (M0) to 16% in M1 and 21% in M2 cheeses, representing relative increases of about 45% and 90%, respectively. These results indicate that protein standardization by UF, combined with appropriate adjustments to rennet dosage and curd handling conditions, represents a promising technological strategy to improve both cheesemaking efficiency and economic sustainability in Tybo cheese production.
Peptide profiles of water-soluble extracts of cheeses. A: 0 days and B: 45 days of ripening. The profile corresponds to the six combinations tested (M0FD; M0VD; M1FD; M1VD; M2FD; M2VD), from one of the replicates. The other profiles are similar and are not presented.

Figure 4 Long description
A line graph with the horizontal axis labeled, Retention time and tick labels from 0 to 100. The vertical axis label reads, Absorbance 214 nm (mVolt). Six stacked line traces are labeled at the right side as M2VD, M2FD, M1VD, M1FD, M0VD and M0FD. The plotted lines show a tall spike near retention time 0, then mostly low variation until several peaks between about 70 and 90, followed by a drop near the far right edge. The image B showing a line graph with the horizontal axis labeled, Retention time and tick labels from 0 to 100. The vertical axis label reads, Absorbance 214 nm (mVolt). Six stacked line traces are labeled at the right side as M2VD, M2FD, M1VD, M1FD, M0VD and M0FD. The plotted lines show a tall spike near retention time 0, multiple peaks between about 20 and 40, additional peaks across about 45 to 90 and a drop near the far right edge.
Chemical composition and pH of cheeses
The chemical composition and pH of cheeses after 15 days of ripening are presented in Table 3. Moisture and fat contents were significantly higher in cheeses made with M2 and M1 compared to those produced with M0 (M2 > M1 > M0). In particular, the cheese obtained with M2 had high fat and moisture contents. According to the Argentine Food Code (CAA, 2025), and considering their moisture content, M2 cheeses are not classified as semi-hard cheeses. The higher moisture content in cheeses made with ultrafiltered milk is directly related to the reduced volume of whey generated during production, for both FD and DV. This is due to the higher concentration of proteins, mainly caseins and soluble proteins, in M1 and M2, which have a greater capacity to retain water and other solids, and the greater concentration of fat globules within the matrix (Guinee et al., Reference Guinee, Mulholland, Kelly and O'Callaghan2007). The use of milk with a higher protein content results in cheeses with a higher protein concentration, as also observed by other authors in soft cheeses made with UFM (Gimenez et al., Reference Gimenez, George, Spotti, Perotti, Hynes and Bergamini2025). No significant differences in pH and NaCl values were found between the different treatments. The recorded values for these parameters remained within the expected range for this type of cheese, which is consistent with the findings of other studies (Sihufe et al., Reference Sihufe, De Piante Vicín, Marino, Ramos, Nieto, Karlen and Zorrilla2018).
Cheese proteolysis
The nitrogen content of the different SN fractions (SN-pH 4.6, SN-TCA and SN-PTA) increased significantly during cheese ripening (Table 4). During ripening, M0 cheeses generally showed significantly lower SN-pH 4.6 values (P < 0.05) than M1 and M2 cheeses, except at 45 days, when similar levels were observed among treatments. No significant differences were associated with the procedure used for coagulant addition.
The increase in SN fractions reflects the progressive proteolysis occurring during cheese ripening (McSweeney, Reference McSweeney2011; Sousa et al., Reference Sousa, Ardö and McSweeney2001; Upadhyay et al., Reference Upadhyay, McSweeney, Magboul, Fox, Fox, McSweeney, Cogan and Guinee2004). Consistent with these results, electrophoretic profiles were similar among treatments (Figure 3), showing a progressive increase in the intensity of the αs1-I-casein (f24–199) band during ripening. This peptide is a well-known product of αs1-casein hydrolysis, and its accumulation is commonly used as an indicator of primary proteolysis in ripened cheeses.
Table 5 shows the integrated optical density values for the analysed fractions. Both αs1-I-casein (f24–199) and γ-caseins increased significantly during ripening, reflecting the degradation of αs1-casein and β-casein, respectively (McSweeney et al., Reference McSweeney, Pochet, Fox and Healy1994). In the case of γ-caseins, significant differences were observed depending on the protein concentration of the milk used for cheesemaking (Table 5), with lower values recorded in M2 cheeses regardless of ripening time or rennet addition procedure. For β-casein, significant differences associated with milk protein concentration were also observed, with higher values in M1 cheeses throughout ripening.
It should be noted that differences in moisture and protein content among treatments may also influence proteolytic activity during ripening, as moisture plays a key role in regulating enzyme diffusion and activity within the cheese matrix. However, these compositional differences are inherent to the protein standardization strategy evaluated in this study.
The RP-HPLC chromatograms of the water-soluble fraction are very useful indices to show the characteristic proteolytic pattern of cheese varieties (Fox et al., Reference Fox, Guinee, Cogan and McSweeney2017). In our case, chromatographic patterns were similar for all cheeses studied (Figure 4); no significant changes were observed between the chromatograms in relation to the different conditions evaluated, a result that indicates no significant impact on the expected ripening for this type of cheese. This lack of differences among treatments is a desirable outcome since it demonstrates that the technological intervention did not alter the characteristic ripening profile of the cheese. Ripening time had a significant effect on the chromatographic areas studied. Cheeses at 45 days of ripening showed a greater number of peaks, and they were higher than those obtained for the other ripening times. This pattern is consistent with the observations made in the other maturation parameters studied.
According to the ripening parameters evaluated (SN fractions, electrophoretic profiles and RP-HPLC chromatograms), all cheeses showed a similar pattern of proteolysis during ripening. This result suggests that increasing milk protein concentration through UF did not substantially alter the overall course of primary proteolysis. Previous studies have reported contrasting effects of ultrafiltered milk on cheese proteolysis, depending mainly on the concentration factor and rennet dosage used during cheesemaking. In some cases, delayed proteolysis has been observed in UF cheeses compared with control cheeses, attributed to higher concentrations of whey proteins and enzyme inhibitors or to reduced residual coagulant activity. However, when rennet dosage is adjusted according to milk protein or casein concentration, proteolytic activity during ripening may be comparable to that observed in cheeses made from unconcentrated milk. Similar behaviour was recently reported by Gimenez et al. (Reference Gimenez, George, Spotti, Perotti, Hynes and Bergamini2025), who observed slightly higher proteolysis in Cremoso cheese produced with UF milk when rennet dosage was standardized according to protein content. These findings indicate that the effect of UF on cheese ripening is strongly dependent on cheesemaking conditions, particularly enzyme dosage and moisture control.
Conclusions
Increasing milk protein concentration through UF significantly improved cheesemaking yield in semi-hard cheese manufacture. However, coagulation behaviour was strongly influenced by the rennet dosing strategy. Standardizing rennet addition according to casein concentration allowed better control of coagulation when highly protein-enriched milk was used. Despite differences in milk composition, the overall pattern of proteolysis during ripening was not markedly affected, suggesting that UF-standardization preserves the biochemical identity of the variety while enhancing industrial efficiency. These findings demonstrate that UF represents an effective strategy for increasing cheesemaking efficiency in Tybo cheese manufacture, if coagulation parameters and rennet dosage are properly adjusted according to milk protein concentration. In addition, this work provides novel information on the technological performance of traditional Argentine Tybo cheeses, a category that remains poorly documented in the scientific literature, thereby supporting future industrial applications.
Author Contributions
G.M.L.A.: Conceptualization, Methodology, Investigation, Data curation, Writing – original draft. G.A.S.: Conceptualization, Methodology, Supervision, Writing – review & editing. I.N.: Methodology, Formal analysis, Writing – review & editing. M.G.B.: Investigation, Methodology, Writing – review & editing. S.N.C.: Investigation, Formal analysis, Writing – review & editing. A.L.C.: Resources, Methodology, Writing – review & editing. J.G.K.: Resources, Investigation, Writing – review & editing. L.M.C.: Conceptualization, Methodology, Supervision, Project administration, Funding acquisition, Writing – review & editing.
Declaration of interest
Gabriela María de Luján Audero, Guillermo Adrián Sihufe, Ignacio Niizawa, Mara Gisela Biglione, Sonia Natalia Campos, Alejandra Lorena Cuatrín, Joselina Graciela Karlen and Luciana María Costabel declare that they have no conflict of interest.
Data availability statement
The data that support the findings of this study are available from the corresponding author upon reasonable request.
Ethics and approvals
This article does not contain any studies with human or animal subjects, so no ethical approval was required.
Funding statement
This study was conducted with the financial support of the National Institute for Agricultural Technology (projects: 2019-PD-E7-I152-001; 2019-PD-E7-I153; 2023-PE-L04-I088; 2023-PD-L04-I121).