


Introduction
There are two types of defect-formation mechanisms that are found for implant isolation in semiconductors Reference Pearton (1) :
-
(i) the creation of midgap, damage-related levels, which trap the free carriers in the material. This type of compensation is stable only to the temperature at which these damage-related levels are annealed out.
-
(ii) the creation of chemically-induced deep levels by implantation of a species that has an electronic level in the middle of the bandgap. This type of compensation usually requires the implanted species to be substitutional and hence annealing is required to promote the ion onto a substitutional site. In the absence of outdiffusion or precipitation of this species, the compensation is thermally stable.
To date in the GaN materials system there has only been an examination of damage-induced isolation. Binari et.al.Reference Binari, Dietrich, Kelner, Rowland, Doverspike and Wickenden (2) investigated H+ and He+ isolation of n-GaN, with the material remaining compensated to over 850°C with He+ and 400°C with H+. There has also been work on N+ implantation into both n- and p-type GaN for damagerelated isolation.Reference Pearton, Abernathy, Vartuli, Zolper, Yuan and Stall (3) Very effective isolation of AlGaN heterostructure field effect transistor structures has been achieved with a combined P+/He+ implantation leading to sheet resistances of ≥1012 Ω/□ and an activation energy of 0.71 eV for the resistivity.Reference Harrington, Hsin, Liu, Asbeck, Lau, Khan, Yang and Chen (4) Some work has also been reported for isolation of InAlN using O+, F+ or N+ implantation, and for isolation of InGaN using the same species.Reference Zolper, Pearton, Abernathy and Vartuli (5)
To create chemically induced isolation, it is necessary to implant impurities with electronic levels in the GaN bandgap. In other compound semiconductors, species such as Fe, Cr, Ti and V have been employed, with other examples being O in AlGaAs (where Al-O complexes are thought to form)Reference Pearton, Iannuzzi, Reynolds and Peticolas (6) and N in GaAs (C), where C-N complexes are thought to form.Reference Zolper, Sherwin, Baca and Schneider (7)
In this paper we report on the creation of very high resistance regions (>1010Ω/□) in both n- and p-GaN by O+, Cr+, Fe+ or Ti+ implantation. The isolation is annealed out by 900 °C, suggesting that the concentration of thermally stable deep levels associated with these species is less than ∼7×1017 cm−3 in both n- and p-GaN.
Experimental
0.3μm thick n (Si-doped) or p (Mg-doped) type GaN layers were grown on 1μm thick undoped GaN on (0001) sapphire substrates by rf plasma activated Molecular Beam Epitaxy. The carrier concentration in the doped layers was 7×1017 cm−3 in each case. This structure simulates a GaN metal semiconductor field effect transistor (MESFET) or metal-oxide semiconductor FET (MOSFET) layer design. In some structures, 490 Å of Ti was deposited by e-beam evaporation on top of the GaN, and the implant performed through that layer. This procedure enabled us to achieve better near-surface isolation properties. Ohmic contacts were formed in a transmission line pattern (gap spacings of 2, 4, 8, 16 and 32μm) by e-beam evaporation and lift-off of Ti/Au (n-type) or Ni/Au (p-type) annealed at 700°C under N2. The total metal thickness was 4000Å, so that these regions could act as implanted masks. The samples were then implanted at 25°C using multiple-energy Ti+, O, Fe or Cr ions. The ion profiles were simulated by P-CODE™, while the displacement damage was simulated by the Transport-of-Ions-In-Matter (TRIM) code. An example of the calculated damage distribution for the O+ implant scheme is shown in Figure 1. The doses and energies were chosen to create an average ion concentration of ∼1019 cm−3 throughout the 0.3μm thick doped GaN layers.
Calculated vacancy concentration in a Ti/GaN sample implanted with five separate O+ implants at energies from 30-325 keV.

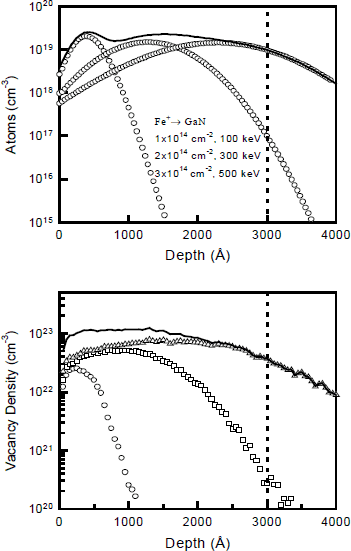
In this case, the O+ was implanted through the Ti overlayer. In the case where the implanted species is chemically active in the GaN it is the ion profiles that are the important feature, since it is the electrically active fraction of these implanted species that determines the isolation behavior. In the case where the isolation simply results from damage-related deep levels, then it is the profile of ion damage that is important. Figure 2 shows both the calculated ion profiles (top) and damage profiles (bottom) for the multiple energy Fe+ implant scheme, obtained from TRIM simulations. Note that the defect density is generally overstated in these calculations due to recombination of vacancies and interstitials. In any case, the doses are below the amorphization threshold for GaN.
Ion (top) and damage (bottom) profiles for multiple energy Fe+ implant sequence into GaN.
Results and Discussion
Figure 3 shows the evolution of sheet resistance with annealing temperature for the sample implanted with O+ ions through the Ti over-layer. In this case, a very high maximum sheet resistance was achieved (4×10¹² Ω/ ). This is the highest value reported in GaN. The compensation mechanism is creation of deep electron traps that remove electrons from the conduction band. Upon annealing, some of these damage-related traps are removed, allowing electrons to be returned to the conduction band. The use of the Ti over-layer allows better compensation in the near-surface region and hence a higher as-implanted sheet resistance. The subsequent evolution of the sheet resistance with annealing temperature is similar to the case of implantation without the Ti over-layer, except that the absolute value is larger up to ∼600 °C. Secondary Ion Mass Spectrometry (SIMS) measurements on the samples showed that the implanted oxygen did not have any detectable redistribution at 800 °C, consistent with the low diffusivities reported previously.Reference Zolper (8)
Annealing temperature dependence of sheet resistance in O+ implanted GaN. The implant was performed directly into the GaN.

Figure 4 shows the annealing temperature dependence of sheet resistance for Cr+ (top) and Fe+ (bottom) implanted n- and p-type GaN. The trends in the sheet resistance are typical of those observed with damage-related isolation. The as-implanted resistance is 6-7 orders of magnitude higher than that of the unimplanted material due to creation of deep traps that remove carriers from the conduction and valence bands. Subsequent annealing tends to further increase the sheet resistance, by reducing the probability for hopping conduction as the average distance between trap sites is increased.(9,10) Beyond particular annealing temperatures (500-600°C in this case) the trap density begins to fall below the carrier concentration and carriers are returned to the conduction or valence bands. This produces a decrease in sheet resistance toward the original, unimplanted values. If Cr or Fe produced energy levels in the bandgap with concentrations greater than the carrier density in the material, then the sheet resistance would remain high for annealing temperatures above 600°C. For these two impurities it is clear that the electrically active concentration of deep states is <7×1017 cm−3, otherwise all the carriers would remain trapped beyond an annealing temperature of 600oC. Basically, the same trends were observed for Ti+ implants.
Evolution of sheet resistance of GaN with annealing temperature after either Cr+ (top) or Fe+ (bottom) implantation.

Figure 5 shows Arrhenius plots of the sheet resistance of Cr+ (top) or Fe+ (bottom) implanted n- and p-type GaN annealed at either 450°C (n-type) or 600°C (p-type). These annealing temperatures were chosen to be close to the point where the maxima in the sheet resistances occur for the two different conductivity types. The activation energies derived from these plots represent the Fermi level position for the material at the particular annealing temperatures employed. Note that the values are far from midgap (1.7 eV for hexagonal GaN), but are still large enough to create very high sheet resistances in the ion damaged material. Within the experimental error (±0.04 eV), the activation energies are the same for Cr+ and Fe+ implants for both conductivity types. This again suggests the defect states created are damage-related and not chemical in nature.
Arrhenius plots of sheet resistance in Cr+ (top) or Fe+ (bottom) implanted n- and p-GaN, after annealing at either 450°C (n-type) or 600°C (p-type).

The activation energies obtained for O+ and Ti+ implants were similar to those obtained with Cr+ or Fe+ implants, except for the case of O+ into n-GaN where the energy was in the range of 0.20-0.29 eV. This difference may be related to the lower damage density with O+ implantation described earlier. The defect states in the gap are most likely due to point defect complexes of vacancies and/or interstitials and the exact microstructure of these complexes and their resultant energy levels are expected to be very dependent on damage density and creation rate.Reference Stavola (11) This might also explain the differences reported in the literature for the activation energies obtained with different implant species.
Figure 6 shows a schematic of the energy level positions found in this work for Ti, Cr, Fe and O implanted p- and n-type GaN annealed to produce the maximum sheet resistance. Although the levels are not at midgap as is ideal for optimum compensation, they are sufficiently deep to produce high resistivity material. In GaN contaminated with transition metal impurities, non-phonon-assisted photoluminescence lines attributed to Fe3+ at 1.3 eV and Ti2+ at 1.19 eV have been reportedReference Pressel, Thurian, Edgar, Strite, Akasaki, Amano and Wetzel (12) , but to date there are no electrical measurements.
Schematic representation of the position in the energy gap of defect levels from Fe, Cr, Ti or O implant isolation in GaN.

Summary and Conclusions
We can draw the following conclusions from this work:
-
1. Sheet resistances of ∼1012 Ω/□ in n-GaN and ∼1010 Ω/□ in p-GaN can be achieved by implantation of Cr, Fe, Ti, or O.
-
2. The sheet resistance remains above 107 Ω/ until annealing temperatures of ∼650 °C, which defines the thermal stability of acceptable GaN device isolation.
-
3. Ti, O, Fe and Cr do not produce electrically active deep energy levels in the GaN bandgap with concentrations approaching 7×1017 cm−3 when introduced by implantation. GaN implanted with these species displays typical damage-related isolation behavior, with no evidence of chemically induced thermally stable isolation.
-
4. The activation energies for the sheet resistance of the implanted GaN are in the range 0.2-0.49 eV in n-type and ∼0.44 eV for p-type.
Acknowledgements
The work at UF is partially supported by grants from DARPA/EPRI (J. Melcher/D. Radack), contract MDA 972-98-1-0006, monitored by ONR (J.C. Zolper) and by an NSF grant, DMR 97-32865 (L.D. Hess). Sandia is a multi-program laboratory operated by Sandia Corporation, a Lockheed-Martin company, for the US Department of Energy under grant no. DEAC 04-94-AL-85000. The work of RGW is partially supported by a grant from ARO (J.M. Zavada).



