INTRODUCTION
Age at the onset of sexual maturity is an important aspect of life history, particularly in relation to reproductive strategy and competition for mates (Stearns, Reference Stearns1992). In crustaceans, age determination is hindered by the lack of hard structures bearing annuli (Sheehy, Reference Sheehy1990). Instead, body size is often used as a proxy for age, but needs to be interpreted with care, since growth rate may vary considerably with a variety of factors (Hartnoll, Reference Hartnoll, Bliss and Abele1982). In decapod species, gonad maturity (physiological maturity), behavioural maturity (functional maturity) and sex-specific allometric growth (morphological maturity) may occur at different stages (Hartnoll, Reference Hartnoll, Bliss and Abele1982; Hall et al., Reference Hall, Smith, de Lestang and Potter2006). Physiological maturity is generally difficult to determine and requires gonadal inspection or histology (McQuaid et al., Reference McQuaid, Briggs and Roberts2006). Functional maturity is comparatively easy to determine in females, since it is indicated by the presence of eggs externally, but remains difficult for males (McQuaid et al., Reference McQuaid, Briggs and Roberts2006). In principle, morphological maturity is straightforward to determine, because many species exhibit allometric growth of body parts used in reproduction or sexual competition (Miller, Reference Miller1973; Tuck et al., Reference Tuck, Atkinson and Chapman2000; Lizarraga-Cubedo et al., Reference Lizarraga-Cubedo, Tuck, Bailey, Pierce and Kinnear2003; Hall et al., Reference Hall, Smith, de Lestang and Potter2006) and only simple measurements of external features are required. However, the precision of estimates of the average size of morphological maturity can depend on how well defined is the onset of allometric growth. In turn, the distinctness of such discontinuities in morphological relationships depends on how rapidly the relative growth of allometric features changes in individuals and on the degree of individual variability in the body size at which allometric growth begins.
Ontogenetic variation in morphology is generally marked in decapods, with an immature growth phase that terminates with the ‘puberty moult’, after which there is typically a marked change in allometric growth. Generally, males exhibit positive allometry in cheliped length, whereas females of many species have positive allometric growth in abdomen width (Hartnoll, Reference Hartnoll1974; Clayton, Reference Clayton1990). Greater abdominal width in females is considered to be an adaptation for carrying eggs and positive allometry in male cheliped length is hypothesized to be an adaptation for intrasexual competition for mates (Farmer, Reference Farmer1974; Hartnoll, Reference Hartnoll1974; Berrill & Arsenault, Reference Berrill and Arsenault1982; Smith et al., Reference Smith, Huntingford, Atkinson and Taylor1994a, Reference Smith, Huntingford, Atkinson and Taylorb; Sneddon et al., Reference Sneddon, Huntingford and Taylor1997; Correa et al., Reference Correa, Baeza, Hinojosa and Thiel2003).
The squat lobster Munida rugosa (Fabricius, 1775) is widely distributed in coastal waters of the north-eastern Atlantic and can occur at high population densities (Howard, Reference Howard1981), but often with a clustered distribution (Trenkel et al., Reference Trenkel, Le Loc'h and Rochet2007). Although the reason for such aggregations is unknown, a consequence is that in certain habitats, there may be intense intraspecific competition for resources such as food, shelter and mates. Previous studies suggest that, as in other decapod crustaceans (Farmer, Reference Farmer1974; Hartnoll, Reference Hartnoll1974; Sneddon et al., Reference Sneddon, Huntingford and Taylor1997; Correa et al., Reference Correa, Baeza, Hinojosa and Thiel2003), competition among mature individuals, particularly males, is mediated by agonistic interactions in which the chelipeds are used in displays and as weapons (Pothanikat, Reference Pothanikat2005; Claverie & Smith, Reference Claverie and Smith2007). However, little is known about the biology of M. rugosa. Ovigerous females are observed from November to May (Zainal, Reference Zainal1990) and reproduction seems to occur in late October (Pothanikat, Reference Pothanikat2005). However, the size at maturity in this species remains unknown and this is fundamental information required to investigate agonistic interactions in appropriate contexts (Stearns, Reference Stearns1992). The aims of the present study were to describe ontogenetic changes in relative growth of body parts in M. rugosa, to investigate patterns of asymmetry in cheliped length and to estimate size at the onset of sexual maturity in males and females.
MATERIALS AND METHODS
Collection of specimens and measurements
Munida rugosa were collected during June 2005 (for morphological measurement) and in December 2006 (to investigate the proportion of ovigerous females) in the Firth of Clyde, Scotland, by beam-trawling (2-m beam trawl, 50-mm mesh) on gravelly–muddy bottoms at water depths ranging from 35 to 40 m. Individuals collected in June 2005 with both chelipeds intact (no injury or deformity) were returned alive to the laboratory for examination. Carapace length (CL), the length of both chelipeds and the width of the second abdominal segment of each individual were measured with Vernier callipers to 0.1 mm accuracy. A total of 265 animals from the June 2005 sample were measured (160 male and 105 female), ranging in CL from 8 mm to 38 mm. Females collected in December 2006 were recorded as ovigerous or not and their CL was measured. A total of 281 females were measured from the December 2006 sample, ranging in CL from 14 mm to 39 mm. Various CL measurements of M. rugosa have been used in previous studies (Ingrand, Reference Ingrand1937; Hartnoll et al., Reference Hartnoll, Rice and Attrill1992; Combes, Reference Combes2002). Consequently, the variability of different measurements was also evaluated to select the most reliable one.
Evaluation of carapace length variability
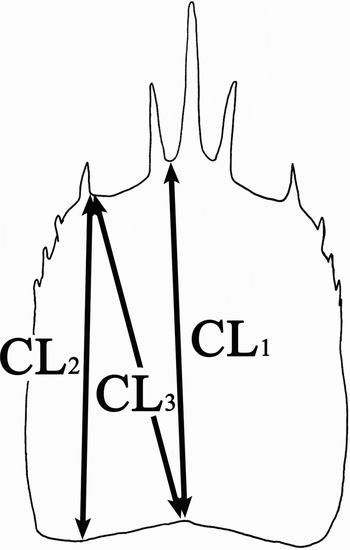
Fourteen animals were externally tagged by attaching individually numbered rigid disc tags (16 mm diameter) to the merus of one of the chelipeds. Three positions of measurement of carapace length (CL1–3) were made with Vernier callipers to the nearest 0.1 mm (Figure 1). Measurements were repeated 10 times by the same person at time intervals long enough to prevent values being remembered (24 hours).
Measurements of carapace length.

The corrected coefficients of variation (V*) of the measurements for each individual and each measurement position were calculated as follows (Sokal & Rohlf, Reference Sokal and Rohlf2001).
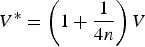
where n is the sample size and V the coefficient of variation, calculated as follows (Sokal & Rohlf, Reference Sokal and Rohlf2001):
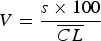
where s is the standard deviation and  the average of the CL measurements of a particular type for each individual.
Corrected coefficients of variation (for CL1, CL2 and CL3) were compared among measurement positions with a general linear model, with individual identity included as a random effects factor.
Linear relationships among CL1, CL2 and CL3 were tested with a model II regression, major axis regression, since each variable was measured with error and in the same unit of measurement (Sokal & Rohlf, Reference Sokal and Rohlf2001).
Assessment of cheliped asymmetry
Symmetry in cheliped length was investigated separately for males and females using an analysis of covariance (ANCOVA). Cheliped length (log-transformed for normality) was examined as a function of ‘side’ (left or right) and log10(CL) to test for directional asymmetry. A strong relationship between cheliped length and CL was expected, but directional asymmetry would be indicated by a significant effect of ‘side’. The inclusion of the interaction between CL and side in the model, allowed testing for variations in symmetry pattern with animal size. Antisymmetry (e.g. chelipeds always asymmetrical, but with neither the right nor left being consistently longer) would be indicated by a bimodal distribution of residuals from the ANCOVA.
Determination of the morphological size of sexual maturity
The average of the left and right cheliped lengths for males and abdominal width for females (second segment) were used to investigate the existence of a transitional CL (a discontinuity in relative growth) indicating the size at morphological puberty. The iterative segmental regression method of Lovett & Felder (Reference Lovett and Felder1989) was used to identify the transitional CL. Untransformed data were used to determine the transitional point, since it is not clear whether log-transformed data are appropriate for assessing discontinuities in relative growth of body parts in crustaceans (Lovett & Felder, Reference Lovett and Felder1989). Both variables (dependent and independent) were subject to measurement error, so a model II (reduced major axis (RMA)) regression was used (Sokal & Rohlf, Reference Sokal and Rohlf2001). The fit of the segmental regression was assessed by a runs test of the randomness of the sequence of positive and negative residuals (Lovett & Felder, Reference Lovett and Felder1989). The transitional CL at the onset of allometric growth was indicated when the probability of randomness of residuals was maximal. To allow comparison with other species and since the large majority of studies have used log-transformed data for analysing allometric growth (Hartnoll, Reference Hartnoll1974, Reference Hartnoll, Bliss and Abele1982), model II regressions of log-cheliped length on log-carapace length have been calculated. The coefficient of determination (r 2) (Sokal & Rohlf, Reference Sokal and Rohlf2001), was calculated for each regression to indicate the strength of the relationship between the two variables. Allometry was assessed by testing whether the regression coefficient (slope) differed significantly from 1 with Student's t-test (Zar, Reference Zar1999).
Evaluation of the carapace length at which 50% of females were ovigerous
The proportion of ovigerous females was calculated in size-classes of 1 mm. To estimate the size at 50% of female maturity, the following logistic equation was fitted, using non-linear regression, to the relationship between the proportion of ovigerous females and CL (Somerton, Reference Somerton1980):
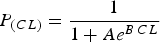
where P (CL) is the proportion of ovigerous females at size CL and A and B are parameters to be estimated. Weighting factors for the regression were calculated as indicated by Somerton (Reference Somerton1980). Non-linear regression and 95% confidence intervals for the CL at which P (CL) = 0.5 were computed with the software R 2.6.2 (R Development Core Team, 2006).
RESULTS
Variability in carapace length measurements
There was no significant difference in measurement variability among measurement methods (F 2,26 = 0.78, P = 0.471) or individuals (F 13,26 = 1.87, P = 0.085). Consequently, the three methods seem to have similar precision of measurement. However, measurement CL1 had the smallest mean corrected coefficient of variation ( ). CL2 and CL3 had, respectively, mean corrected coefficients of variation of 1.106 and 0.804. Consequently, CL1 (distance from the base of the rostrum to the intersection of the mid-line and the posterior edge of the carapace) was chosen as the standard measurement of carapace length for the present study.
There were significant linear relationships between CL1 and CL2 (RMA regression: CL2 = 0.9791 CL1–0.8293, P < 0.001), CL1 and CL3 (CL3 = 0.9719 CL1–0.6956, P < 0.001), and CL2 and CL3 (CL3 = 0.9926 CL2 + 0.1279, P < 0.001).
Assessment of cheliped asymmetry
There was no significant difference in the length of left and right chelipeds for males (F 1,316 = 0.31, P = 0.58) or for females (F 1,214 = 0.00, P = 0.95). There was no significant effect of the interaction between CL and side for males (F 1,316 = 0.31, P = 0.58) or for females (F 1,214 = 0.01, P = 0.94). Finally, the residuals were not bimodally distributed in relation to either sex. Therefore, these results suggest symmetry in cheliped length, on average, for M. rugosa.
Morphological determination of the onset of sexual maturity
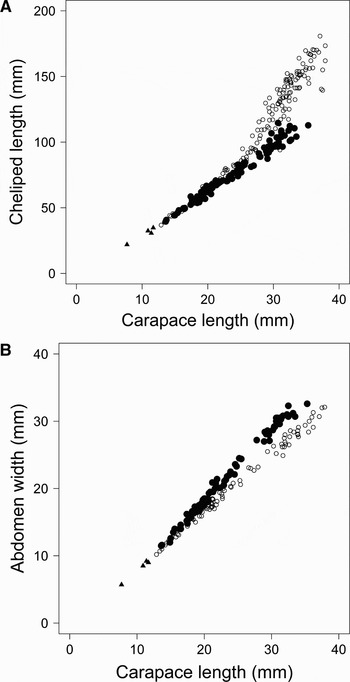
The relationships of cheliped length (Figure 2A) and abdomen width (Figure 2B) to CL for males and females, respectively, indicate the existence of a transitional CL that marks a change in relative growth of cheliped length for males and abdomen width for females.
Average cheliped length (A) and 2nd abdominal segment width (B) as a function of carapace length for males (○), females (•) and indeterminate sex (▴).

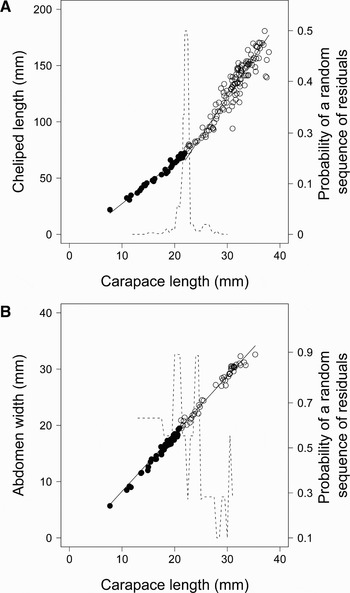
The probability of a random sequence of positive and negative residuals in the segmental regressions (Lovett & Felder, Reference Lovett and Felder1989) was maximized when the transitional point was set to 22 mm CL for male cheliped length and between 20 and 21 mm CL for female abdomen width (Figure 3). There was a second high probability for females corresponding to a transitional point of 24 mm CL, but the probability (P = 0.908) was slightly smaller than the transitional point at 21 mm CL (P = 0.913).
Results of a segmental regression of cheliped length (A) and second abdominal segment width (B) on carapace length (CL) in male (A) and female (B) Munida rugosa. The dashed line represents the probability of a random sequence of residuals as a function of the transitional CL between two regression functions (solid lines). •, pre-puberty animals; ○, post-puberty animals.

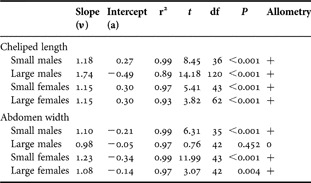
Slopes of regressions of the log-transformed data showed that there was positive allometric growth of chelipeds for both sexes, but this was more marked for males larger than the transitional CL (Table 1). Small males and females showed only slight, but significant positive allometry of cheliped length. Small males had a slight positive allometry in abdomen width, but males larger than the transitional CL showed apparently isometric growth of abdomen width (Table 1). Small females had a greater allometric growth of abdomen width than females larger than the transitional CL (Table 1).
Slope and intercept of reduced major axis regression. t-test values and probability of isometry (slope >1, + positive allometry, 0 isometry).

Carapace length for 50% of ovigerous females
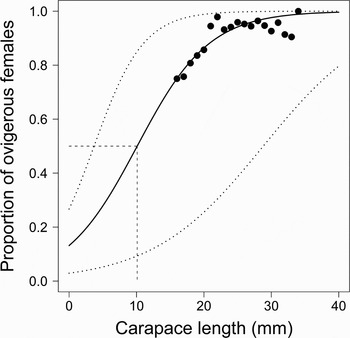
The estimated CL at 50% maturity of females was estimated to be 10.1 mm CL, but with a wide asymmetrical 95% confidence interval (3.71–28.8 mm CL) (Figure 4). The point estimate is below the size of the smallest female captured, which explains the wide confidence interval.
Proportion of ovigerous females depending on carapace length (1 mm size-class) and associated logistic fit (full line) ±95% interval (dotted lines).

DISCUSSION
Many previous studies have identified discontinuities in the relative growth rate of crustacean body parts, such as chelipeds in males and abdomen width in females, which have been interpreted as indicating the morphological size of maturity (Hartnoll, Reference Hartnoll1974, Reference Hartnoll, Bliss and Abele1982; Tuck et al., Reference Tuck, Atkinson and Chapman2000; Hall et al., Reference Hall, Smith, de Lestang and Potter2006). In the present study, positive allometry in cheliped length was observed in males and females over the entire size-range of animals examined. Females appeared to have a constant relative growth rate of chelipeds over the entire size-range and males had a marked increase in relative growth rate after 22 mm CL. Slight positive allometry in abdomen width was observed in small males, but with a lower relative growth rate than in small females. Above 22 mm CL, abdomen width appeared to grow isometrically in males. Positive allometry in abdomen width was found for the entire size-range of females, but with a decrease in relative growth rate at a carapace length of 21 mm CL. However, the morphological size of maturity of 21 mm CL in females is doubtful, since nearly all of the specimens collected were larger than the size corresponding to 50% of ovigerous females and even in the smallest size-class examined (16 mm), 75% of females were ovigerous. Also the lack of a marked peak in probability of random residuals from the segmental regression and the small change in female abdomen allometry at the transitional CL suggest that the morphological size of maturity is not well defined in the measured females. This could only be resolved in future if it were possible to sample smaller females.
These allometric patterns could be interpreted as a reallocation of energy expenditure after maturation leading to variation in growth rate due to ‘competition’ between developing organs (Nijhout & Emlen, Reference Nijhout and Emlen1998). Mature females with a broader abdomen are presumably able to carry more eggs (Farmer, Reference Farmer1974; Hartnoll, Reference Hartnoll1974). After maturation, energy is needed to produce eggs, and the abdomen could be wide enough to effectively carry all the eggs produced by the female, consequently allometric abdominal growth rate may be slowed for older females. Positive abdominal allometry in juvenile males could be linked to the ‘tail flip’ escape reaction; this allometry has been observed previously in males of other species (Hartnoll, Reference Hartnoll1974). The transition from positive allometry to isometry of the abdomen width at maturity could be explained by a change in energy allocation, such as an increase in cheliped and gonad development. Increased relative growth of chelipeds in males after puberty is common in Crustacea (Hartnoll, Reference Hartnoll1974, Reference Hartnoll, Bliss and Abele1982; Clayton, Reference Clayton1990) and is likely to be an evolutionary response to male–male competition for access to mates (Sneddon et al., Reference Sneddon, Huntingford and Taylor1997; Correa et al., Reference Correa, Baeza, Hinojosa and Thiel2003). Since chelae are used for agonistic interactions in M. rugosa (Pothanikat, Reference Pothanikat2005; Claverie & Smith, Reference Claverie and Smith2007) and cheliped length is expected to confer an advantage during male–male interactions (Smith et al., Reference Smith, Huntingford, Atkinson and Taylor1994b; Sneddon et al., 1997), selective pressure based on sexual selection could have led to the enlarged male chelipeds in this species, as in other decapods (Lee, Reference Lee1995). Allometry in female cheliped length (although slight in M. rugosa) has been observed in crustaceans (Hartnoll, Reference Hartnoll1974) and may be due to intraspecific competition for food or shelter (Hartnoll, Reference Hartnoll1974; Debuse et al., Reference Debuse, Addison and Reynolds2001). Allometry in cheliped length could also be an anti-predator adaptation (Davenport et al., Reference Davenport, Spikes, Thornton and Kelly1992). Such allometry would be the result of natural selection, rather than sexual selection—unless there is competition between females for access to males or resources needed for mating, as suggested in Homarus americanus (Karnofsky et al., Reference Karnofsky, Atema and Elgin1989).
ACKNOWLEDGEMENTS
This work was funded by the Sheina Marshall Bequest from the University Marine Biological Station, Millport. We would like to acknowledge the crew of RV ‘Aplysia’ (UMBSM) for help with sampling, Professor R.J.A. Atkinson for his advice and anonymous referees for their valuable comments.