Popular support for democracy is an important and frequent variable in the political science literature, given its status as a prerequisite for democratic consolidation and its ability to foster increases in political and civil liberties (Diamond Reference Diamond1999, 65; Norris Reference Norris2011, 233–34; Rose, Mishler, and Haerpfer Reference Rose, Mishler and Haerpfer1998, 91). High levels of support for democracy across region (Norris Reference Norris and Norris1999, 17), culture (Inglehart and Norris Reference Inglehart and Norris2003, 64), and regime type (Dalton and Shin Reference Dalton, Shin, Dalton and Shin2006, 85) therefore suggest that many countries already possess a key prerequisite for democratic transition and democratization. But this assessment might be premature because many studies exclude from analysis persons who did not provide a substantive response when asked to support or oppose democracy for their country.Footnote 1 In this article, we illustrate the problem with exclusion of nonsubstantive responders, report correct levels of democratic support in certain countries, and offer suggestions for improving the study of popular support for democracy.
THE PROBLEM WITH EXCLUDING NONSUBSTANTIVE RESPONSES
Perhaps the most basic measure of popular support for democracy in a country is the percent of the population that agrees that democracy would be a good political system for their country. The English version of a World Values Survey item measuring support for democracy along these lines reads:
I'm going to describe various types of political systems and ask what you think about each as a way of governing this country. For each one, would you say it is a very good, fairly good, fairly bad, or very bad way of governing this country? … Having a democratic political system.
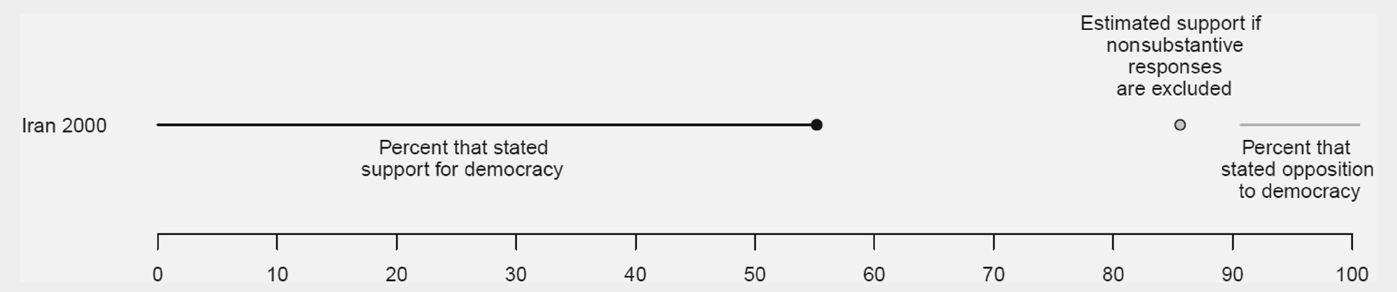
Figure 1 presents results to this item from the 2,532 respondents to the 2000 Iran Values Survey: 1,397 respondents indicated that democracy would be a “very good” or “fairly good” way to govern Iran, represented by the black line from 0% to the black dot at 55%; 235 respondents indicated that democracy would be a “fairly bad” or “very bad” way to govern Iran, represented by the gray line from 91% to 100%; and 900 respondents did not indicate whether democracy would be a good or bad way to govern Iran, represented by the gap from 55% to 91%.
Support for Democracy, Iran 2000
Note: Figure 1 presents the percentage of respondents to the 2000 Iran Values Survey that indicated that a democratic political system would be a good way to govern Iran (black line), that indicated that a democratic political system would be a bad way to govern Iran (gray line), and that did not indicate an opinion about whether a democratic political system would be a good or bad way to govern Iran (gap between the black and gray lines). The gray dot at 86% indicates how the percentage that indicated that a democratic political system would be a good way to govern Iran would be reported if the 36% of respondents that did not indicate an opinion were excluded.

Therefore, 55% of Iranian respondents at least paid lip service to the idea that democracy would be a good way to govern their country. But this percentage is artificially inflated when, as is commonly done, the calculation of support excludes observations of persons who did not indicate whether democracy would be a good or bad way to govern their country: if the 36% of the Iranian sample who did not select one of the “good way” or “bad way” options is excluded, then the 55% that expressed support is divided by the 64% that expressed support or opposition, resulting in a calculated level of 86% expressed support for democracy, represented by the gray dot in figure 1—an estimate that overstates expressed support by a full 31 percentage points.
But the 36% of Iranian respondents who declined to support or oppose democracy for their country should not be excluded: although these nonsubstantive responders have not rejected democracy with the same intensity as the 9% who expressly indicated that democracy would be a bad way to govern Iran, both groups have declined to endorse democracy as a good political system for their country. The practice of excluding nonsubstantive responses when reporting expressed support presumes that a situation of 86% expressed support, 14% expressed opposition, and 0% nonsubstantive response is equivalent to a situation of 55% expressed support, 9% expressed opposition, and 36% nonsubstantive response, and—for that matter—that both of these situations would be equivalent to a situation of 6% expressed support, 1% expressed opposition, and 93% nonsubstantive response. In each case, 86% of substantive responders support democracy, but a sample in which 86% express support for democracy is not equivalent to a sample in which 6% express support for democracy.
Figure 2 recreates figure 1 for the countries listed in table 1 of Inglehart (Reference Inglehart2003), with responses from East and West Germany combined. Gray dots represent the percentage expressed support for democracy reported in the article, but the percentage that includes nonsubstantive responses is indicated by the black dot at the end of the black line.Footnote 2 The gap between these percentages is often small, but the gap tends to be large in the nondemocratic countries for which measurement of support for democracy is critical.Footnote 3 For example, in 2001, 68% of respondents in Morocco and 73% of respondents in China indicated that democracy would be a good way to govern their country, but expressed support for democracy in these countries had been reported as 96% in studies that excluded nonsubstantive responses (see Dalton and Shin Reference Dalton, Shin, Dalton and Shin2006, 82; Inglehart Reference Inglehart2003, 52; Inglehart and Norris Reference Inglehart and Norris2003, 66; and Tessler Reference Tessler2002, 236).
Support for Democracy
Note: Figure 2 presents the percentage of respondents to selected European Values Studies and World Values Surveys that indicated that a democratic political system would be a good way to govern their country (black line), that indicated that a democratic political system would be a bad way to govern their country (gray line), and that did not indicate an opinion about whether a democratic political system would be a good or bad way to govern their country (gap between the black and gray lines). The gray dots indicate how the percentage that indicated that a democratic political system would be a good way to govern their country would be reported if the respondents that did not indicate an opinion were excluded.

Excluding nonsubstantive responses can also affect inferences about the correlates of support for democracy, given that nonsubstantive response can be associated with such predictors. For example, in the 2000 Iran Values Survey, nonsubstantive response to the “having a democratic political system” item negatively correlated with higher levels of formal education (r = −0.23, n = 2,424, p < 0.01), positively correlated with increased age (r = 0.09, n = 2,532, p < 0.01), and was higher among women than among men (41% and 31%, respectively, n = 2,532).
To illustrate the variation in inferences due to exclusion of nonsubstantive responses, we calculated predicted probabilities with CLARIFY (King, Tomz, and Wittenberg Reference King, Tomz and Wittenberg2000; Tomz, Wittenberg, and King Reference Tomz, Wittenberg and King2003) based on two logistic regressions using gender, age, and education as predictor variables; the dichotomous dependent variable in both regressions was coded 1 if the respondent indicated that democracy was a good way to govern Iran, and 0 if the respondent did not indicate that democracy was a good way to govern Iran. The first regression excluded nonsubstantive responders, and the second regression included nonsubstantive responders in the 0 category. This coding decision altered inferences about the influence of education on support for democracy and about relative levels of support for democracy: when nonsubstantive responses were excluded, with gender and age at their mean values, 95% confidence intervals for the predicted probability that a respondent indicated that democracy is a good way to govern Iran ranged from [76, 85] percent for the lowest level of formal education to [87, 92] percent for the highest level of formal education. But the predicted probability gap increased and absolute levels respectively fell to [33, 41] percent and [69, 75] percent when nonsubstantive responses were included.Footnote 4
SUGGESTIONS FOR HANDLING NONSUBSTANTIVE SURVEY RESPONSES
Studies should include nonsubstantive responses when calculating expressed support and should report the percentage of nonsubstantive responses so that readers see the range of possible levels of true support. For example, expressed support for a democratic Iran based on the 2000 Iran Values Survey sample could be presented as a [55, 91] percent interval, indicating that 55% of respondents expressed support, 9% of respondents expressed opposition, and the 36% reflected in the 55-to-91 interval did not provide a substantive response. This provides more and better information than an 86% point estimate and permits the reader to surmise that the level of true support for a democratic Iran in the sample is between 55% and 91%, depending on the percentage of nonsubstantive responders who censored their support for a democratic Iran.Footnote 5
But studies concerned with providing a more precise estimate of true support for democracy should report a thorough analysis of nonsubstantive responses to assess as best as possible the percentage of nonsubstantive responses that reflect censored support or censored opposition. For this task, omission of nonsubstantive responses—a practice known as listwise deletion—is not necessarily a bad technique: listwise deletion might inflate reports of expressed opinion (what respondents said), but listwise deletion does not bias reports of true opinion (what respondents think) as long as the distribution of opinion among substantive responders matches the distribution of opinion among non-substantive responders. For example, 86% as an estimate of true support for a democratic Iran is accurate to the extent that the ratio of true support among the 900 nonsubstantive responders matches the 86% expressed—and presumably true—support among the 1,632 substantive responders.
Listwise deletion is equivalent to treating observed cases as a random sample of all cases and thus assuming that unobserved cases are missing completely at random (see Allison Reference Allison2002, 646). But this is often not the case. In the 2000 Iran Values Survey sample, for example, women were more likely than men to not provide a substantive response to the “having a democratic political system” item. For this situation, in which nonsubstantive responses are not missing completely at random, researchers should use techniques that soften the missing-completely-at-random assumption, such as inverse probability weighting, multiple imputation, and Heckman selection modeling.
Inverse Probability Weighting
In inverse probability weighting, observed data are used to predict the probability of providing a substantive response; the value of the substantive response from each observed respondent is then weighted by the inverse of the predicted probability that a respondent with his or her characteristics provided a substantive response.
Our first inverse probability weighting analysis modeled the presence of a substantive response to the “having a democratic political system” item among respondents to the 2000 Iran Values Survey. This model used a regression equation with a variable for gender, a variable for age, and a formal education variable that ranged from 1 for incomplete elementary education to 8 for a university degree. Resulting predicted probabilities of a substantive response from a given respondent ranged from 39% to 85%; for example, a 65-year-old woman with an incomplete elementary education had a 43% chance of providing a substantive response. The inverse values of these probabilities were then used to weight substantive responses. For example, substantive responses from 65-year-old women with an incomplete elementary education were weighted by a factor of 2.3, which is the inverse of 43% (i.e., 1 divided by 0.43). Inverse probability weights ranged from 1.2 to 2.6, with a respective mean and standard deviation of 1.6 and 0.3. This first inverse probability weighting analysis produced a 95% confidence interval of [84, 87] percent true support for a democratic Iran among respondents to the 2000 Iran Values Survey.Footnote 6
Our second inverse probability weighting analysis modeled the presence of a substantive response to the “having a democratic political system” item among respondents to the 2000 Iran Values Survey using variables for gender, age, and formal education, plus variables for opinion about a political system with a strong leader, opinion about a political system in which experts make decisions, opinion about a political system in which the army rules, and agreement with the statement that democracy may have its problems but it is better than any other political system. Responses for these latter four opinion measures were trichotomized into variables in which +1 indicated a response of good or agreement, −1 indicated a response of bad or disagreement, and 0 indicated a nonsubstantive response. Inverse probability weights ranged from 1.1 to 5.5, with a respective mean and standard deviation of 1.7 and 0.6. This second inverse probability weighting analysis produced a 95% confidence interval of [81, 86] percent true support for a democratic Iran among respondents to the 2000 Iran Values Survey.
Multiple Imputation
In multiple imputation, observed data predict multiple values of a missing value for an observation. The range of variation in predicted values reflects the uncertainty about the value that should be predicted; then, these multiple predicted values are used to generate multiple complete datasets, such that n predicted values produce n complete datasets. These n complete datasets are analyzed, and the results of the analyses are combined with statistical rules.
Our first multiple imputation used gender, age, and education to predict responses to the “having a democratic political system” item among respondents to the 2000 Iran Values Survey who did not provide a response to that item; three responses were predicted for each missing value, to generate three complete datasets.Footnote 7 This first multiple imputation analysis produced a 95% confidence interval of [84, 87] percent true support for a democratic Iran among respondents to the 2000 Iran Values Survey.
Our second multiple imputation used the seven variables from the second inverse probability regression equation to predict responses to the “having a democratic political system” item among respondents to the 2000 Iran Values Survey who did not provide a response to that item; three responses were predicted for each missing value to generate three complete datasets. This second multiple imputation analysis produced a 95% confidence interval of [82, 85] percent true support for a democratic Iran among respondents to the 2000 Iran Values Survey.
The third multiple imputation was based on the aforementioned seven variables, plus variables for confidence in government, a 1-to-10 rating of the current political system for the country, opinion about whether the economic system runs badly in a democracy, opinion about whether democracies are indecisive, opinion about whether democracies are not good at maintaining order, satisfaction with the financial situation of the household, and frequency of attendance at religious services. This third multiple imputation analysis produced a 95% confidence interval of [84, 87] percent true support for a democratic Iran among respondents to the 2000 Iran Values Survey.
Heckman Selection Models
Multiple imputation and inverse probability weighting presume that the probability of a nonsubstantive response is not a function of the response variable. This assumption cannot be tested statistically and is unlikely to hold in the nondemocratic regimes where measurement of support for democracy is critical. In these regimes, nonsubstantive response due to self-censorship might be more likely among persons who prefer replacing the current regime with a democratic regime than among persons who prefer the nondemocratic status quo. This assumption is especially problematic considering that, in our cross-national analysis, the nonsubstantive response rate to democratic support items was inversely related to the level of democracy in a country.
Heckman selection models can account for missing data when the probability of nonsubstantive response is a function of the response variable: observed data predict the probability of providing a substantive response, and a transformation of this probability is included as a control in a regression to predict the dependent variable of interest (Heckman Reference Heckman1976). But if the selection model is not specified correctly, a Heckman model can produce estimates inferior to estimates from models assuming that nonsubstantive response is not a function of the response variable (Enders Reference Enders2010, 296).
Our first Heckman model predicted the presence of a substantive response to the “having a democratic political system” item among respondents to the 2000 Iran Values Survey using the seven variables from the second inverse probability regression equation plus a self-reported interest-in-politics variable. The first seven variables were used as predictors in the outcome equation; the regression was estimated on the 2,344 observations with full data on the model variables, split into 1,554 uncensored observations and 790 censored observations. After the Heckman model was estimated, the Stata 11 margins command computed the predicted probability that a nonsubstantive responder agreed that democracy would be a good way to govern Iran. These predicted probabilities then were used to estimate responses for the 900 nonsubstantive responders. This first Heckman analysis produced a 95% confidence interval of [76, 91] percent true support for a democratic Iran among respondents to the 2000 Iran Values Survey.
Our second Heckman model retained the variables from the first Heckman model and added outcome predictors of financial satisfaction, confidence in the government, confidence in the churches, and frequency of religious service attendance. These variables were also included as predictors in the selection equation, alongside new variables for self-reported importance of politics to the respondent and for the frequency of political discussions with friends. Because data were missing in these additional variables, the regression sample size was reduced to 1,156 uncensored observations and 490 censored observations. This second Heckman analysis produced a 95% confidence interval of [84, 88] percent true support for a democratic Iran among respondents to the 2000 Iran Values Survey.
Summary
Given the diversity of techniques available to estimate censored opinions—and the diversity of assumptions that they require—reports of estimated true support for democracy should reflect multiple methods for handling censored responses to inform readers about the sensitivity of estimates to missing data techniques and assumptions. Estimates of true support for democracy in the 2000 Iran Values Survey provide an example of relative convergence: the 86% estimate of true support for democracy derived from listwise deletion fell close to or within the 95% confidence intervals derived from inverse probability weighting, multiple imputation, and Heckman selection modeling.
IMPROVING THE DESIGN OF DEMOCRATIC SUPPORT ITEMS TO REDUCE NONSUBSTANTIVE RESPONSE
Given the lack of an optimal statistical adjustment for reducing uncertainty caused by nonsubstantive response, expectations about even the most careful posthoc adjustment should be tempered by the multitude of possible reasons for nonsubstantive response to items that measure support for democracy, such as censorship of prodemocracy views considered at odds with the regime party line, censorship of antidemocracy views considered politically or socially undesirable, a general reluctance to express opinions stemming from limited formal education or other characteristics, and a lack of clarity about the actual nature of a democratic system (see Chu and Huang Reference Chu and Huang2010).
Thus, the best way to reduce nonsubstantive response levels might be to modify the items themselves. For example, collapsing the four “having a democratic political system” response options into a dichotomous choice might increase the substantive response rate by decreasing task difficulty; respondents would need to map their opinion onto only a single directional dimension—good or bad—instead of both a directional dimension and an intensity dimension—very good, fairly good, fairly bad, or very bad. In addition, substantive response rates might be increased by offering a neutral option to capture opinions located between good and bad, because lack of a middle option can induce nonresponse (see Krosnick and Presser Reference Krosnick, Presser, Marsden and Wright2010, 271, 274). Neutrality or ambivalence about democracy should be captured because it is a legitimate attitude, especially among respondents in countries who lack democratic experience. For example, 77% of respondents to the 2000 Iran Values Survey who indicated that democracy would be a good way to govern Iran also endorsed military rule as a good way to govern Iran.
IMPLICATIONS FOR THE STATUS OF GLOBAL SUPPORT FOR DEMOCRACY
Because support for democracy might be a prerequisite for democratization, proper handling of nonsubstantive responses to democratic support items can have implications for democracy promotion efforts that rely on public opinion surveys. Including nonsubstantive responses in calculations of support for democracy did not alter the finding of high levels of support for democracy across geographic region, cultural orientation, and regime type. In 75 of the 76 countries shown in figure 2, a majority of respondents indicated that democracy would be a good way to govern their country. Moreover, at least for the 2000 Iran Values Survey, point estimates of the level of true support for democracy that excluded nonsubstantive responses were similar to point estimates derived from more sophisticated missing data techniques.
But excluding nonsubstantive responses altered inferences about the effect of formal education on support for democracy in Iran and revised downward estimates of expressed support for democracy in countries with high nonsubstantive response rates. Thus, democracy receives widespread support as a desirable political system in many nondemocratic countries, but that support is not as monolithic or as strong as some reports have indicated, which should temper optimism about the receptivity of these populations to democratization.