Anthropogenic pressure on deep-sea habitats is growing, through fisheries and, specifically, through bottom trawling (Rooper et al. Reference Rooper, Wilkins, Rose and Coon2011; Norse et al. Reference Norse, Brooke, Cheung, Clark, Ekeland, Froese, Gjerde, Haedrich, Heppell, Morato, Morgan, Pauly, Sumaila and Watson2012; Puig et al. Reference Puig, Canals, Company, Martín, Amblas, Lastras, Palanques and Calafat2012), climate change, including rising deep ocean temperatures (Balmaseda et al. Reference Balmaseda, Trenberth and Källén2013) and ocean acidification (Form & Riebesell Reference Form and Riebesell2011), and more recently, deep-sea mining (Colman Collins et al. Reference Colman Collins, Kennedy, Copley, Boschen, Fleming, Forde, Ju, Lindsay, Marsh, Nye, Patterson, Watanabe, Yamamoto, Carlsson and Thaler2013). Globally, there is increasing awareness of the need to develop and implement biodiversity conservation policy, to ensure appropriate and sustainable management of these ecosystems (Ban et al. Reference Ban, Ban, Bax, Gjerde, Devillers, Dunn, Dunstan, Hobday, Maxwell, Kaplan, Pressey, Ardron, Game and Halpin2013).
From an international perspective, the United Nations General Assembly resolution 61/105 (UN General Assembly 2003) requires the protection of vulnerable marine ecosystems (VMEs) from damaging fishing practices. From a regional perspective, Annex V of the OSPAR Convention (‘On the Protection and Conservation of the Ecosystems and Biological Diversity of the Maritime Area’) provides a list of Threatened and/or Declining Species and Habitats again for which conservation measures are required (OSPAR 2008). At a European level, the Marine Strategy Framework Directive (MSFD) requires an initial assessment of the current environmental status of European Union members' marine waters. Effective implementation of these policies requires a sound understanding of the extent and distribution of benthic biological assemblages as a starting point.
Maps have proved to be a useful method of summarising biological information concerning the seabed. There is now momentum towards the generalised mapping of the seafloor to provide information on which effective conservation policy can be based (Dolan et al. Reference Dolan, Grehan, Guinan and Brown2008; McBreen et al. Reference McBreen, Askew, Cameron, Connor, Ellwood and Carter2011; Kenchington & Hutchings Reference Kenchington and Hutchings2012). However, large-scale mapping programmes have tended to focus on mapping the physical environment. While a vital first step, these physical maps provide only a coarse-level representation of the biology that is the subject of conservation efforts (Ward et al. Reference Ward, Vanderklift, Nicholls and Kenchington1999; Stevens & Connolly Reference Stevens and Connolly2004; Williams et al. Reference Williams, Bax, Kloser, Althaus, Barker and Keith2009). They do not provide the comprehensive understanding of the extent and distribution of biological assemblages required by managers in order to make assessments on the potential impact of human use and decisions on appropriate management measures. As a result, and where data are available, maps of biological assemblages, often referred to as biotopes, are desirable.
Mapping at the level of biotopes or assemblages is a major problem in the deep sea, where sampling is expensive and logistically challenging, due to the deep sea's remoteness and depth, and the relatively poor ecological knowledge of the residing fauna. Recently, the use of species distribution modelling (SDM) has been applied to assemblages to map the distribution of deep-sea fauna over large areas (Howell et al. Reference Howell, Holt, Endrino and Stewart2011; Rengstorf et al. Reference Rengstorf, Yesson, Brown and Grehan2013; Ross & Howell Reference Ross and Howell2013). In addition, smaller-scale site-based mapping of multiple assemblages has also applied predictive modelling techniques (Gonzalez-Mirelis & Lindegarth Reference Gonzalez-Mirelis and Lindegarth2012). Predictive modelling is a promising tool in this area, potentially reducing the cost of comprehensive field surveys by allowing the targeting of important areas, and filling data gaps for large areas of un-sampled seabed (Elith & Leathwick Reference Elith and Leathwick2009; Galparoso et al. Reference Galparsoro, Borja, Bald, Liria and Chust2009; Dambach & Rodder Reference Dambach and Rodder2011; Robinson et al. Reference Robinson, Elith, Hobday, Pearson, Kendall, Possingham and Richardson2011).
Many different modelling methods are now available. Each has its strengths and weaknesses and the model has to be chosen carefully, considering the nature of the data available and the question or hypothesis under consideration. In practice, implementation difficulties, time consumption, output format or personal knowledge of its functioning also play a part in the choice of method. Elith & Graham (Reference Elith and Graham2009) evaluated the most popular methods and stated that guidance in choosing an appropriate modelling method was incomplete and scattered across scientific literature, making objective choice difficult. There is evidence to suggest that the choice of modelling method may have a significant effect on both model performance and spatial prediction (Elith et al. Reference Elith, Graham, Anderson, Dudík, Ferrier, Guisan, Hijmans, Huettmann, Leathwick, Lehmann, Li, Lohmann, Loiselle, Manion, Moritz, Nakamura, Nakazawa, Overton, Peterson, Phillips, Richardson, Scachetti-Pereira, Schapire, Soberón, Williams, Wisz and Zimmermann2006; Elith & Leathwick Reference Elith and Leathwick2009; Reiss et al. Reference Reiss, Cunze, Konig, Neumann and Kroncke2011; Downie et al. Reference Downie, von Numers and Bostrom2013). If maps produced using predictive modelling are to become established in the tool box of marine environmental managers, it is vital that the implications of model selection on model performance and, ultimately, spatial prediction are more widely understood.
This study focuses on creating three different high-resolution model maps for three benthic biological assemblages (biotopes) on the northeastern flank of Rockall Bank: the Lophelia pertusa (Linnaeus, Reference Linnaeus1758) reef (LpReef); the xenophyophore Syringammina fragilissima (Brady, Reference Brady1883) aggregations (XeFi); and an assemblage characterised by dense aggregations of stylasterids and lobose sponges found on bedrock and mixed substrates (described by Long et al. Reference Long, Kerry, Davies and Stewart2010) (StyLSp). Each offers habitat complexity, enhancing three-dimensional (3D) structure and known to increase associated diversity (Buhl-Mortensen et al. Reference Buhl-Mortensen, Vanreusel, Gooday, Levin, Priede, Buhl-Mortensen, Gheerardyn, King and Raes2010).
Lophelia pertusa is the dominant reef-building cold-water coral in the NE Atlantic, with the ability to form expansive reefs and carbonate mounds up to 300 m high. The framework formed by its skeleton increases habitat complexity, offering shelter for a highly diverse fauna (Roberts et al. Reference Roberts, Wheeler and Freiwald2006). Although the species may also be found as isolated colonies attached to patches of hard substrate (Wilson Reference Wilson1979; Mortensen & Buhl-Mortensen Reference Mortensen and Buhl-Mortensen2004, Reference Mortensen, Buhl-Mortensen, Freiwald and Roberts2005; Hovland Reference Hovland, Freiwald and Roberts2005), the distribution of reefs is restricted to a much narrower set of environmental conditions (Howell et al. Reference Howell, Holt, Endrino and Stewart2011). Here, we have focused on the reef habitat, which has an ecologically more important role in the deep sea.
Xenophyophore fields are found exclusively in the deep sea. Xenophyophores are single-celled organisms, up to 25 cm in diameter. Syringammina fragilissima is one of the largest and most commonly observed species in the NE Atlantic, forming aggregations of up to 7–10 individuals per m2 (Tendal Reference Tendal1972, Reference Tendal1996; Gooday & Tendal Reference Gooday, Tendal, Lee, Leedale and Bradbury2000; Roberts et al. Reference Roberts, Harvey, Lamont, Gage and Humphery2000; Bett Reference Bett2001). Sediments adjacent to large xenophyophore tests have been found to contain significantly more metazoan macrofauna than surrounding sediments (Levin et al. Reference Levin, DeMaster, McCann and Thomas1986; Levin & Thomas Reference Levin and Thomas1988), and the tests themselves can provide microhabitats for small meiofaunal-sized metazoans (Gooday Reference Gooday1984) and foraminifera (Gooday & Haynes Reference Gooday and Haynes1983; Gooday Reference Gooday1991; Shires et al. Reference Shires, Gooday and Jones1994). Levin (Reference Levin1991, Reference Levin1994) also suggests that xenophyophore tests may provide a structural habitat for epifauna.
The stylasterids and lobose sponges assemblage is described by Long et al. (Reference Long, Kerry, Davies and Stewart2010) as characterised by saddle oysters, brachiopods, Munida, serpulids, stylasterid corals, Cidaris cidaris (Linnaeus, Reference Linnaeus1758) and lobose sponges. This biotope has been described from Rockall Bank as associated with mixed substrate (a combination of different substrates types), boulders and bedrock, at temperatures of 9.2–9.7°C and at depths of 387–685 m. This assemblage fits the description of a VME, facing the same threats, and therefore is considered as such in this study.
All three habitats qualify as VMEs, whilst LpReef is also classed as a ‘threatened and/or declining species and habitat’ under the OSPAR Convention. The 3-D structure is fragile and can be broken by any physical actions, such as trawling, or weakened by poor calcification conditions, such as are occurring with increasing ocean acidification (Form & Riebesell Reference Form and Riebesell2012). Additionally, the very slow growth rate of most of the species forming such 3-D habitats makes their recovery rate very slow (Althaus et al. Reference Althaus, Williams, Schlacher, Kloser, Green, Barker, Bax, Brodie and Schlacher-Hoenlinger2009; Williams et al. Reference Williams, Schlacher, Rowden, Althaus, Clark, Bowden, Stewart, Bax, Consalvey and Kloser2010; Rooper et al. Reference Rooper, Wilkins, Rose and Coon2011). A better understanding of their distribution is critical to successful spatial management of these important habitats. The aim of this study was to investigate how consistently the distribution of habitats is described by the three different modelling approaches, with increasing ease of use: (i) prediction of the probability of presence, converted to an estimate of presence and absence using a probability threshold, applying Maximum Entropy modelling (MaxEnt, Phillips et al. Reference Phillips, Anderson and Schapire2006) separately for each habitat; (ii) prediction of presence or absence by Random Forest classification (Breiman Reference Breiman2001) separately for each habitat; and (iii) prediction of the most likely habitat by RandomForest. The impact of model choice on the predicted distribution of benthic assemblages was assessed using three VMEs as a case study, to highlight the implications of model plasticity for habitat mapping and environmental management.
1. Method
1.1. Site description
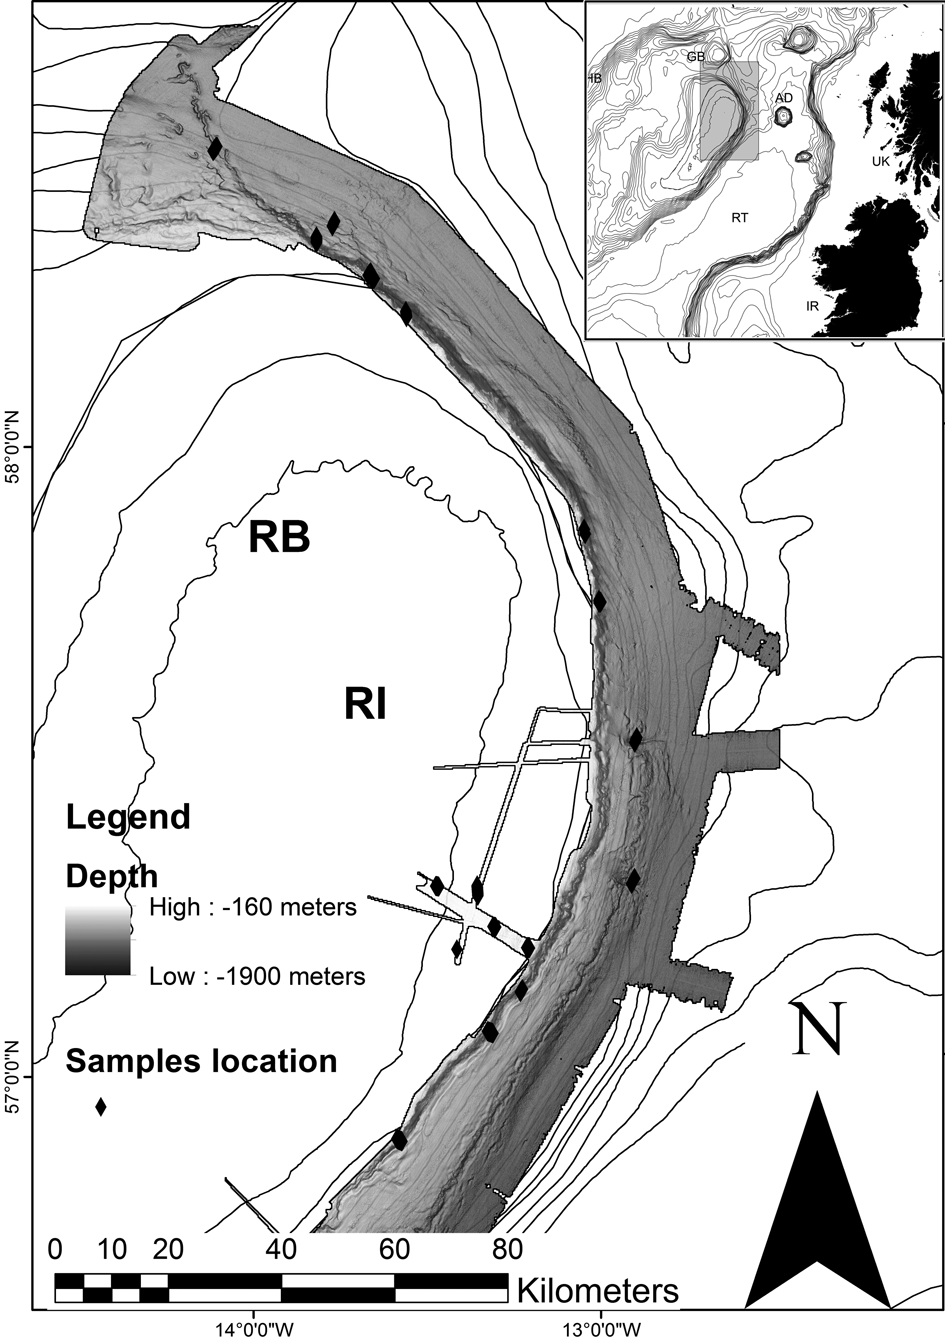
Rockall Bank is situated in the NE Atlantic Ocean, 40 km west of the UK mainland. It forms part of the larger Rockall Plateau, comprising Hatton Bank, Rockall Bank, George Bligh Bank and the intervening Hatton Basin (Fig. 1). The Rockall Bank itself is approximately 450 km long, running NE–SW, and 150 km wide at its widest point between the 1000 m-depth contours. It ranges in depth from 0 m to ∼1500 m. This study is focused on the eastern and northeastern flanks of the bank that fall away very steeply from 250 m, descending into the Rockall Trough at 1000–1900 m depth.
Full extent of the area covered by MBES survey. Black diamonds mark locations of video transects. Location abbreviations: AD=Anton Dohrn; GB=George Bligh Bank; HB=Hatton Bank; RB=Rockall Bank; RI=Rockall Island; RT=Rockall Trough. Bathymetry outside the study area is GEBCO and is displayed as 100 m isobaths to 2000 m depth, then at 500-m intervals. Map is projected in WGS 1984.

1.2. Survey
The study area was surveyed during research cruises in 2005, 2009 and 2011 (Stewart et al. Reference Stewart, Davies, Long, Strömberg and Hitchen2009; Jacobs et al. Reference Jacobs2006; Long et al. Reference Long, Kerry, Davies and Stewart2010; Huvenne Reference Huvenne2011). High-resolution multibeam echosounder data were acquired in 2005 on S/V Kommander Jack, using an EM120 system (12 kHz; 191 beams); and in 2009 on M/V Franklin, using an EM710 system (70–100 kHz; 400 beams). Sound velocity measurements were performed at regular intervals to account for hydrology effects during all three surveys. Multibeam echosounder data were processed on board ship and onshore by OSAE Ltd. in 2005 and by Marin Mätteknik AB in 2009. Data were gridded at resolutions appropriate to the quality of the data (2005: 25 m grids; 2009: 20 m grids (East Rockall area C1 A–D), with all other survey areas gridded at 15 m). Minimum water depths encountered within the study area were 160 m; maximum water depths were 1900 m (Fig. 1). As the modelling methods require all environmental data to have the same geographic bounds and cell size, all multibeam echo sounder datasets were regridded in ArcGIS to 25 m and merged to produce a single data layer, which was then used to produce subsequent derived layers.
A total of 19 transects, from 500 m to 1500 m long, were undertaken along the northern and eastern flanks of Rockall Bank to acquire video/still images. Seventeen transects were completed in 2009 using a drop frame camera system; two were achieved in 2011 using an ROV. Detailed technical specifications of the survey and camera systems are available in the source literature.
1.3. Biotope data
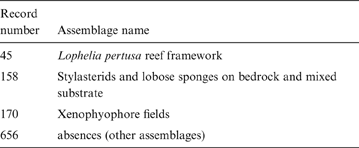
Fifteen distinct benthic assemblages were identified at the site as part of a separate study. Three of these assemblages are VMEs and were selected as the focus of this study. A total of 1029 records (the presence of an assemblage in a grid cell) were included in the biotope dataset (Table 1). At each sample location, the assemblage observed was assigned to one of the fifteen specified assemblages. A presence–absence dataset was extracted for each VME by assigning the observations of other assemblages as absences. Sample data were reduced to one data point per cell of topographic data. Cells where both presence and absence were recorded were assigned a presence.
Number of presences of each of the 15 assemblages described on Rockall Bank

1.4. Predictor variables
Some of the factors that are suggested to influence strongly the distribution of deep-sea species include temperature and pressure (Tyler & Young Reference Tyler and Young1998), substrate (Howell et al. Reference Howell, Davies and Narayanaswamy2010), food supply (Ruhl & Smith Reference Ruhl and Smith2004), water mass structure (Miller et al. Reference Miller, Rowden, Williams and Häussermann2011), current speed and direction (Rice et al. Reference Rice, Thurston and New1990; White et al. Reference White, Mohn, de Stigter, Mottram, Friewald and Roberts2005) and oxygen concentration (Rogers Reference Rogers2000). High-resolution data layers for these variables are not available for most of the deep sea, and where data layers are available they are usually derived from models subject to error. Multibeam bathymetry, on the other hand, provides true full-coverage, high-resolution data on seabed topography. It is relatively inexpensive to collect and a number of national mapping programmes are currently underway (MAREMAP (UK); MAREANO (Norway); Deep-Sea Coral Research and Technology Program (USA.); MESH-Atlantic (international)), thereby providing a vast dataset. Bathymetry and topographical variables derived from it, such as slope and rugosity, provide proxies for many other deep-sea variables, including temperature (where biogeography is taken into account), current speed, water mass structure, food availability and sediment type (Howell et al. Reference Howell, Billett and Tyler2002; Howell Reference Howell2010).
Eight topographic predictor variables were included in this study, based on their expected significance as proxies for environmental factors that drive species distributions in the deep sea; namely, bathymetry, slope, rugosity, plan curvature (plan), profile curvature (prof), combined curvature (plan and profile combined (curv)), and bathymetric position index (BPI). Slope provides terrain gradient in degrees and serves as a proxy for the local hydrodynamic regime (Guinan et al. Reference Guinan, Grehan, Dolan and Brown2009). Rugosity acts as a measure of terrain ‘roughness’, or structural complexity, and also serves as a surrogate for substrate type (Rinehart et al. Reference Rinehart, Wright, Lundblad, Larkin, Murphy and Cary-Kothera2004; Dunn & Halpin Reference Dunn and Halpin2009). Profile curvature measures convexity/concavity of the terrain perpendicular to the direction of the maximum slope, whilst plan curvature is the convexity/concavity of the terrain parallel to the direction of the maximum slope and combined curvature regroups the two dimensions in the same index (Holmes et al. Reference Holmes, Van Niel, Radford, Kendrick and Grove2008). Along with slope, curvature also serves as a proxy for local-scale hydrology. Profile curvature affects the acceleration and deceleration of flow and, therefore, influences erosion and deposition; whilst plan curvature influences convergence and divergence of flow. BPI (equivalent to topographic position index) uses neighbourhood analysis to calculate the relative elevation of a cell, identifying topographic features such as ridges (positive BPI), valleys (negative BPI) and flat areas/constant slope (0) (Wright et al. Reference Wright, Lundblad, Larkin, Rinehart, Murphy, Cary-Kothera and Draganov2005). BPI can be a proxy of various environmental features, such as exposure to current, current speed and orientation or sedimentation.
All topographic variables were derived from the 25 m bathymetry grid. In order to capture any possible scale-dependent relationships between predictor variable and habitat, all derived layers were calculated at 25 m, 100 m and 200 m raster cell size.
Slope (calculated as the maximum change in elevation over the distance between a cell and its eight neighbours), plan curvature, profile curvature and combined curvature were all calculated using the spatial analyst toolbox in ArcGIS 10.0, derived from a neighbourhood analysis.
Rugosity (calculated as the ratio of 3-D surface area to planar area) and BPIs were calculated using the Benthic Terrain Modeller extension (Wright et al. Reference Wright, Lundblad, Larkin, Rinehart, Murphy, Cary-Kothera and Draganov2005). BPI was generated at fine (BPIfine) and broad (BPIbroad) scales, to provide separate layers defining small macrohabitats (sensu Greene et al. Reference Greene, Yoklavich, Starr, O'Connell, Wakefield, Sillivan, McRea and Cailliet1999) such as mounds, and large macrohabitats (sensu Greene et al. Reference Greene, Yoklavich, Starr, O'Connell, Wakefield, Sillivan, McRea and Cailliet1999) such as bank flank. BPIfine was generated with an inner radius of one cell and an outer radius of three cells (corresponding to scale factors of 75 m, 300 m and 600 m, for the 25 m, 100 m and 200 m rasters, respectively); and BPIbroad was generated with an inner radius of one cell and an outer radius of five cells (scale factors of 125 m, 500 m, and 1000 m).
1.5. Modelling approaches
We selected two popular modelling methods, MaxEnt and RandomForest. These two methods are widely used for SDM, which makes their comparison valuable for future choices of methods in habitat mapping. Both methods have the advantage of being easily implemented, with a good capacity to cope with correlated variables (Cutler et al. Reference Cutler, Edwards, Beard, Cutler, Hess, Gibson and Lawler2007; Elith & Graham (Reference Elith and Graham2009). RandomForest (RF) is a machine learning method by which a large number of classification or regression trees are built, and responses are predicted based on averages (regression) or by majority rules (classification) from all trees (Breiman Reference Breiman2001; Cutler et al. Reference Cutler, Edwards, Beard, Cutler, Hess, Gibson and Lawler2007). It has been widely used in ecological modelling (Elith et al. Reference Elith, Graham, Anderson, Dudík, Ferrier, Guisan, Hijmans, Huettmann, Leathwick, Lehmann, Li, Lohmann, Loiselle, Manion, Moritz, Nakamura, Nakazawa, Overton, Peterson, Phillips, Richardson, Scachetti-Pereira, Schapire, Soberón, Williams, Wisz and Zimmermann2006; Elith & Graham Reference Elith and Graham2009; Hasan et al. Reference Hasan, Ierodiaconou and Monk2012), possibly as a result of its ease of use (only two parameters to settle in the most commonly used RF implementation in R – the number of variables in the random subset at each node and the number of trees in the forest); its robustness to the inclusion of correlated variables (because only a subset of predictors is used to build each individual tree); and its flexibility of application to either discriminate between multiple categories or calculate the probability of occurrence of a single species or assemblage. RandomForest has the advantage of being able to produce one map from a single classification analysis. This results in a significant time saving during analysis. However, when used in this manner, its weakness is that the model is forced to assign each cell to only one biotope. This fails to reflect the potential occurrence of multiple assemblages in a cell, and also does not allow cells to remain unassigned representing potentially novel assemblages. We used RF in two ways, both based on the classification approach. A single classification model, referred to as the global RandomForest (gRF), was trained with input data consisting of samples classified into one of the 15 assemblages identified from the study site. The gRF model was used to predict to the whole study area, producing a single map where each raster cell is classified into the most probable of the fifteen assemblages. In the second approach, referred to as the single-assemblage RandomForest (saRF), a separate presence–absence classification model was built for each of the three VMEs. These models were used to predict the presence (as class) of each VME individually, resulting in three separate map products. RF models were fitted with the ‘RandomForest’ package version 4.6–7 in R (Liaw & Wiener Reference Liaw and Wiener2002). All models were run using the default values of random sample (mtry) of the predictors (p1/2, where p is the total number of predictors), with 1000 trees grown for each model.
MaxEnt modelling is a modelling technique developed by Phillips et al. (Reference Phillips, Anderson and Schapire2006), Phillips & Dudík (Reference Phillips and Dudík2008) and Elith et al. (Reference Elith, Phillips, Hastie, Dudík, Chee and Yates2011). It was chosen for this study because it has been found to be amongst the highest-performing modelling techniques for presence-only modelling (Elith et al. Reference Elith, Graham, Anderson, Dudík, Ferrier, Guisan, Hijmans, Huettmann, Leathwick, Lehmann, Li, Lohmann, Loiselle, Manion, Moritz, Nakamura, Nakazawa, Overton, Peterson, Phillips, Richardson, Scachetti-Pereira, Schapire, Soberón, Williams, Wisz and Zimmermann2006). MaxEnt works with presence-only data (when the coordinates of observed presences only are available; i.e., it does not use absence data). It is only able to predict the distribution of one response variable (biotope) at once, and thus requires a model/map to be produced for each assemblage separately, resulting in significantly more analysis time. However, it has the advantage of allowing cells to contain multiple assemblages and remain unassigned. MaxEnt was used to construct probability of presence models for each of the three VMEs, resulting in the production of three individual map products, as with saRF. MaxEnt was run using the samples-with-data (SWD) approach, fitted on the presence records of each VME with background points composed of all the sampled locations. This method of ‘target-group’ background sampling controls for sample bias and improves predictive performance (Phillips & Dudík Reference Phillips and Dudík2008). Each model was fitted in R with the ‘dismo’ package version 0.8–11 (Hijmans et al. Reference Hijmans, Phillips, Leathwick, Elith and Hijmans2013) and the MaxEnt Java program version 3.3.3k (Phillips & Dudík Reference Phillips and Dudík2008). Regularisation settings were adjusted to reduce overfitting (Phillips & Dudík Reference Phillips and Dudík2008), resulting in a regularisation parameter of 2 for LpReef and 3 for XeFi and StylSp models. Each model was then projected onto the study area environmental layers, producing a logistic probability map with values between 0 (low probability) and 1 (high probability) for each VME. One master model was created for each listed habitat.
All models were built in R (R Development Core Team 2011). Elith & Leathwick (Reference Elith and Leathwick2009) highlighted the importance of some expert pre-selection of variables to ensure relevance; however, Elith et al. (Reference Elith, Phillips, Hastie, Dudík, Chee and Yates2011) warn that stricter pre-selection is unlikely to improve the model. Therefore, no predictor variable pre-selection was undertaken and all models were constructed using the same set of predictor variables.
1.6. Model evaluation
Model performance was evaluated through cross-validation, by running each model on 100 randomly-generated splits into 75 % training and 25 % test data. Predictions of presence and absence on the test set from each run were extracted and average values for percentage of correctly classified (PCC), sensitivity and specificity were calculated over the 100 evaluations (Fielding & Bell Reference Fielding and Bell1997; Manel et al. Reference Manel, Dias, Buckton and Ormerod1999). In the gRF predictions, the presence of any assemblage other than the one being evaluated was considered as an absence. The probability of presence output by MaxEnt was converted into binary presence–absence, applying the minimum receiver operating characteristic (ROC) curve distance optimal threshold (Liu et al. Reference Liu, Berry, Dawson and Pearson2005). Each model was assessed using the ‘presence/absence’ model evaluation library (Freeman Reference Freeman2007) in R.
1.7. Variable importance evaluation
MaxEnt and RF use different methods to weight the variables' relative importance in their predictions. Thus, the results of variable importance are not directly comparable across modelling methods. However, all three approaches rank the predictors according to their importance in determining assemblage distribution. This relative importance can be compared.
1.8. Comparison of predicted distributions
Predictions from full models for each of the three VMEs from MaxEnt and saRF, and the full model output from gRF, were transferred to ArcGIS as raster grids. The spatial predictions of each modelling method were compared by calculating the extent (m2) and distribution of each VME within the study area, as predicted by each of the models. Extent was derived from the number of cells in the raster grid where the assemblage was present, given a grid cell is 25×25 m (625 m2).
2. Results
2.1. Model evaluation
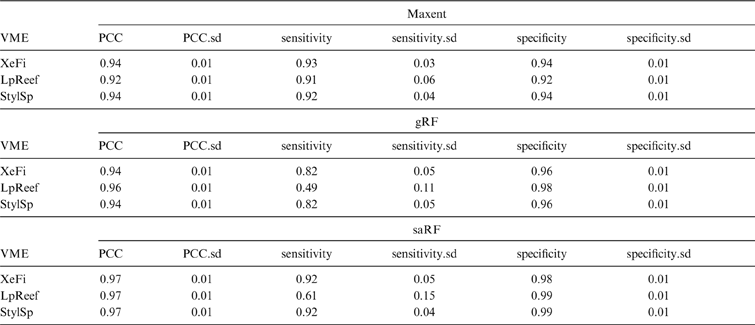
All models are considered valid, with MaxEnt being the best in terms of performance. For the three VMEs, all models achieved high PCC and specificity (all above 0.92), with fairly low standard deviation (<0.013) (Table 2). Similarity of PCC and specificity can be explained by the fact that the prevalence of presence data is low (Table 1), and so the PCC reflects mostly the ability of the model to predict absence, just as specificity does. All MaxEnt models had an excellent sensitivity (above 0.9). RF models for XeFi and StylSp had a good sensitivity (>0.818 for gRF and >0.916 for saRF), but sensitivity for LpReef in both RF models was lower than for MaxEnt (0.49 in gRF; 0.61 in saRF), with higher standard deviation (0.11 and 0.15). The poorer performance of the RF models for LpReef can be explained by the lower number of presence records (Table 1).
Average and standard deviation of performance matrices (over 100 model runs) of each modelling method for the three VMEs (XeFi=xenophyophores fields; LpReef=Lophelia Pertusa reef framework; StylSp=Stylasterids and globose sponges on mixed substrate). PCC=percentage correctly classified; .sd=standard deviation.

2.2. Predictor variable importance
All models predicted a distribution of the different assemblages driven mainly by depth, slope (100 m and 200 m cell size) and rugosity (200 m cell size). Exceptionally, saRF for LpReef found that BPIbroad and BPIfine (200 m cell size) were the most important, followed by depth.
2.3. VME distribution
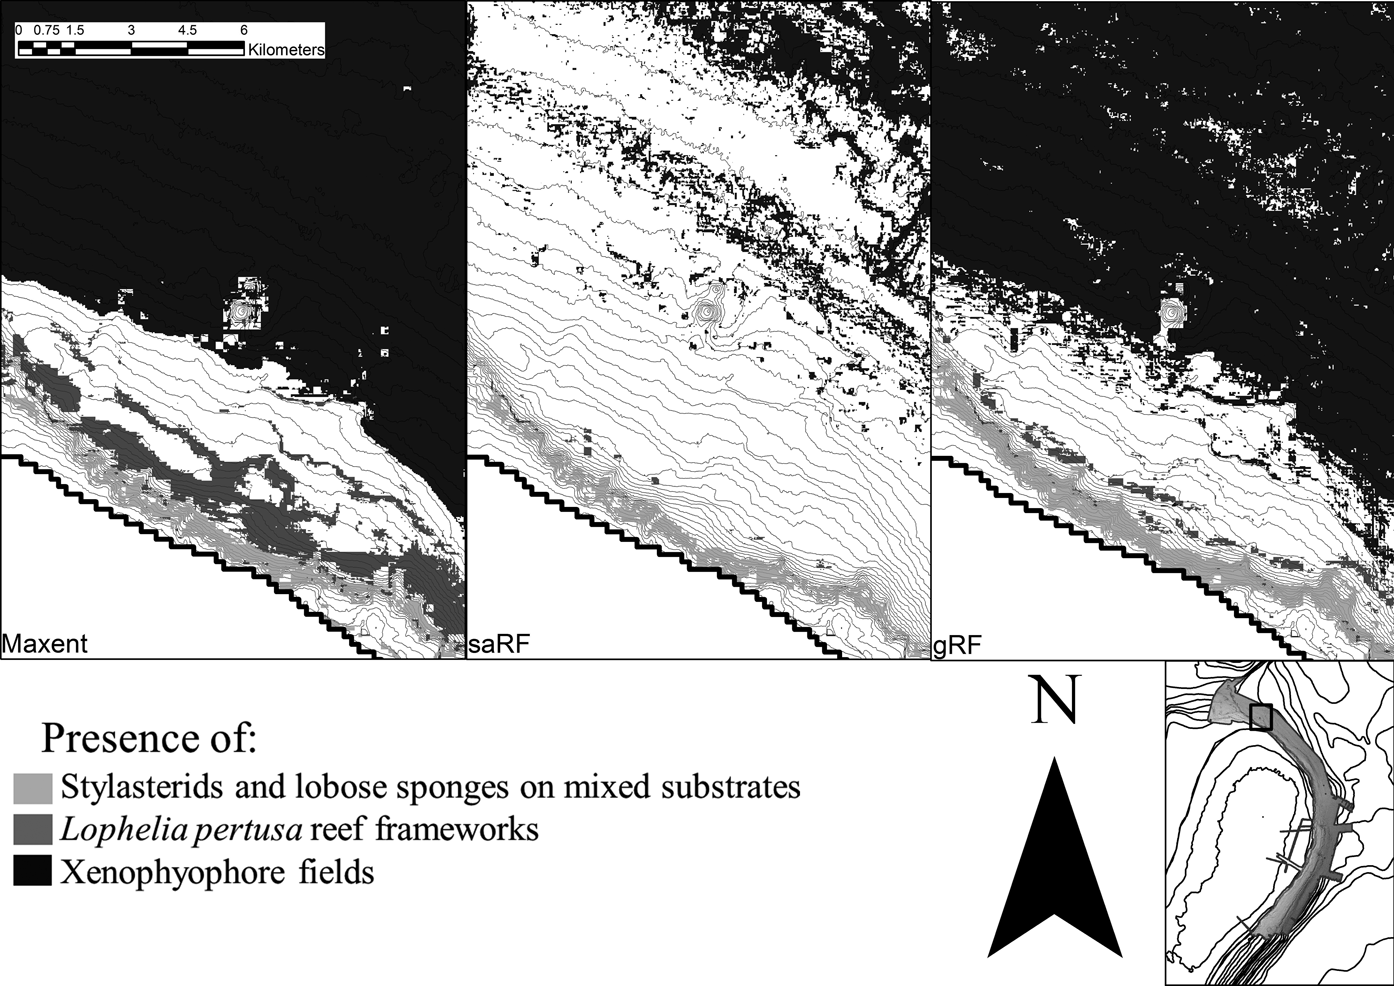
There is little overlap in the predicted distribution of these three assemblages. XeFi occupied the deepest part of the study area at the base of the slope (deeper than 1000 m) (Fig. 2). LpReef is predicted to be found between 600 m and 1000 m depth on the flank, and associated with raised topographic features. StylSp is predicted to occupy the upper part of the flank (between 300 m and 800 m, but small patches may be found as deep as 1200 m).
Distribution of the three Vulnerable Marine Ecosystems (XeFi=Xenophyophores fields; LpReef = Lophelia Pertusa reef framework; StylSp=stylasterids and globose sponges on mixed substrate) in subset of the survey area predicted by (from left to right) MaxEnt models, single assemblage RandomForest (saRF) models and global RandomForest models (gRF). Inset shows location of this survey area subset on Figure 1.

2.4. Comparison of predicted distributions
For all VMEs, MaxEnt models predict a larger extent than both RF models, but predicted extents for the global RF model and MaxEnt are more similar than those predicted from the saRF models (Table 3). In general, the saRF models predict more restricted distributions for all VMEs (Fig. 2).
Extent of all three VMEs as predicted by the three modelling approaches (XeFi=Xenophyophores fields; LpReef=Lophelia Pertusa reef framework; StylSp=Stylasterids and globose sponges on mixed substrate).

All models predict XeFi to have the greatest extent. The gRF and MaxEnt models both predict large parts of the deepest portion of the survey area to be suitable for XeFi, whereas the saRF predicts a patchy distribution only in the deepest parts of the study area.
MaxEnt predicts a greater extent of LpReef than StylSp, whereas both RF models predict the opposite (Table 3). The most striking difference in predictions of extent between models occurs for LpReef, where the MaxEnt predicted extent is 154 times larger than the saRF predictions. MaxEnt predicts the presence of LpReef in a wide band along the slope. The gRF model predicts a similar but more restricted distribution for LpReef, whereas the saRF model predicts LpReef to have a very patchy distribution in only the shallowest areas predicted by the other two models.
For StylSp, gRF predicts a slightly deeper distribution than the other two models, their presence extending on top of the crests, and MaxEnt predicts a distribution which extends onto shallower areas on the top of the slope.
3. Discussion
In this study, we have shown that the distributions of VMEs can be successfully modelled and the predicted distributions concur with what is previously known about their ecology and distribution. Although all of the modelling methods performed well in cross-validation, the selection of method was found to have a considerable effect on the extent of the predicted distribution. The discrepancy between model predictions has implications on their use in management applications, and care should be taken to validate models adequately and establish their spatial error margins.
3.1. Model performance
All three methods were successful at predicting the extent and distribution of the three targeted VMEs on northeast Rockall Bank. However, in comparison, the MaxEnt models performed best for all three VMEs, a finding consistent with previous model comparisons that found MaxEnt was the most efficient method for SDM (Elith et al. Reference Elith, Graham, Anderson, Dudík, Ferrier, Guisan, Hijmans, Huettmann, Leathwick, Lehmann, Li, Lohmann, Loiselle, Manion, Moritz, Nakamura, Nakazawa, Overton, Peterson, Phillips, Richardson, Scachetti-Pereira, Schapire, Soberón, Williams, Wisz and Zimmermann2006; Elith & Graham Reference Elith and Graham2009; Reiss et al. Reference Reiss, Cunze, Konig, Neumann and Kroncke2011). The better overall performance of MaxEnt in this study is most likely a result of the low prevalence in the dataset, and the questionable reliability of absence data. The limited number of presence records (only 45 presence records for LpReef) is probably responsible for the lower performance of RF models to predict this VME, as MaxEnt is known to deal better with small numbers of presence records (Wisz et al. Reference Wisz, Hijmans, Li, Peterson, Graham and Guisan2008). The quality and reliability of absence data have been proved to be influential on the model performances (Smith et al. Reference Smith, Santos, Koo, Rowe, Rowe, Patton, Beissinger and Moritz2013). These authors emphasised that high-quality absence data were needed to assess SDMs quality, but also recognised that these data were generally difficult, if not impossible, to acquire. This statement is particularly true in the deep sea, given the significant investment in time and money required to collect a dataset.
3.2. Predicted distribution of the VMEs across the northeast Rockall Bank
All three models agree to structure the distribution of the three VMEs on Rockall Bank in depth bands, with each one occupying a specific region on the flank of Rockall Bank. The areas where our models predict the presence of the three VMEs are consistent with current understanding of the distribution of these habitats.
Xenophyophore fields have been observed at depths of 860–1830 m, although most records are from around 1000 m water depth (Hughes & Gooday Reference Hughes and Gooday2004). They are found on sandy silts and fine grained oozes; often in areas with enhanced organic carbon fluxes, such as beneath highly-productive surface waters, on sloped topography or near topographic features such as caldera walls, basalt outcrops, or on the sides of sediment mounds and small ridges (Tendal Reference Tendal1972, Reference Tendal1979; Levin & Thomas Reference Levin and Thomas1988; Levin & Gooday Reference Levin, Gooday, Rowe and Pariente1992; Hughes & Gooday Reference Hughes and Gooday2004). In this present study, XeFi was found below 1000 m water depth at the base of the flank of Rockall Bank, suggesting a potential association with the bank structure, likely to be a result of favourable oceanographic conditions associated with mixing or deflection caused by the bank structure. Xenophyophore aggregations have also been observed associated with the base of the neighbouring Anton Dohrn Seamount (Davies Reference Davies2012) and the Darwin Mounds area of the continental slope (Bett et al. Reference Bett, Billett, Masson and Tyler2001). Ross & Howell's (Reference Ross and Howell2013) recent broad-scale model suggested Xenophyophore aggregations may be common to the base of many raised topographic features in the region, including the continental slope. The lower limit of the predicted distribution for Xenophyopores in this study has a high uncertainty associated with it, due to limited sampling in the deepest part of Rockall Bank, meaning the data are not fully representative of the entire niche occupied by this assemblage.
Lophelia pertusa reefs form under a specific set of environmental conditions. The largest reefs are known to occur in depths of 500–1200 m, at temperatures of 4–12°C (Frederiksen et al. Reference Frederiksen, Jensen and Westerberg1992; Roberts et al. Reference Roberts, Wheeler and Freiwald2006; Wheeler et al. Reference Wheeler, Beyer, Freiwald, de Haas, Huvenne, Kozachenko, Olu-Le Roy and Opderbecke2007). Factors driving reef formation are poorly understood, but are likely to be an interplay between local hydrography and sedimentary dynamics (Thiem et al. Reference Thiem, Ravagnan, Fossa and Berntsen2006; Howell et al. Reference Howell, Holt, Endrino and Stewart2011), with most reefs being found on topographic highs and slopes (Strømgren Reference Strømgren1971; Genin et al. Reference Genin, Dayton, Lonsdale and Spiess1986; Frederiksen et al. Reference Frederiksen, Jensen and Westerberg1992; Davies et al. Reference Davies, Wisshak, Orr and Roberts2008), associated with features such as ridges (Sula Ridge), escarpments (Pelagia Mounds, Hatton Bank) and channels (Hovland Mounds) (Wheeler et al. Reference Wheeler, Beyer, Freiwald, de Haas, Huvenne, Kozachenko, Olu-Le Roy and Opderbecke2007, Howell et al. Reference Howell, Holt, Endrino and Stewart2011), and in areas of strong currents and high productivity (Mortensen et al. Reference Mortensen, Hovland, Fossa and Furevik2001; White et al. Reference White, Mohn, de Stigter, Mottram, Friewald and Roberts2005; Thiem et al. Reference Thiem, Ravagnan, Fossa and Berntsen2006; Kiriakoulakis et al. Reference Kiriakoulakis, Freiwald, Fisher and Wolff2007; Davies et al. Reference Davies, Wisshak, Orr and Roberts2008). In this present study, MaxEnt and gRF both predict a patchy, but more or less continuous, band of LpReef at mid-slope depths (600–1000 m), whereas saRF predicts a very patchy, more restricted and slightly shallower (400–1000 m) distribution (Fig. 2). Although sensitivity achieved by MaxEnt is higher, a continuous band of cold-water coral reefs running along the slope of Rockall Bank is unlikely. All models predict presence on areas of steep topography, with probability of occurrence increasing on slopes with a steepness of >10 %. Presence also appears to be associated with troughs or peaks (high positive and/or negative BPI), as suggested by previous studies. These areas are where exposure to currents is highest. However, the small number of presence records for this biotope should lead to a careful interpretation of the results, and additional samples could be needed in order to improve RF models performances.
The Stylasterids and globose sponges on mixed substrates assemblage has only recently been described from Rockall Bank, based on the data used for this study (Long et al. Reference Long, Kerry, Davies and Stewart2010). In this study, it is predicted to occupy the upper part of the slope between 400 m and 700 m depth and the assemblage seems to prefer slopes steeper than 15–20 %. MaxEnt and saRF predict a distribution in the same depth band, although the MaxEnt model predicts a larger extent, whilst gRF predicts a slightly deeper distribution range stretching onto the tops of the ridges.
3.3. Differences in predicted extent
Although all three models performed similarly well, the final predictive maps produced by these models displayed differences in the extent and distribution of the three VMEs. The model validation results are all indicative of a valid model; yet, the final maps presented up to 30–35 % variation in the predicted extent of a VME, as well as clear differences in distributions (Fig. 2). These were mainly shifts in depth range, or presence on more or less vertical features. Previous authors have also observed differences in spatial predictions when comparing several modelling methods (Ready et al. Reference Ready, Kaschner, South, Eastwood, Rees, Rius, Agbayani, Kullander and Froese2010; Reiss et al. Reference Reiss, Cunze, Konig, Neumann and Kroncke2011; Downie et al. Reference Downie, von Numers and Bostrom2013). However, previous studies have found MaxEnt models to be restrictive in predictions, concentrating presence prediction around recorded presence points (Bentlage et al. Reference Bentlage, Peterson and Cartwright2009; Poulos et al. Reference Poulos, Chernoff, Fuller and Butman2012; Downie et al. Reference Downie, von Numers and Bostrom2013). In this present study, we observed the contrary, with MaxEnt predicting the largest extent for all three VMEs (Table 3). The apparent difference in MaxEnt's prediction of restricted vs extensive distribution in our study is likely a result of the use of the pseudo-absence records as background in the “samples with data” approach to MaxEnt modelling taken, rather than allowing the use of random sampling across the study area.
3.4. Implications on using models in management
The observations in this study highlight the variability of the predictions across modelling methods. Even when a single model appears to perform well, when measured against validation statistics, and may be considered valid for use by managers, the predictions resulting from the model are subject to additional spatial error. This small but important point, illustrating apparently equally good model performance yet clear differences in spatial predictions, highlights the limits of SDM as a tool for conservation planning. It is a relatively straightforward process to produce a map, sparing the cost and effort of extensive field sampling. Basing management decisions on these maps is, thus, tempting and possibly inevitable, but we urge caution and recommend that predicted maps are best used as a starting point for targeting future surveys. If maps are to be used in the decision-making process, independent validation of the maps is critical to the full understanding of model performance (Elith et al. Reference Elith, Graham, Anderson, Dudík, Ferrier, Guisan, Hijmans, Huettmann, Leathwick, Lehmann, Li, Lohmann, Loiselle, Manion, Moritz, Nakamura, Nakazawa, Overton, Peterson, Phillips, Richardson, Scachetti-Pereira, Schapire, Soberón, Williams, Wisz and Zimmermann2006). The good performance of the models in this study is encouraging, but it is at least partly a result of the evaluation procedure being based on random subsampling from the full dataset, as the lack of true independence between testing and training data sets, as well as spatial sorting bias, is known to artificially inflate model performances (Veloz Reference Veloz2009; Hijmans Reference Hijmans2012). However, the good cross-validation results demonstrate the stability of the models over this dataset.
In this present study, the extent and distribution of the three studied VMEs varied depending on the modelling method used. The information about where multiple models predictions differ is useful and can be used to illustrate spatial uncertainty in predictions, highlighting to users the error potential of predicted maps. Similarly, information about where multiple models predictions agree may be used to identify possible core areas (central to a species distribution), although the effectiveness of this approach would have to be tested. Downie et al. (Reference Downie, von Numers and Bostrom2013) suggest the use of an ‘ensemble model’ approach to mapping, combining the outputs of several models. However, other authors have found that whilst ensemble models can be of use, they do not necessarily improve predictions (Marmion et al. Reference Marmion, Parviainen, Luoto, Heikkinen and Thuiller2009; Grenouillet et al. Reference Grenouillet, Buisson, Casajus and Lek2011; Stohlgren et al. Reference Stohlgren, Ma, Kumar, Rocca, Morisette, Jarnevich and Benson2010). More research is needed in this area.
Whilst we recommend caution in the use of predictively modelled maps for management purposes, faced with the challenge of implementing conservation policy in vast areas of deep sea and High Seas, decisions are currently being taken based on ‘best available data’. To date, decisions regarding the management of fisheries to protect VMEs have been taken on the basis of maps produced using point data, which may itself date back decades to more than 100 years ago (Aish et al. Reference Aish2008; Auster et al. Reference Auster2013). This essentially restricts conservation efforts to areas that have been sampled, hampering progress in sustainable management of the deep sea and High Seas. Thus, while predictively modelled maps have clear limitations, they do provide a scientifically robust and repeatable means of estimating extent and distribution of species and assemblages, and thus represent ‘best available data’. We therefore advocate their use in marine management. However, it is important that environmental managers consider SDM predictions as the most probable distribution of the assemblage studied, given the available data, rather than a definitive picture of the reality. End users must always keep in mind that important aspects of this distribution might not have been caught by the sampling design. In addition, a good predictive model represents the potential range of a species (and in this case biotope), rather than the realised distribution (Downie et al. Reference Downie, von Numers and Bostrom2013) and, thus, estimates of extent based on models must also be treated with caution.
4. Acknowledgements
The authors would like to acknowledge with thanks the scientists, officers and crew of RV Kommandor Jack and MV Franklin associated with the collection of data used in this study, including the most recent (JC060, PSO Veerle Huvenne of NOC, Southampton); J. Davies, C. Jacobs and N. Golding; R. Ross; the staff at Geotek and Marin Matteknik AB; the wider Mapping the Deep and MAREMAP project partners; and the Marine Biological Association of the United Kingdom. HAS publishes with permission of the Director, British Geological Survey (Natural Environment Research Council).