INTRODUCTION
The scientific community has recognized that conversion of forest to other land uses is a major contributor to climate change (Foley et al. Reference Foley, DeFries, Asner, Barford, Bonan, Carpenter, Chapin, Coe, Daily, Gibbs, Helkowski, Holloway, Howard, Kucharik, Monfreda, Patz, Prentice, Ramankutty and Snynder2005; IPCC [Intergovernmental Panel on Climate Change] 2007). Deforestation in the tropics contributes 12–17% of annual global CO2 emissions (Houghton Reference Houghton2007; IPCC 2007; Van der Werf et al. Reference Van der Werf, Morton, DeFries, Olivier, Kasibhatla, Jackson, Collatz and Randerson2009). The amount of CO2 released from forest conversion depends on the conversion rate and methods, and on carbon stocks in the vegetation and soil. Tropical dry forest generally has lower carbon densities than humid forest, but dry forest covers c. 40% of all tropical vegetation (Murphy & Lugo Reference Murphy, Lugo, Bullock, Mooney and Medina1995; Jaramillo et al. Reference Jaramillo, Kauffman, Rentería-Rodríguez, Cummings and Ellingson2003; Glenday Reference Glenday2008) and therefore represents a significant terrestrial carbon store.
The coastal forests of east Africa are a mosaic of tropical dry forest habitats, with wetter forest types at higher elevations and along rivers. Only 5% of the tropical dry forest habitat remains in the eastern African coastal region, and is mostly found in patches of > 500 ha (Burgess et al. Reference Burgess, Clarke and Rodgers1998, Reference Burgess, Clarke, Madgwick, Robertson, Dickinson, Burgess and Clarke2000).
Biological value
During the past 20 years, the coastal forest region has increasingly been recognized as a region of major conservation importance within the African continent (Olson & Dinerstein Reference Olson and Dinerstein1998; Stattersfield et al. Reference Stattersfield, Crosby, Long and Wege1998; Burgess et al. Reference Burgess, Gordon, Salehe, Sumbi, Doggart, Rodgers, Clarke, Mittermeier, Gil, Hoffman, Pilgrim, Brooks, Mittermeier, Lamoreux and da Fonseca2004). The vegetation contains over 4000 plant species within more than 1000 plant genera, of which around 1750 plant species and 27 genera are endemic (Burgess et al. Reference Burgess, Gordon, Salehe, Sumbi, Doggart, Rodgers, Clarke, Mittermeier, Gil, Hoffman, Pilgrim, Brooks, Mittermeier, Lamoreux and da Fonseca2004). Lowland forest contains at least 554 forest-dependent endemic plant species, with 17 endemic genera (Clarke Reference Clarke, Burgess and Clarke2000). A substantial proportion of the endemic plant species are confined to a single forest, for example the Rondo and Litipo forests in southern Tanzania with at least 60 and 30 endemics, respectively (Clarke Reference Clarke, Burgess and Clarke2000). The coastal forest patches are also important in terms of vertebrate diversity and endemism, with 14 endemic species of birds, 14 endemic mammals, 132 endemic or near-endemic reptiles and seven endemic amphibians (Burgess et al. Reference Burgess, Gordon, Salehe, Sumbi, Doggart, Rodgers, Clarke, Mittermeier, Gil, Hoffman, Pilgrim, Brooks, Mittermeier, Lamoreux and da Fonseca2004).
Threats to remaining habitat
The remaining fragments of coastal forest of Tanzania are found within a matrix of miombo woodland, plantation and agricultural habitats (Burgess & Muir Reference Burgess and Muir1994; Burgess et al. Reference Burgess, Clarke, Madgwick, Robertson, Dickinson, Burgess and Clarke2000; CEPF [Critical Ecosystems Partnership Fund] 2003). They are threatened by clearing for farmland, selective logging for timber and burning for charcoal (Burgess et al. Reference Burgess, Clarke, Madgwick, Robertson, Dickinson, Burgess and Clarke2000). Charcoal is the major cooking fuel for urban Tanzanians, especially in Dar es Salaam (Anderson & Holm Reference Anderson and Holm1990; Ongara Reference Ongara1991; Burgess et al. Reference Burgess, Gordon, Salehe, Sumbi, Doggart, Rodgers, Clarke, Mittermeier, Gil, Hoffman, Pilgrim, Brooks, Mittermeier, Lamoreux and da Fonseca2004; Ahrends et al. Reference Ahrends, Burgess, Milledge, Bulling, Fisher, Smart, Clarke, Mhoro and Lewis2010). Within the Dar es Salaam and Pwani regions, forest disturbance and degradation are highly related to distance to Dar es Salaam city (Ahrends et al. Reference Ahrends, Burgess, Milledge, Bulling, Fisher, Smart, Clarke, Mhoro and Lewis2010).
Reserved areas
The study area contains 108 reserved areas, mainly forest reserves (FR), ranging in size from <100 ha to c. 200 000 ha, covering a total area of 872 000 ha (UNEP-WCMC [United Nations Environment Programme-World Conservation Monitoring Centre] & IUCN [International Union for Conservation of Nature] 2009). However, only 14 have been assigned an IUCN protected area category (for example the Mlinga Forest Reserve is IUCN category Ib and the Pande Game Reserve is IUCN category IV). A few are managed for catchment protection or forest conservation by the national Forestry and Beekeeping Division (FBD), but most are managed mainly by the District Natural Resource Departments for the production of timber and other forest products. Some are plantations of Eucalyptus, Senna siamia or teak (Tectona grandis). Within all reserves, there is an intention to maintain forest cover and condition, but economic policies are not fully integrated with biodiversity management goals (Dallu Reference Dallu2004) and budgets for enforcement and patrolling are insufficient for most reserves (Burgess et al. Reference Burgess, Bahane, Clairs, Danielsen, Dalsgaard, Funder, Hagelberg, Harrison, Haule, Kabalimu, Kilahama, Kilawe, Lewis, Lovett, Lyatuu, Marshall, Meshack, Miles, Munishi, Nashanda, Shirima, Swetnam, Willcock, Williams and Zahabu2010).
Carbon stock
Determining the average biomass for different parts of the study area is complicated because much of the forest is partially degraded and few field studies of forest biomass in the region have been published. Tanzania has reported an average forest biomass value of 60 tC ha−1 to the Food and Agriculture Organization (FAO 2010), although this is a national average that includes higher-biomass forest west of our study area. The national FBD reported an average biomass value of 157 tC ha−1 for eastern lowland forest with low to medium levels of degradation, and 33 tC ha−1 for highly-degraded lowland forest (FBD 2007). Another study of degraded forest around Dar es Salaam reported a biomass range from 52 tC ha−1 in areas 200 km from the city, to as low as 4 tC ha−1 for the most heavily-degraded forest on the city margins (Ahrends et al. Reference Ahrends, Burgess, Milledge, Bulling, Fisher, Smart, Clarke, Mhoro and Lewis2010). Finally, an African-wide satellite-based analysis of biomass produced average estimates of 64 tC ha−1 over all forest in our study area, with an average per district ranging from 75 tC ha−1 in Lindi to 5 tC ha−1 in Dar es Salaam (Baccini et al. Reference Baccini, Laporte, Goetz, Sun and Dong2008).
Understanding the trends of deforestation within the fragmented patches of forest remaining in Tanzania's coastal region and their contribution to CO2 emissions is crucial for the design of climate change mitigation and adaptation strategies that also aim to preserve the threatened biodiversity within these forests. Moreover, the fragmented forests have high biological importance and support hundreds of species found nowhere else on Earth (Burgess & Muir Reference Burgess and Muir1994; Burgess et al. Reference Burgess, Clarke and Rodgers1998, Reference Burgess, Clarke, Madgwick, Robertson, Dickinson, Burgess and Clarke2000; Brooks et al. Reference Brooks, Mittermeier, Mittermeier, da Fonseca, Rylands, Konstant, Flick, Pilgrim, Oldfield, Magin and Hilton-Taylor2002). They are also used by local people to support their livelihoods (Burgess & Clarke Reference Burgess and Clarke2000). Thus these forests are not only biotic carbon stocks, but also provide important biological and economical co-benefits. They also have a valuable role in conserving biodiversity and providing multiple benefits from the natural ecosystems.
This study builds on a previous study of deforestation rates and patterns during the 1990s (Tabor et al. Reference Tabor, Burgess, Mbilinyi, Kashaigili and Steininger2010). Here we aim to (1) estimate the carbon emissions due to the deforestation of coastal forests in Tanzania between 1990 and 2007, and (2) assess the deforestation rate (and the loss of carbon) within reserves versus non-reserved areas in the same area.
METHODS
Study area characterization
The coastal forest mosaic of eastern Africa comprises several forest types, including dry forest, scrub forest, riverine forest and coastal/afromontane transition forest (Clarke Reference Clarke, Burgess and Clarke2000; Schipper & Burgess Reference Schipper and Burgess2003). For the purposes of this paper, we refer to this region as the Zanzibar-Inhambane Coastal forest mosaic ecoregion (Olson et al. Reference Olson, Dinerstein, Wikramanayake, Burgess, Powell, Underwood, D'amico, Itoua, Strand, Morrison, Loucks, Allnutt, Ricketts, Kura, Lamoreux, Wettengel, Hedao and Kassem2001). In Tanzania, this region extends from the northern to southern border of the country and approximately 100 km inland from the coast. It covers, or partially covers, 18 districts within five political regions: Tanga, Pwani, Lindi, Mtwara and Dar es Salaam (Fig. 1). The area's annual rainfall is 500–1400 mm yr−1, its elevation is 0–1000 m above sea level, and its forests are mostly closed-canopy formations (Hamilton & Bensted-Smith Reference Hamilton and Bensted-Smith1989). Canopy height of these forests is typically 10–30 m, with the exception of trees in the transition forests at the base of the Eastern Arc mountains reaching 50 m (Burgess & Muir Reference Burgess and Muir1994). The focus of the analysis was on coastal dry forest and scrub forest types, which are closed canopy vegetation. Only those forests defined by remote sensing as closed-canopy tree cover in patches > 2 ha in size were considered. Deciduous woodlands were not included because of lower accuracy in distinguishing those areas from farmed landscapes with planted trees using medium-resolution satellite imagery.
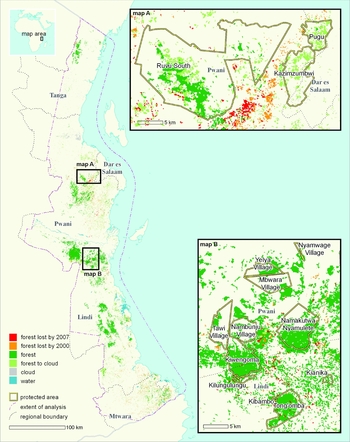
The extent of the coastal forests of Tanzania, across Tanga, Pwani, Lindi, Mtwara and Dar es Salaam regions, and forest cover in 1990–2000–2007. The two map insets detail patterns of deforestation from 1990–2000–2007 around reserved areas near Dar es Salaam (map A) and northern Lindi (map B).

Image processing
Following the methodology described in Harper et al. (Reference Harper, Steininger, Tucker, Juhn and Hawkins2007) and Tabor et al. (Reference Tabor, Burgess, Mbilinyi, Kashaigili and Steininger2010), we updated a Landsat-based map of forest cover and loss from 1990 to 2000 for the coastal region of eastern Africa using new Landsat data from c. 2007. We used orthorectified Landsat-5 and Landsat-7 images for the c. 1990 and c. 2000 periods and gap-filled Landsat-7 ETM+ SLC-off imagery acquired for c. 2007. The c. 2007 images were co-registered to the orthorectified c. 2000 Landsat data from NASA's Geocover project (Tucker et al. Reference Tucker, Grant and Dykstra2004). Two-date image pairs for c. 2000 and c. 2007 were classified using a supervised maximum likelihood classifier (MLC). Training classes for the MLC were visually interpreted from the imagery with the assistance of aerial photography, field data of the land use, and local expertise. We also referenced Tabor et al.'s (Reference Tabor, Burgess, Mbilinyi, Kashaigili and Steininger2010) validated forest cover classification for c. 2000 during the classification process to minimize differences in interpretation. The forest class was defined as primary, mature forest with closed canopy of >5 m height. Non-forest areas included farmland, fallows, open wooded areas, grasslands and plantations. The classification methodology, as explained in detail by Tabor et al. (Reference Tabor, Burgess, Mbilinyi, Kashaigili and Steininger2010), involved delineating multiple sites to define subclasses of each final class desired and running multiple iterations of the MLC. We then evaluated each iteration's results and added or modified training sites based on assessment of conspicuous errors until a final version was obtained that we believed to be as accurate as the source satellite data allowed. We combined the subclasses of the final classification with the final classes desired and filtered the result using a two-hectare sieve filter. We used the same approach and same type of source data, and interpreted in the same way with the experience from the previous forest cover and change analysis for c.1990–c. 2000. Thus, while we did not have new aerial or field data to validate the 2007 map, we assumed a similar level of accuracy to that estimated from the previous time period; this is an overall land-cover of 88% (Tabor et al. Reference Tabor, Burgess, Mbilinyi, Kashaigili and Steininger2010).
Forest cover and change statistics
Forest cover for 1990, 2000 and 2007 and change rates were calculated for each political region in Tanzania (ILRI [International Livestock Research Institute] 2007) and for each reserved area using the 2010 release of the World Database of Protected Areas (UNEP-WCMC & IUCN 2009). Dar es Salaam region was fully covered, while Tanga, Pwani, Lindi and Mtwara regions were only partially covered and thus we only report results for the analysed regions. All reserved areas that we analysed were fully covered by the satellite-image analysis.
We defined ‘observed forest cover’ as areas mapped as forest with the satellite image for the date in question, with a minimum-mapping unit of two hectares. ‘Known forest cover’ were areas of observed forest plus areas covered by cloud, but mapped as observed forest for a later image date. We included these areas as known forest because we excluded young secondary forest in our forest class. Rates of forest loss were calculated in per cent per year, based only on areas that were cloud free during either of the two dates in question. These rates were calculated using the accumulation function used by the Food and Agriculture Organization of the United Nations (FAO 1995).
The cloud factor (CF) value for each estimate was the ratio of observed habitat to that plus the potential habitat covered with clouds on that date. Similarly, the CF value for a change estimate was the baseline forest area divided by that plus forest covered by cloud in the second date. The CF value indicated confidence in the calculated forest cover and change estimates based on the coverage of the satellite imagery used.
Carbon stock and emission estimates
We used the Baccini et al. (Reference Baccini, Laporte, Goetz, Sun and Dong2008) raster map of above-ground biomass to estimate the carbon stock and emission associated with forest clearing in the study area. Carbon content was assumed to be 50% of dry weight. Below-ground carbon density was estimated by applying the root allocation equation from Cairns et al. (Reference Cairns, Brown, Helmer and Baumgarder1997). We calculated the average carbon stock in above- and below-ground biomass for each district based on the forested area in 2000. We combined the map of carbon stocks with that of forest-loss data for 1990–2000 and 2000–2007 to estimate gross carbon emissions during each period. We assumed that all carbon content was released to the atmosphere immediately after deforestation, following the ‘committed emissions’ approach used by Houghton et al. (Reference Houghton, Skole, Nobre, Hackler, Lawrence and Chomentowski2000) and others. We did not include estimates of biomass stock of the replacement vegetation following deforestation. Thus, we estimated only the gross emissions of deforestation and not the net carbon exchange associated with the change in land cover.
RESULTS
Forest cover and change statistics
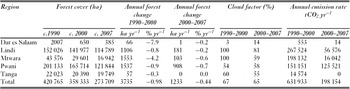
In 2007, coastal forest cover in Tanzania covered an area of 273 700 ha. Pwani and Lindi regions together had 236 633 ha or 86% of the remaining coastal forest, while only 385 ha of forest remained in Dar es Salaam.
Across the study area, the rate of forest loss had slowed from the 1.0% yr−1 in the 1990s to 0.4% yr−1 in 2000–2007. Deforestation also slowed in each of the five regions. More specifically, the decrease was greatest in Dar es Salaam, followed by Mtwara region. Rates of forest loss slowed the least in Pwani region (Table 1).
Forest loss and emissions among districts in Tanzania during the periods 1990–2000 and 2000–2007.

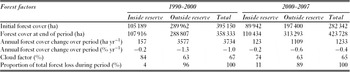
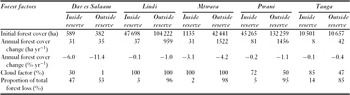
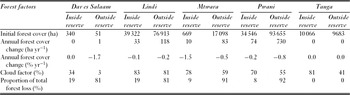
The aggregate deforestation rate inside reserves was lower than that outside reserves. Rates inside reserves were 0.2% yr−1 in 1990–2000 and in 2000–2007 versus 1.3% yr−1 in the 1990s and 0.6% yr−1 in 2000–2007 outside reserves (Table 2). While in 2000–2007 forest loss rates decreased in unreserved areas, forest loss rates in reserved areas remained almost constant between 1990–2000 and 2000–2007. However, deforestation had occurred in some reserved areas at rates above the regional rate (Tables 3 and 4). Reserves in Dar es Salaam, Mtwara and Pwani regions were most impacted.
Forest loss and emissions both inside and outside reserves (mainly FRs) in Tanzania during the periods 1990–2000 and 2000–2007.

Forest loss and emissions both inside and outside reserves (mainly FRs) among districts in Tanzania during the periods 1990–2000.

Forest loss and emissions both inside and outside reserves (mainly FRs) among districts in Tanzania during the periods 2000–2007.

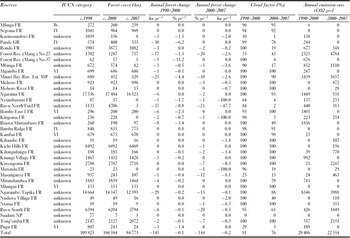
Ninety-eight per cent of the deforestation within reserved sites between 2000 and 2007 was accounted for by 22 of the 108 reserves assessed, and 76% of deforestation was accounted for by only eight reserves, namely Forest Reserve (Mangrove) No. 27, Mnazi Bay-Ruvuma Estuary Marine Park, Ruvu North Fuel FR, Kiwengoma FR, Masanganya FR, Ngarambe-Tapika FR, Ruvu South FR and Tong'omba FR (Table 5). Several reserves showed increases in deforestation rates, namely Forest Reserve (Mangrove) No. 27, Mohoro FR, Kiwengoma FR, Masanganya FR, Ruvu South FR and Tong'omba FR.
Forest loss and emissions from the top 22 (out of 108) reserves in Tanzania 1990–2000 and 2000–2007. Key reserved areas description: FR = forest reserve (managed by central government and local authority); Village FR = village land forest reserve; NP = national park; GR = game reserve; and MP = marine park.

Carbon stock and emission estimates
The average carbon density of remaining coastal forest in Tanzania, as estimated by this study and Baccini et al. (Reference Baccini, Laporte, Goetz, Sun and Dong2008), was 64 tC ha−1. This provides an estimated 17 Mt C stored in the remaining costal forest in 2007. We estimate carbon dioxide gross emissions from forest clear-cutting in the study area to have been 0.63 Mt CO2 yr−1 during the 1990s and 0.20 Mt CO2 yr−1 during 2000–2007. Like deforestation, emissions were reduced substantially from the 1990s to 2000–2007 for all the regions included in this study (Table 1). Pwani, with the highest deforestation rate in 2000–2007, had 0.13 Mt CO2 yr−1 or 63% of the total emissions for that period.
During 2000–2007, emissions from reserved areas, mainly FRs, accounted for approximately 11% of the total CO2 released from deforestation in the coastal forest of Tanzania. Total emissions from reserves decreased from 0.03 Mt CO2 yr−1 to 0.02 Mt CO2 yr−1.
DISCUSSION
We used new estimates of forest clearance in the Zanzibar Inhambane region of eastern Africa, combined with existing satellite-derived estimates of carbon stocks, to estimate the amount of carbon remaining in forest vegetation and CO2 emissions. These data were also used to estimate carbon losses in different parts of coastal Tanzania.
The average deforestation rate in the coastal forests of Tanzania during the 1990s was relatively high (1.0% yr−1). This compares unfavourably with the average rate for the African continent (0.2% yr−1; Hansen et al. Reference Hansen, Stehman, Potapov, Loveland, Townshend, DeFries, Pittman, Stolle, Steininger, Carroll and Dimiceli2008), and several African countries analysed using similar methods (ranging from a loss of 0.2% yr−1 in Liberia to 0.9% yr−1 in Madagascar; Christie et al. Reference Christie, Steininger, Juhn and Peal2007; Harper et al. Reference Harper, Steininger, Tucker, Juhn and Hawkins2007; Hansen et al. Reference Hansen, Stehman and Potapov2010).
Deforestation rates in some parts of the coast had decreased substantially after 2000, but rates remained relatively high near Dar es Salaam (Fig. 1). The rates in Pwani region remained constant after 2000, unlike all other regions. Pwani still suffers the impacts of high, and probably increasing, demand from Dar es Salaam for charcoal and wood for building materials (Ahrends et al. Reference Ahrends, Burgess, Milledge, Bulling, Fisher, Smart, Clarke, Mhoro and Lewis2010). Timber harvesting for export was also a major issue in the early 2000s, with Rufiji and Pwani districts accounting for 70% of all harvested timber in southern Tanzania at that time (Milledge et al. Reference Milledge, Gelvas and Ahrends2007). In the far south, in Mtwara, there was an expansion of new agricultural land. The low rates of forest loss in the Tanga region can be explained by exhaustion of forest outside reserves.
The area of forest loss within reserves is nine times slower than in the unreserved forest lands, mirroring global trends (Scharlemann et al. Reference Scharlemann, Kapos, Campbell, Lysenko, Burgess, Hansen, Gibbs, Dickson and Miles2010). However, reserves are not immune from forest loss. Significant losses are being experienced in some reserved areas, especially the FRs near Dar es Salaam, with forest being lost primarily to charcoal burning (Ahrends et al. Reference Ahrends, Burgess, Milledge, Bulling, Fisher, Smart, Clarke, Mhoro and Lewis2010). In Kiwengoma, in Pwani region, for example, a combination of logging and agricultural pressure resulted in forest loss and degradation (Stubblefield Reference Stubblefield1994; Dallu Reference Dallu2004; Ahrends et al. Reference Ahrends, Burgess, Milledge, Bulling, Fisher, Smart, Clarke, Mhoro and Lewis2010). Tong'omba Forest Reserve, in Lindi region near the border with Pwani (Fig. 1), is highly threatened by logging activities, acerbated by improved road access (Stubblefield Reference Stubblefield1994; Milledge et al. Reference Milledge, Gelvas and Ahrends2007). We believe deforestation in the reserved areas of Mtwara is associated with both the particularly high rural population density there and the lack of reserve management capacity in this large and remote area. As reserves contain most of the remaining forest resource, they face increasing pressure to supply materials for human use and thus account for a significant proportion of the CO2 emissions.
Caveats
Estimation of forest cover and change using satellite imagery is relatively difficult in this region because of frequent cloud cover and transitional vegetation types. The impact of cloud cover is reflected in the CF values, and estimates for Dar es Salaam and Pwani were most affected. Because most of these areas were not covered by clouds, the percentage rates should be representative of the entire regions while the absolute rates are minimum potential rates. Classifying land cover change in transitional landscapes is challenging, however our approach, which classifies multiple dates of imagery in a single process, minimizes potential effects from classifying images separately and takes into account phenological variations between dates.
Another challenge in reporting statistics is potentially inaccurate delineations of reserve boundaries. The files we used were the best available, but still may contain significant errors. Calculations of forest area, carbon stocks and emissions may need to be revised when improved boundary data become available. Most of the reserved areas have been assigned an IUCN protected area category and they require a detailed review to assess which of them meet the formal definition of a protected area.
While a coarse continental product, the carbon map produced by Baccini et al. (Reference Baccini, Laporte, Goetz, Sun and Dong2008) agreed with our research data. For example, within the 10 km buffer area around Dar es Salaam city, Baccini et al. (Reference Baccini, Laporte, Goetz, Sun and Dong2008) found the average forest biomass was 9 ± 4.39 tC ha−1, while Ahrends et al.'s (Reference Ahrends, Burgess, Milledge, Bulling, Fisher, Smart, Clarke, Mhoro and Lewis2010) field estimates produced an average of 4 ± 2.84 tC ha−1. Baccini et al. (Reference Baccini, Laporte, Goetz, Sun and Dong2008) found forest further than 220 km from Dar es Salaam had an average carbon density biomass of 57 ± 15.89 tC ha−1 while Ahrends et al.'s (Reference Ahrends, Burgess, Milledge, Bulling, Fisher, Smart, Clarke, Mhoro and Lewis2010) field study found an average of 52 ± 4.99 tC ha−1. The values used in this study are also similar to those determined from field measurements in Kenyan dry forests (50 tC ha−1; Glenday Reference Glenday2008). Baccini et al.'s (Reference Baccini, Laporte, Goetz, Sun and Dong2008) biomass map, in accordance with the requirements of the Tier-1 approach described in the IPCC Good Practice Guidance for Land Use, Land-Use Change and Forestry (Penman et al. Reference Penman, Gytarsky, Hiraishi, Krug, Kruger, Pipatti, Buendia, Miwa, Ngara, Tanabe and Wagner2003), did not differentiate emissions from different conversion processes, such as burning or selective logging; we assume that all CO2 is released immediately after the deforestation event. Our estimates can be considered at the Tier-1 level. As biomass data based on higher IPCC tiers become available, emissions may be recalculated.
Beyond the challenges of estimating forest clearance and associated emissions, there are greater challenges in estimating forest degradation owing to selective logging and fuelwood collection and their associated emissions. We did not include any estimates for forest degradation, which may be best estimated by field sampling. Studies of tropical humid forest and areas severely affected by logging demonstrate the best potential for satellite estimation of forest degradation (Asner et al. Reference Asner, Keller, Pereira and Zweede2002; Souza Jr et al. Reference Souza, Firestone, Silva and Roberts2003, Reference Souza, Roberts and Cochrane2005; Souza Jr & Roberts Reference Souza and Roberts2005; Defries Reference DeFries, Achard, Brown, Herold, Murdiyarso, Schlamadinger and Souza2007). In dry forest regions, high spatial resolution satellite imagery and more thorough field work may be required. Mid-resolution images could be used to identify critical areas with intense degradation and assist in the design of measuring and monitoring activities in the field.
The reduction in emissions due to deforestation that we estimated represents a significant contribution towards the international goal of reducing global greenhouse gas emissions. However, we cannot claim whether this is a result of policy or exhaustion of forest near urban centres, such as Dar es Salaam. In addition, we cannot assume that deforestation reductions in this area were not offset by increases in other areas, such as through national or international leakage. Much of the deforestation in the 1990s was associated with international logging operations, with a high potential for international leakage as politics, access and logging costs evolve among tropical countries. Coastal Tanzania still has significant forest cover area, both in terms of carbon storage and especially in terms of biodiversity conservation. However, much of its forest remains unprotected. Domestic demand for fuelwood and international demand for high-value timber products continue to threaten remaining forests.
CONCLUSIONS
Tanzania can benefit greatly from international agreements on climate change because it possesses significant remaining areas of forest after relatively high rates of recent deforestation. Policies must be implemented to reduce emissions from deforestation and forest degradation (REDD+, see URL http://www.un-redd.org/AboutREDD/tabid/582/Default.aspx) and initiate forest restoration programmes (Miles et al. Reference Miles, Kabalimu, Bahane, Ravilious, Dunning, Bertzky, Kapos and Dickson2009; Milledge Reference Milledge2009; UNFCCC [United Nations Framework Convention on Climate Change] 2009; Burgess et al. Reference Burgess, Bahane, Clairs, Danielsen, Dalsgaard, Funder, Hagelberg, Harrison, Haule, Kabalimu, Kilahama, Kilawe, Lewis, Lovett, Lyatuu, Marshall, Meshack, Miles, Munishi, Nashanda, Shirima, Swetnam, Willcock, Williams and Zahabu2010). Reducing emissions may not only help mitigate climate change, but may also provide important additional benefits, such as the conservation of biodiversity and the maintenance of critical ecosystem services (Stickler et al. Reference Stickler, Nepstad, Coe, McGrath, Rodrigues, Walker, Soares-Filho and Davidson2009; Harvey et al. Reference Harvey, Dickson and Kormos2010). REDD+ is an attractive mitigation option owing to its cost-effectiveness and ready availability (Nabuurs et al. Reference Nabuurs, Masera, Andrasko, Benitez-Ponce, Boer, Dutschke, Elsiddig, Ford-Robertson, Frumhoff, Karjalainen, Krankina, Kurz, Matsumoto, Oyhantcabal, Ravindranath, Sanz Sanchez, Zhang, Metz, Davidson, Bosch, Dave and Meyer2007; Stern Reference Stern2007; Eliasch Reference Eliasch2008). The results from our study may provide the initial basis for determining a national emissions baseline and a regular monitoring programme.
ACKNOWLEDGEMENTS
This work was supported by the Critical Ecosystem Partnership Fund (CEPF). CEPF is a joint initiative of, Conservation International, the Global Environment Facility, the Government of Japan, l'Agence Française de Développement, the MacArthur Foundation and the World Bank. A fundamental goal is to ensure civil society is engaged in biodiversity conservation. We thank Kellee Koenig for creating the map in this paper, John Watkin of CEPF for his support and enthusiasm for this research, Ned Horning for his assistance in managing the project, Antje Ahrends for sharing data on biomass and the three anonymous reviewers for the constructive comments.