Implications
Feeding high levels of concentrates results in increased trans(t)10-18:1 and decreased t11-18:1 (vaccenic acid) deposition in beef. High intake of trans fatty acids other than t11-18:1 is, according to observational studies, associated with an increased risk of coronary heart disease in humans, whereas t11-18:1 may have independent beneficial human health effects and these are in part mediated through its conversion to cis(c)9, t11-18:2 (rumenic acid). Vitamin E has been postulated to modify rumen microbial populations and consequently fatty acid biohydrogenation. The current trial, therefore, aimed to determine the level of vitamin E supplementation that would optimally prevent the shift from t11-18:1 to t10-18:1 and consequently improve the healthfulness of beef fed high-grain diets. Current findings could have implications for the beef industry if regulations are imposed requiring trans fat labelling of ruminant products with increased levels of trans fatty acids other than t11-18:1. The beef industry using a new trademark (‘E-Beef’) may find the information useful for product differentiation.
Introduction
Beef from animals fed high-concentrate diets contains more trans(t)10-18:1 than t11-18:1 (vaccenic acid; Dugan et al., Reference Dugan, Kramer, Robertson, Meadus, Aldai and Rolland2007; Aldai et al., Reference Aldai, Dugan, Rolland and Kramer2009). Inclusion of increased amounts of grain in beef finisher diets creates a rumen environment conducive for biohydrogenation of polyunsaturated fatty acids (PUFA) through the t10-18:1 instead of t11-18:1 pathway resulting in an increased rate of t10-18:1 deposition (Hristov et al., Reference Hristov, Kennington, McGuire and Hunt2005; Aldai et al., Reference Aldai, Dugan, Kramer, Robertson, Juárez and Aalhus2010). For humans, total trans fatty acid intake is associated with an increase in coronary heart disease (Oh et al., Reference Oh, Hu, Manson, Stampfer and Willett2005); however, studies on effects of individual t18:1 isomers are limited (Field et al., Reference Field, Blewett, Proctor and Vine2009; Wang et al., Reference Wang, Jacome-Sosa and Proctor2012). In rabbits, feeding butter enriched with t10-18:1 had unhealthy effects on blood lipoprotein profiles, whereas effects of feeding butter enriched with t11-18:1 were limited (Bauchart et al., Reference Bauchart, Roy, Lorenz, Chardigny, Ferlay, Gruffat, Sébédio, Chilliard and Durand2007; Roy et al., Reference Roy, Chardigny, Bauchart, Ferlay, Lorenz, Durand, Gruffat, Faulconnier, Sébédio and Chilliard2007). In humans, intake of dairy products enriched with t11-18:1 and cis(c)9, t11-18:2 (rumenic acid) also had limited effects on blood lipid profiles (Tricon et al., Reference Tricon, Burdge, Jones, Russell, El-Khazen, Moretti, Hall, Gerry, Leake, Grimble, Williams, Calder and Yaqoob2006; Sofi et al., Reference Sofi, Buccioni, Cesari, Gori, Minieri, Mannini, Casini, Gensini, Abbate and Antongiovanni2010), however, some unhealthy changes were noted when relatively high levels were consumed (Chardigny et al., Reference Chardigny, Destaillats, Malpuech-Brugere, Moulin, Bauman, Lock, Barbano, Mensink, Bezelgues, Chaumont, Combe, Cristiani, Joffre, German, Dionisi, Boirie and Sebedio2008). Vaccenic acid, however, may have other positive health influences either independently, or by desaturation to rumenic acid (Field et al., Reference Field, Blewett, Proctor and Vine2009; Wang et al., Reference Wang, Jacome-Sosa and Proctor2012), which has many potential health benefits mostly relating to its anticarcinogenic, immune modulatory and anti-inflammatory properties (Benjamin and Spener, Reference Benjamin and Spener2009). Currently, nutritional strategies that substantially prevent the t10-18:1 shift (i.e. increases in t10-18:1 and reductions in t11-18:1) in grain-fed beef are few, if any. Development of such strategies would, therefore, be beneficial to both producers and consumers.
Vitamin E (dl-α-tocopherol) which is primarily active as an antioxidant has been reported to protect PUFA from free-radical attack in vivo and post mortem in animal tissues (Morrissey et al., Reference Morrissey, Quinn and Sheehy1994; Gabryszuk et al., Reference Gabryszuk, Czauderna, Baranowski, Strzałkowska, Jóźwik and Krzyżewski2007). It has also been shown to prevent the t11- to t10-18:1 shift in plasma (Kay et al., Reference Kay, Roche, Kolver, Thomson and Baumgard2005) and milk (Pottier et al., Reference Pottier, Focant, Debier, De Buysser, Goffe, Mignolet, Froidmont and Larondelle2006) in cattle. Recently, Juárez et al. (Reference Juárez, Dugan, Aldai, Aalhus, Basarab, Baron and McAllister2010) showed that feeding 1051 IU vitamin E/animal per day during the finishing period can reduce t10-18:1 and increase t11-18:1 in cattle subcutaneous fat. Vitamin E might, therefore, be an efficient way to lower the concentration of fatty acids, which pose human health risk when feeding high-concentrate diets. In addition, dietary supplementation of vitamin E improves colour and lipid stability of beef (Lee et al., Reference Lee, Panjono, Kang, Kim and Park2008; Nassu et al., Reference Nassu, Dugan, Juárez, Basarab, Baron and Aalhus2011a), and has potential to reduce carcinogenic heterocyclic amines in cooked meat (Liao et al., Reference Liao, Xu and Zhou2009). These benefits give vitamin E comparative advantage over other dietary strategies for manipulating fatty acid profiles such as use of buffers (Aldai et al., Reference Aldai, Dugan, Kramer, Robertson, Juárez and Aalhus2010), dried distillers grains with solubles (Dugan et al., Reference Dugan, Aldai, Kramer, Gibb, Juárez and McAllister2010), condensed tannins (Vasta et al., Reference Vasta, Makkar, Mele and Priolo2009) and saponins (Brogna et al., Reference Brogna, Nasri, Salem, Mele, Serra, Bella, Priolo, Makkar and Vasta2011). That could also economically justify its inclusion in beef finisher diets. However, the dietary concentration of vitamin E required to optimally prevent the t10-18:1 shift in beef fed high-concentrate diets has not been established. The objective of the current study was to determine the effect of graded levels of vitamin E supplementation on t18:1 and conjugated linoleic acid (CLA) in subcutaneous and intramuscular fat of steers fed a barley-based diet.
Material and methods
Animals and diets
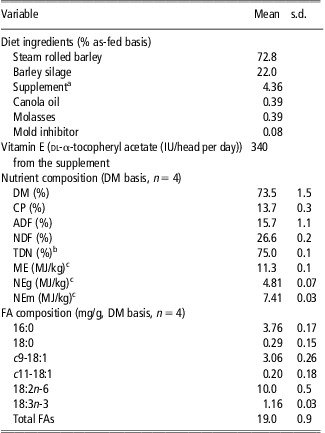
Fifty-six British × Continental crossbred steers estimated to be between 8 and 10 months of age were purchased commercially. Animals were fed barley silage and over a 1-month 7-step transition period were placed on experimental finishing diets. After the transition period, animals weighed 430±14.5 kg and were stratified by weight into eight pens (four levels of dietary vitamin E; two pens/vitamin E level; seven steers/pen and n = 14 steers/treatment) at the Lacombe Research Centre of Agriculture and Agri-Food Canada. All finisher diets contained 73% steam rolled barley, 22% barley silage and 5% supplement (Table 1; as-fed basis). The supplement provided 340 IU dl-α-tocopheryl acetate/animal per day. Four experimental finishing diets were created by top-dressing and hand mixing additional vitamin E (0, 350, 700 or 1400 IU dl-α-tocopheryl acetate/steer per day). To ensure that all the feed provided each day was consumed, it was provided at ∼2.5% of BW once daily, which resulted in 10% to 15% orts after 18 h and complete consumption by 24 h. Diets were randomly assigned to pens. Steers in each pen were group fed and were capable of feeding at the feed bunk at the same time (0.8 m of space at the bunk per animal).
Composition of the basal total mixed ration

s.d. = standard deviation; DM = dry matter; ADF = acid detergent fibre; NDF = neutral detergent fibre; TDN = total digestible nutrients; ME = metabolisable energy; NEg = net energy for gain; NEm = net energy for maintenance; FA = fatty acid.
aSupplement contained 93% DM, 23% CP, 2.7% crude fat, 4.0% crude fibre, 8.7% calcium, 2.2% phosphorus, 1.3% sodium, 0.7% potassium, 0.3% sulphur, 0.2% magnesium, 2800 mg/kg zinc, 2200 mg/kg manganese, 963 mg/kg iron, 907 mg/kg copper, 48.5 mg/kg iodine, 17 mg/kg cobalt, 14.5 mg/kg selenium, 241 000 IU/kg vitamin A and 45 000 IU/kg vitamin D.
bFor finishing diets, TDN (%) = 92.2 to 1.12 × ADF.
cME and NEm and NEg values were calculated according to NRC (1996).
Steers were fed experimental diets for an average of 120 days. Dietary treatments and experimental procedures were approved by the Lacombe Research Centre Animal Care Committee. Animal care was in compliance with the principles and guidelines established by the Canadian Council on Animal Care (1993).
Feed analysis
Feed samples were collected weekly and stored at −20°C, then pooled monthly before analyzed for dry matter and CP according to Association of Official Analytical Chemists (AOAC, 2003), and acid detergent fibre and neutral detergent fibre as described by Van Soest et al. (Reference Van Soest, Robertson and Lewis1991). Fatty acid methyl esters (FAMEs) from the finishing total mixed ration were prepared as described by Sukhija and Palmquist (Reference Sukhija and Palmquist1988) and analyzed using the chromatographic conditions reported by Dugan et al. (Reference Dugan, Kramer, Robertson, Meadus, Aldai and Rolland2007).
Sample collection
Steers were slaughtered at the Lacombe Research Centre abattoir over three slaughter dates within a 1-month period (two steers/pen per treatment per slaughter day for the first and third kill, with three steers/pen per treatment for the second kill) at target ultrasound backfat measurements of 6 to 8 mm. Ultrasound backfat thickness (mm) was measured by a certified ultrasound technician between the 12th and 13th rib over the longissimus muscle on the right side of each animal using an Aloka 500V diagnostic real-time ultrasound with a 17 cm 3.5 MHz linear array transducer (Overseas Monitor Corporation Ltd, Richmond, BC, Canada) following procedures described by Brethour (Reference Brethour1992). At slaughter, final live weights were recorded and animals were stunned, exsanguinated and dressed in a commercial manner. Carcass quality traits were also measured at slaughter and results were reported by Nassu et al. (Reference Nassu, Dugan, Juárez, Basarab, Baron and Aalhus2011a). At ∼40 min post mortem, during evisceration, a cube of subcutaneous fat (5 cm × 5 cm × the thickness of the subcutaneous fat) was collected from the grade site (12th rib) and stored at −80°C for subsequent subcutaneous fatty acid determinations. At 24 h post mortem, the left longissimus thoracis muscle was removed from the carcass. A steak 2.5 cm thick was dissected from the posterior end of the 12th rib, comminuted using a Robot Coupe Blixir BX3 (Robot Coupe USA Inc., Ridgeland, MS, USA) and frozen (−80°C) pending intramuscular fatty acid analysis.
Fatty acid analysis
Subcutaneous fat samples (50 mg) were freeze-dried and directly methylated with sodium methoxide according to Cruz-Hernandez et al. (Reference Cruz-Hernandez, Deng, Zhou, Hill, Yurawecz, Delmonte, Mossoba, Dugan and Kramer2004). Intramuscular fatty acids were extracted from 1 g of freeze-dried meat samples using a mixture of chloroform–methanol (2 : 1 v/v) according to Folch et al. (Reference Folch, Lees and Stanley1957). Lipid aliquots (10 mg) from each muscle sample were methylated separately using acidic (5% methanolic HCl) and basic (0.5 N sodium methoxide) reagents (Kramer et al., Reference Kramer, Hernandez, Cruz-Hernandez, Kraft and Dugan2008). Internal standard (1 ml of 1 mg 23:0 methyl ester/ml toluene) was added before the addition of the methylating reagent.
The majority of FAMEs were analyzed using the gas chromatography (GC) and Ag+-HPLC methods outlined by Cruz-Hernandez et al. (Reference Cruz-Hernandez, Deng, Zhou, Hill, Yurawecz, Delmonte, Mossoba, Dugan and Kramer2004) except t18:1 isomers, which were analyzed using two complementary GC temperature programmes instead of analyses after preparatory Ag+-TLC separation at 120°C (Dugan et al., Reference Dugan, Kramer, Robertson, Meadus, Aldai and Rolland2007; Kramer et al., Reference Kramer, Hernandez, Cruz-Hernandez, Kraft and Dugan2008). The first temperature programme was as previously described (temperature programme A; 45°C held for 4 min, increased at 13°C/min to 175°C and held for 27 min, then increased at 4°C/min to 215°C and held for 35 min) by Cruz-Hernandez et al. (Reference Cruz-Hernandez, Deng, Zhou, Hill, Yurawecz, Delmonte, Mossoba, Dugan and Kramer2004). The second programme (temperature programme B; 45°C held for 4 min, increased at 13°C/min to 150°C and held for 47 min, then increased at 4°C/min to 215°C and held for 35 min) improved the resolution of some t18:1 isomers (t6-8 to t11-18:1) and allowed for the analysis of the remaining t18:1 isomers by difference (Kramer et al., Reference Kramer, Hernandez, Cruz-Hernandez, Kraft and Dugan2008).
For the identification of FAME by GC, the reference standard no. 461 from Nu-Check Prep Inc. (Elysian, MN, USA) was used. Branched-chain FAMEs were identified using a GC reference standard BC-Mix1 purchased previously from Applied Science (State College, PA, USA). For CLA isomers, the UC-59M standard from Nu-Chek Prep Inc. was used as it contained all four positional CLA isomers. Individual CLA isomers were obtained from Matreya Inc. (Pleasant Gap, PA, USA). The t18:1 and CLA isomers not included in the standard mixtures were identified by their retention times and elution orders, as reported previously (Cruz-Hernandez et al., Reference Cruz-Hernandez, Deng, Zhou, Hill, Yurawecz, Delmonte, Mossoba, Dugan and Kramer2004; Kramer et al., Reference Kramer, Hernandez, Cruz-Hernandez, Kraft and Dugan2008). All chemicals and solvents were of analytical grade. The FAMEs were quantified using chromatographic peak area and internal standard (23:0 ME)-based calculations. Fatty acid concentrations were reported as percentage of total fatty acids identified.
Statistical analyses
Statistical analyses for subcutaneous and intramuscular fatty acids were performed using the PROC MIXED procedure of Statistical Analysis Systems Institute (SAS, 2009). The model incorporated dietary vitamin E dosage (340, 690, 1040 or 1740 IU/steer per day) as the main effect and the random effects of kill and pen. As pen was not significant, it was removed from the model. Individual animal was used as an experimental unit. The polynomial CONTRAST statement was included in the model to test for linear and quadratic effects of increasing dietary levels of vitamin E on subcutaneous and intramuscular fatty acid composition. The level of statistical significance for all analyses was set at P ≤ 0.05.
Results
Diet composition
Ingredients and chemical composition of the diets are shown in Table 1. Diets contained 1.9% total fatty acids. Linoleic acid (18:2n-6, LA; 10%) was the most abundant fatty acid followed by 16:0 (3.8%) and c9-18:1 (3%).
Subcutaneous fat fatty acid profiles
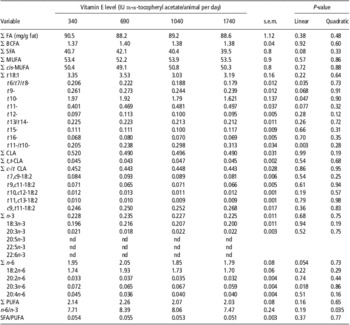
Table 2 shows effects of vitamin E on fatty acid profiles in subcutaneous fat of steers fed high levels of barley. Dietary vitamin E concentration had no effect (P > 0.05) on total fatty acids (mg/g fat), percentages of total branched chain fatty acids (BCFA), mono-unsaturated fatty acids (MUFA) and cis-MUFA in subcutaneous fat. The total amount of saturated fatty acids (SFA) in subcutaneous fat tended to decrease linearly with increasing vitamin E supplementation (P < 0.10).
Effect of graded levels of vitamin E on FA profiles (% of total FAs) in subcutaneous fat of steers fed a barley-based diet

Σ FA = total fatty acids; s.e.m. = standard error of mean; BCFA = branched chain fatty acids; SFA = saturated fatty acids; MUFA = mono-unsaturated fatty acids; CLA = conjugated linoleic acid; nd = not detected; PUFA = polyunsaturated fatty acids; n-3 = omega-3 FAs; n-6 = omega-6 FAs.
Σ BCFA = sum of iso-15:0 + anteiso-15:0 + iso-17:0 + anteiso-17:0 + iso-18:0;
ΣSFA = sum of 12:0 + 14:0 + 15:0 + 16:0 + 17:0 + 18:0 + 19:0 + 20:0;
Σ c-MUFA = sum of c9-14:1 + c9-15:1 + c7-16:1 + c9-16:1 + c11-16:1 + c13-16:1 + c9-17:1 + c9-18:1 + c11-18:1 + c12-18:1 + c14-18:1 + 1 c5-18:1 + c10-19:1 + c9-20:1 + c11-20:1;
Σ t 18:1 = Σt -MUFA = sum of t 6/t 7/t 8- + t 9- + t 10- + t 11- + t 12- + t 13/t 4- + t 15- + t 16;
Σ MUFA = c-MUFA + t -MUFA;
Σ n-3 = sum of 18:3n-3 + 20:3n-3;
Σ n-6 = sum of 18:2n-6 + 20:2n-6 + 20:3n-6 + 20:4n-6;
n-6/n-3 = (sum of 18:2n-6 + 20:3n-6 + 20:4n-6)/(sum of 18:3n-3 + 22:5n-3);
Σ PUFA = sum of 18:3n-3 + 18:2n-6 + 20:2n-6 + 20:3n-3 + 20:3n-6 + 20:4n-6;
Σ t,t-CLA = sum of t 6,t8-18:2 + t 10,c12-18:2;
Σ c,t-CLA = sum of t 12,1 c 4-18:2 + c 9, t11-18:2;
Σ CLA = sum of t 6/t 8-18:2 + t 9,c11-18:2 + t 10,c12-18:2 + t 12,c14-18:2 + c9,t 11-18:2;
t 11-/t 10- = t 11-18:1/ t 10-18:1 ratio;
SFA/PUFA = (sum of 12:0 + 14:0 + 15:0 + 16:0 + 17:0 + 18:0 + 19:0 + 20:0)/(sum of 18:3n-3 + 18:2n-6 + 20:2n-6 + 20:3n-3 + 20:3n-6 + 20:4n-6).
The dominant t18:1 isomers in subcutaneous fat were t10-18:1 and t11-18:1. Increasing levels of dietary vitamin E led to a linear decrease in the content of t6-/t7-/t8-18:1 and t10-18:1 (P < 0.05). The subcutaneous fat proportion of t11-18:1 tended to increase linearly with vitamin E supplementation (P < 0.10). The t11-/t10-18:1 ratio also increased linearly (P < 0.05) with vitamin E concentration.
The proportion of total t,t- and c,t-CLA, and the sum of all CLA isomers in subcutaneous fat were unaffected (P > 0.05) by dietary vitamin E supplementation. The dominant CLA isomer was c9,t11-18:2 followed by t7,c9-18:2 and together they accounted for 68% of CLA. Consistent with total CLA, no changes in individual CLA isomers were found with increasing vitamin E supplementation (P > 0.05).
Vitamin E level in the diet also had no influence (P > 0.05) on total and individual n-3 fatty acids in subcutaneous fat. There was a linear decrease in total n-6 fatty acids with increasing vitamin E supplementation (P < 0.05, Table 2). This was related to a linear decline in 20:3n-6 (P < 0.05) in subcutaneous fat and the lowest value was recorded for the 1740 IU vitamin E/day treatment. The subcutaneous fat n-6:n-3 ratio, however, increased and then decreased in a quadratic (P < 0.05) fashion with steers supplemented with 690 and 1740 IU/day having the largest and smallest values, respectively. There were no differences (P > 0.05) in proportions of total PUFA content and SFA/PUFA ratio in subcutaneous fat across vitamin E treatments.
Intramuscular fatty acid profiles
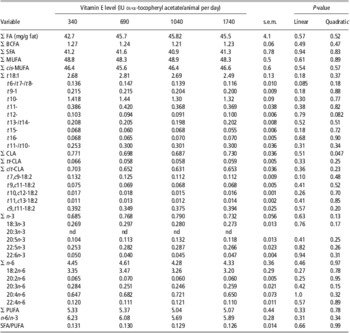
As shown in Table 3, adding vitamin E to the diet had little effect on the overall fatty acid composition of intramuscular fat. Total fatty acids (mg/g fat) and proportions of total BCFA, SFA, cis-MUFA and MUFA in intramuscular were not influenced (P > 0.05) by vitamin E concentration. Vitamin E supplementation in the diet also had no effect (P > 0.05) on total t18:1 isomers. The major t18:1 isomers remained t10- and t11-18:1, however, neither their levels nor the t11-/t10-18:1 ratio in intramuscular fat were affected by vitamin E supplementation (P > 0.05). The content of t6-/t7-/t8-18:1 and t12-18:1, however, exhibited linear and quadratic patterns, respectively (P < 0.1; Table 3).
Effect of graded levels of vitamin E on FA profiles (% of total FAs) in intramuscular fat of steers fed a barley-based diet

Σ FA = total fatty acids; s.e.m. = standard error of mean; BCFA = branched chain fatty acids; SFA = saturated fatty acids; MUFA = mono-unsaturated fatty acids; CLA = conjugated linoleic acid; nd = not detected; PUFA = polyunsaturated fatty acids; n-3 = omega-3 FAs; n-6 = omega-6 FAs.
Σ BCFA = sum of iso-15:0 + anteiso-15:0 + iso-17:0 + anteiso-17:0 + iso-18:0;
Σ SFA = sum of 12:0 + 14:0 + 15:0 + 16:0 + 17:0 + 18:0 + 19:0 + 20:0;
Σ c-MUFA = sum of c9-14:1 + c9-15:1 + c7-16:1 + c9-16:1 + c11-16:1 + c13-16:1 + c9-17:1 + c9-18:1 + c11-18:1 + c12-18:1 + c14-18:1 + 1 c5-18:1 + c10-19:1 + c9-20:1 + c11-20:1;
Σ t -18:1 = Σt -MUFA = sum of t 6/t 7/t 8- + t 9- + t 10- + t 11- + t 12- + t 13/ t 4- + t 15- + t 16;
Σ MUFA = c-MUFA + t -MUFA;
Σ n-3 = sum of 18:3n-3 + 20:5n-3 + 22:5n-3 + 22:6n-3;
Σ n-6 = sum of 18:2n-6 + 20:2n-6 + 20:3n-6 + 20:4n-6 + 22:4n-6;
n-6/n-3 = (sum of 18:2n-6 + 20:2n-6 + 20:3n-6 + 20:4n-6 + 22:4n-6)/(sum of 18:3n-3 + 20:5n-3 + 22:5n-3 + 22:6n-3);
Σ PUFA = sum of 18:3n-3 + 18:2n-6 + 20:2n-6 + 20:5n-3 + 20:3n-6 + 20:4n-6 + 20:5n-3 + 22:4n-6 + 22:6n-3;
Σ t,t-CLA = sum of t 6,t8-18:2 + t 10, c12-18:2;
Σ c-/t-CLA = sum of t 12, c14-18:2 + c 9,t11-18:2;
Σ CLA = sum of t 6/t 8-18:2 + t 9,c11-18:2 + t 10,c12-18:2 + t 12,c14-18:2 + c9,t 11-18:2;
t 11-/t 10- = t 11-18:1/t 10-18:1 ratio;
SFA/PUFA ratio = (sum of 12:0 + 14:0 + 15:0 + 16:0 + 17:0 + 18:0 + 19:0 + 20:0)/(sum of 18:3n-3 + 18:2n-6 + 20:2n-6 + 20:5n-3 + 20:3n-6 + 20:4n-6 + 20:5n-3 + 22:4n-6 + 22:6n-3).
There were no differences (P > 0.05) in concentrations of individual, total t,t- and c,t-CLA in intramuscular fat across vitamin E treatments. The total CLA content in intramuscular fat, however, responded quadratically (P < 0.05) to vitamin E concentration with steers that received 340 and 1040 IU/day having the highest and lowest values, respectively (Table 3). Intramuscular fat proportions of total and individual n-3 and n-6 fatty acids, total PUFA, n-6/n-3 and SFA/PUFA ratios were unaffected (P > 0.05) by addition of vitamin E to the diet.
Discussion
For humans, high total trans fatty acid intake is associated with an increase in coronary heart disease (Oh et al., Reference Oh, Hu, Manson, Stampfer and Willett2005), and as such health authorities from several countries, including Canada, have recommended reductions in their intake, and have made labelling of total trans fatty acids in foods mandatory. Individual trans fatty acid isomers can, however, have differing effects and notably both t11-18:1 and rumenic acid have many potential health benefits mostly relating to their anticarcinogenic, immune modulatory and anti-inflammatory properties (Benjamin and Spener, Reference Benjamin and Spener2009; Field et al., Reference Field, Blewett, Proctor and Vine2009; Wang et al., Reference Wang, Jacome-Sosa and Proctor2012). Owing to increasing demand for health-promoting foods, developing strategies to produce beef products with low t10-18:1 but enriched with t11-18:1 is important for the beef industry. Overall, there are very few studies that have attempted to prevent the t10-18:1 shift in beef by incorporating vitamin E into finisher diets containing high levels of grain. Dietary fatty acid values in the present study are in accordance with trials where barley-based finisher diets have been fed (Dugan et al., Reference Dugan, Rolland, Aalhus, Aldai and Kramer2008; Nassu et al., Reference Nassu, Dugan, He, McAllister, Aalhus, Aldai and Kramer2011b) and are indicative of the relatively high 18:2n-6 content in barley grain. Although the concentration of vitamin E in the basal diet except for the protein supplement was not measured, Nassu et al. (Reference Nassu, Dugan, Juárez, Basarab, Baron and Aalhus2011a) via regression analysis estimated that it provided 770 IU of vitamin E/animal per day. It is important to take total basal level of vitamin E in the diet into account when considering vitamin E supplementation.
The result that t10-18:1 and t11-18:1 were the most abundant t18:1 isomers in subcutaneous and intramuscular fat is consistent with most available literature on conventionally fed beef (Kraft et al., Reference Kraft, Kramer, Schoene, Chambers and Jahreis2008; Alfaia et al., Reference Alfaia, Alves, Martins, Costa, Fontes, Lemos, Bessa and Prates2009; Aldai et al., Reference Aldai, Dugan, Kramer, Robertson, Juárez and Aalhus2010). The observed linear reductions in t6/t7/t8- and t10-18:1 and linear increase in t11-18:1 in subcutaneous fat with increasing levels of vitamin E agrees with earlier reports by Juárez et al. (Reference Juárez, Dugan, Aldai, Aalhus, Basarab, Baron and McAllister2010 and Reference Juárez, Dugan, Aalhus, Aldai, Basarab, Baron and McAllister2011). Similar observations were made in cattle plasma (Kay et al., Reference Kay, Roche, Kolver, Thomson and Baumgard2005) and milk (Kay et al., Reference Kay, Roche, Kolver, Thomson and Baumgard2005; Pottier et al., Reference Pottier, Focant, Debier, De Buysser, Goffe, Mignolet, Froidmont and Larondelle2006). The mode of action of vitamin E has not been clarified yet. Martin and Jenkins (Reference Martin and Jenkins2002) and Pottier et al. (Reference Pottier, Focant, Debier, De Buysser, Goffe, Mignolet, Froidmont and Larondelle2006), however, suggested that vitamin E might have inhibitory and stimulatory effects on the growth and function of bacteria that produce t10- and t11-18:1, respectively. Given that ruminal environmental stress is an important factor for the synthesis of trans fatty acids in the rumen (Härtig et al., Reference Härtig, Loffhagen and Harms2005), vitamin E may in some way alleviate this stress, although it may not be through its typical role as an anti-oxidant, given the highly reduced environment of the rumen.
Another mechanism of action of α-tocopherol could be linked to its structural resemblance to compounds such as α-tocopherolquinol and deoxy-α-tocopherolquinol, which act as endogenous electron donors in the biohydrogenation of rumenic acid to t11-18:1 (Hughes and Tove, Reference Hughes and Tove1980a and Reference Hughes and Tove1980b), thus increasing the synthesis of fatty acids by this pathway. In this regard, it has been suggested that vitamin E can act as an electron donor to restore α-tocopherolquinol and deoxy-α-tocopherolquinol or act in place of the electron donors to provide the electrons for the reduction of the cis bond of the conjugated diene or get metabolised to these donors by microorganisms in the rumen (Pottier et al., Reference Pottier, Focant, Debier, De Buysser, Goffe, Mignolet, Froidmont and Larondelle2006). These explanations suggest that the modes of action of vitamin E could be multiple and variable. More research is, therefore, suggested to ascertain the mechanism(s) by which dietary vitamin E influences biohydrogenation pathways from PUFA to t18:1 isomers, and also from t18:1 isomers to 18:0 (stearic acid).
The degree of response of t10- and t11-18:1 to vitamin E in subcutaneous fat was low in magnitude compared with results obtained by Juárez et al. (Reference Juárez, Dugan, Aldai, Aalhus, Basarab, Baron and McAllister2010), and at no time did t11-18:1 exceed 32% of t10-18:1. As the highest rate of vitamin E supplementation in the current study was about 700 IU more than that used by Juárez et al. (Reference Juárez, Dugan, Aldai, Aalhus, Basarab, Baron and McAllister2010) and fed for a longer period (120 v. 90 days), marked responses in t18:1 isomers were anticipated. The inconsistency in these results could, however, be attributed to differences in the type of forage used in the basal diet (barley silage v. alfalfa/brome hay) for these trials. Feeding flaxseed with hay led to greater accumulations of t18:1 isomers in plasma (He et al., Reference He, Chung, McAllister, Beauchemin, Mir, Aalhus and Dugan2011), backfat and muscle (Nassu et al., Reference Nassu, Dugan, He, McAllister, Aalhus, Aldai and Kramer2011b) of cattle than feeding flaxseed with barley silage. Kong et al. (Reference Kong, He, McAlister, Seviour and Forster2010) also reported dissimilarities in rumen microbial communities between cull cows fed a hay-based diet and those fed a silage-based diet. Such differences in endogenous microbial communities, which may be in part related to forage borne microbes, as well as alterations in endogenous ruminal microbes could be responsible for changing ruminal biohydrogenation of trans fatty acids. In addition, as compared with hay, ensiling may enhance lipolysis (Daley et al., Reference Daley, Abbot, Doyle, Nader and Larson2010), degrade antioxidants and alter plant secondary compounds in the forage, factors that could also modify the biohydrogenation activity of rumen bacteria (Bagheripour et al., Reference Bagheripour, Rouzbehan and Alipour2008). Substituting barley silage with grass hay in the basal diet might, therefore, be a valuable tool in preventing t10-18:1 shift and investigation into different forage types merit further investigation.
The observation that t11-/t10-18:1 ratio in subcutaneous fat increased linearly with vitamin E supplementation could imply that inclusion of vitamin E in high-concentrate rations is a potential strategy to improve beef healthfulness from a human nutrition perspective. The t11-/t10-18:1 ratio reflects the relative flow of PUFA through the major biohydrogenation pathways (i.e. t10- or t11-18:1) with a higher ratio being regarded as healthier for consumers than a lower ratio (Aldai et al., Reference Aldai, Dugan, Kramer, Robertson, Juárez and Aalhus2010).
The finding that vitamin E did not influence total t18:1 in subcutaneous and intramuscular fat disagrees with earlier work (Juárez et al., Reference Juárez, Dugan, Aldai, Aalhus, Basarab, Baron and McAllister2010 and Reference Juárez, Dugan, Aalhus, Aldai, Basarab, Baron and McAllister2011) where addition of vitamin E to the control diet decreased total t18:1. The contrast may also be related to differences in the forage component of the basal diet used in these trials. Potentially the positive and negative changes in individual t18:1 isomers observed in the current study were either equal or not high enough to elicit changes in total t18:1.
In Canada, beef is currently exempted from trans labelling based on the assumption that it contains relatively high amounts of t11-18:1 and rumenic acid (Health Canada, 2006). In the current study, average values for total t18:1, t10-18:1 and t11-18:1 per serving in regular ground beef (70% lean, 30% subcutaneous fat) would be 0.96, 0.53 and 0.14 g per 100 g of serving compared with 0.12, 0.062 and 0.017 g per 100 g of serving, respectively for lean steak. Thus, the total t18:1 content for regular ground beef would be greater than the current labelling requirements of 0.2 g per 100 g of serving) in Canada (Health Canada, 2006). It is also important to note that, on average, t10-18:1 and t11-18:1 would constitute about 52% and 15% of total t18:1, respectively, in both regular ground beef and lean steak. Current results also indicate that feeding a high barley-grain diet like most concentrate-based diets (Dugan et al., Reference Dugan, Kramer, Robertson, Meadus, Aldai and Rolland2007; Kraft et al., Reference Kraft, Kramer, Schoene, Chambers and Jahreis2008; Leheska et al., Reference Leheska, Thompson, Howe, Hentges, Boyce, Brooks, Shriver, Hoover and Miller2008) increased levels of trans fatty acids other than t11-18:1 in beef compared with high-forage diets. In this context, it could, therefore, be important to re-examine the exclusion of t18:1 isomers from compulsory labelling of trans fatty acids in ruminant-derived foods. It also highlights the need for studying effects of individual t18:1 isomers, as their health effects in humans may differ significantly.
The lack of effect of vitamin E observed for cis-MUFA and total MUFA in the present experiment is in line with earlier studies in cattle (Juárez et al., Reference Juárez, Dugan, Aalhus, Aldai, Basarab, Baron and McAllister2011) and sheep (Chen et al., Reference Chen, Mao, Lin and Liu2008). The negative linear trend observed between SFA and vitamin E supplementation in subcutaneous fat concurs with previous findings where feeding vitamin E and soybean oil (Chen et al., Reference Chen, Mao, Lin and Liu2008) or corn oil (Chen et al., Reference Chen, Mao, Ma and Liu2010) decreased total SFA in longissimus muscle of sheep. These results may be explained by the antioxidant effects of vitamin E on desaturase enzyme activity involved during de novo biosynthesis of fatty acids (Chen et al., Reference Chen, Mao, Lin and Liu2008 and Reference Chen, Mao, Ma and Liu2010). Inclusion of vitamin E has been reported to increase Δ9- and Δ6-desaturase activity and consequently alter fatty acid profiles in rodents liver tissues (Özkan et al., Reference Özkan, Yilmaz, Öztürk and Ersan2005). Assessment of the effects of vitamin E supplementation on activity of lipogenic enzymes in ruminants could, therefore, be worth exploring.
In accordance with current results, Juárez et al. (Reference Juárez, Dugan, Aalhus, Aldai, Basarab, Baron and McAllister2011) found that the inclusion of vitamin E supplementation had no influence on key individual CLAs in subcutaneous and intramuscular fats. It is important to note that c9,t11-18:2 and t11-18:1 in subcutaneous fat followed similar numerical linear trends, verifying the prominent precursor–product relationship reported between these two fatty acids (Griinari et al., Reference Griinari, Corl, Lacy, Chouinard, Nurmela and Bauman2000; Daley et al., Reference Daley, Abbot, Doyle, Nader and Larson2010). The finding that the percentage of total CLA in intramuscular fat was quadratically related to vitamin E concentration is difficult to explain, as no linear or quadratic effects were found for individual CLA isomers. According to Chen et al. (Reference Chen, Mao, Ma and Liu2010), adding vitamin E and corn oil to the diet increased concentrations of t11-18:1, c9,t11-18:2 and total CLA in the intramuscular fat of sheep.
The observation that inclusion of vitamin E did not affect the level of individual and total n-3 fatty acids in subcutaneous fat agrees with Juárez et al. (Reference Juárez, Dugan, Aalhus, Aldai, Basarab, Baron and McAllister2011). Juárez et al. (Reference Juárez, Dugan, Aalhus, Aldai, Basarab, Baron and McAllister2011), however, observed that feeding vitamin E plus flaxseed increased levels of 18:3n-3. Overall, literature suggests that vitamin E modifies the biohydrogenation of CLA and n-3 fatty acids when combined with PUFA-rich dietary sources (Chen et al., Reference Chen, Mao, Lin and Liu2008 and Reference Chen, Mao, Ma and Liu2010; Juárez et al., Reference Juárez, Dugan, Aalhus, Aldai, Basarab, Baron and McAllister2011). In this view, it might also be important to evaluate the effect of combining high levels of vitamin E with other rumen biohydrogenation modifiers such as buffers (Aldai et al., Reference Aldai, Dugan, Kramer, Robertson, Juárez and Aalhus2010), dried distillers grains plus solubles (Dugan et al., Reference Dugan, Aldai, Kramer, Gibb, Juárez and McAllister2010) and plant secondary compounds (e.g. tannins (Vasta et al., Reference Vasta, Makkar, Mele and Priolo2009) and saponins (Brogna et al., Reference Brogna, Nasri, Salem, Mele, Serra, Bella, Priolo, Makkar and Vasta2011)), which have been shown to avert the t10-18:1 shift and improve CLA and n-3 fatty acid profiles in meat.
The observed decline in total n-6 with increasing vitamin E supplementation may be due to the observed decrease in 20:3n-6 in subcutaneous fat as vitamin E levels increased. Speculatively, these results might mean that vitamin E actually promotes the first step in n-6 fatty acid biohydrogenation or utilisation of 20:3n-6 increases with increasing amounts of dietary vitamin E. However, changes in n-6 fatty acids were less than 0.3% of total fatty acids. A quadratic response in the n-6:n-3 ratio was also found with increasing vitamin E supplementation and 18:2n-6 showed a similar numeric trend, however, an explanation for this is not immediately apparent. Overall, the responses of n-6 fatty acids in subcutaneous fat to increasing vitamin E levels did not provoke changes in total PUFA across vitamin E treatments. Similarly, Juárez et al. (Reference Juárez, Dugan, Aalhus, Aldai, Basarab, Baron and McAllister2011) found that vitamin E had no effect on total PUFA. In contrast to these results, Chen et al. (Reference Chen, Mao, Lin and Liu2008 and Reference Chen, Mao, Ma and Liu2010) reported that sheep supplemented with vitamin E and an oil source had higher total PUFA above that observed with oil alone. This suggests that combining vitamin E and an oil might elevate PUFA levels in beef fed high-concentrate diets.
The observation that addition of vitamin E to the diet had little effect on the fatty acid composition of intramuscular fat compared with subcutaneous fat could be a consequence of differences in sensitivity to dietary changes between the two tissues. Subcutaneous adipose tissue is relatively more sensitive to changes in diet and rumen function compared with muscle (Dugan et al., Reference Dugan, Rolland, Aalhus, Aldai and Kramer2008). This is because subcutaneous fat has a high proportion of neutral lipids that accumulate greater levels of PUFA biohydrogenation products relative to polar lipids (Fritsche et al., Reference Fritsche, Rumsey, Yurawecz, Ku and Fritsche2001; Nuernberg et al., Reference Nuernberg, Nuernberg, Ender, Dannenberger, Schabbel, Grumbach, Zupp and Steinhart2005).
Conclusions
Supplementation of vitamin E in finisher diets containing barley grain and silage as a basal diet has some potential to limit t10-18:1 deposition and promote a healthier balance between t11- and t10-18:1 in subcutaneous fat. Practical recommendations will, however, need to take into account dietary concentration of vitamin E, forage type, forage-to-concentrate ratio, presence of other rumen biohydrogenation modifiers, differences in tissues, cost of supplementation and the economic benefit under each production circumstance.
Acknowledgements
Authors are indebted to the Alberta Meat and Livestock Agency (ALMA) for financing the current research. Special thanks go to the AAFC–Lacombe Research Centre Beef Unit staff, meat processing staff and the meat quality technical team for their skilled assistance with this project. Drs C. Mapiye and T. Turner gratefully acknowledge the receipt of NSERC fellowships funded through ALMA. Dr N. Aldai thanks the Spanish Ministry of Science and Innovation for the contract through the ‘Ramón y Cajal (RYC-2011-08593)’ program.