INTRODUCTION
The majority of calories derived from monocots in the human diet come from grasses, which are increasingly used as a sustainable source of energy (Brkljacic et al. Reference Brkljacic, Grotewold, Scholl, Mockler, Garvin, Vain, Brutnell, Sibout, Bevan, Budak, Caicedo, Gao, Gu, Hazen, Holt, Hong, Jordan, Manzaneda, Mitchell-Olds, Mochida, Mur, Park, Sedbrook, Watt, Zheng and Vogel2011). Moreover, they serve as forage crops and provide several desirable genes contributing to elucidation of the complex molecular mechanisms of environmental stress tolerance and the improvement of domesticated grasses (Jauhar Reference Jauhar2006; Qi et al. Reference Qi, Friebe, Zhang and Gill2007; Trethowan & Mujeeb-Kazi Reference Trethowan and Mujeeb-Kazi2008). As a wild grass not directly under human selection, Brachypodium might provide some insight into these processes. Thus, significant investment has been made in developing and using Brachypodium distachyon as a model for temperate cereal and grass crops. In this context, it is noteworthy that B. distachyon is a ‘typical’ grass at the genome level, as reflected by the overall similarity in gene content and gene families when compared with rice and sorghum (Sorghum bicolor) genomes (IBI 2010).
This wild Poaceae has many qualities that make it an excellent model organism. It has a small genome (recently sequenced c. 300 Mbp for B. distachyon; IBI 2010), a rapid generation cycle under optimized conditions (8–12 weeks), does not grow very tall (20–30 cm) at high planting densities, requires few demanding growth resources and shows good environmental adaptation (Vogel et al. Reference Vogel, Tuna, Budak, Huo, Gu and Steinwand2009). In addition to its inherent attributes, a number of resources have been recently developed to facilitate the use of B. distachyon and its two relatives, Brachypodium stacei and Brachypodium hybridum, as model species (Catalán et al. Reference Catalán, Müller, Hasterok, Jenkins, Mur, Langdon, Betekhtin, Siwinska, Pimentel and López-Alvarez2012). These three species are native to the Mediterranean region but only B. hybridum is known (to date) as an alien species in other regions (e.g. California, Australia, South America and South Africa) (López-Alvarez et al. Reference López-Alvarez, López-Herranz, Betekhtin and Catalán2012). Brachypodium distachyon is common in Mediterranean-type habitats on many mainly dry soil types and also grows on cultivated fields (Pacurar Reference Pacurar2009). This distribution indicates that it is a generalist plant. Thus, it has been used to protect rural soils from erosion, especially in slope areas where water runoff, wind and other agents cause soil loss (Hammami et al. Reference Hammami, Jouve, Cuadrado, Soler and Gonzalez2011). The allotetraploid B. hybridum is derived from the natural inter-specific hybridization between B. distachyon (2n=10) and B. stacei (2n=20). It has a base chromosome number of n=15 (10+5) and a genome size of 1·265 pg/2C, resulting from the sum of the genomes of the two progenitors (B. distachyon 0·631 pg/2C, B. stacei 0·564 pg/2C) (López-Alvarez et al. Reference López-Alvarez, López-Herranz, Betekhtin and Catalán2012). In Tunisia, B. hybridum is distributed in a large range of climatic conditions. In some areas, it forms mixed populations with other wild Poaceae and even other species of Brachypodium such as B. distachyon, B. stacei and B. retusum, more rarely with B. phoenicoides, but is not sympatric (or very infrequently) with B. sylvaticum and B. pinnatum s.l. However, up to now there appears to be no detailed studies and also no information available on patterns of genetic variation within and among Brachypodium germplasm in Africa.
The current work analysed the pheno-morphologic diversity of wide sampling natural populations of B. hybridum in relation to bioclimatic factors.
MATERIALS AND METHODS
Collection and sampling
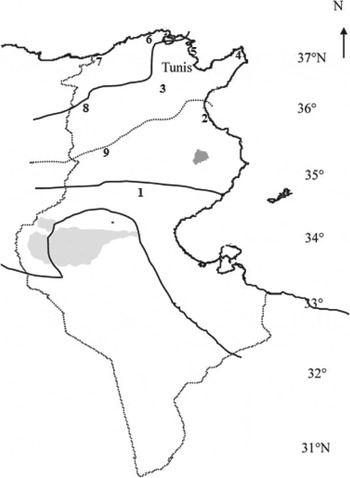
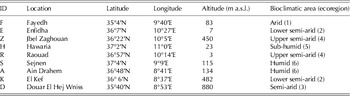
The current work was initiated in 2010 by a survey of the Tunisia territory and localization of the populations of B. hybridum by Global Positioning System (GPS). The objective of the survey was to ensure inclusion of populations’ representative of all the bioclimatic stages in Tunisia (Fig. 1). The characteristics of selected sites are detailed in Table 1. At each location, about 20 mother plants (family: descendants of the same selfed plant) were collected randomly from each population. The neighbouring samples were at least 10 m apart to avoid sampling bias from related lines. Distances between populations were at least 35 km.
Tunisian populations of Brachypodium hybridum and their bioclimatic regions: 1, Fayedh (arid); 2, Enfidha (lower semi-arid); 3, Jbel Zaghouan (upper semi-arid); 4, Hawaria (sub-humid); 5, Raouad (upper semi-arid); 6, Sejnen (humid); 7, Ain Drahem (humid); 8, El Kef (lower semi-arid); 9, Douar El Hej Wniss (semi-arid). Shaded areas indicate saline lagoons (chott) and salt flats (sebkha) in Tunisia.

Characteristics of sites of origin of the studied Tunisian Brachypodium hybridum populations

Pheno-morphological characterization under greenhouse conditions
The experiment was conducted under greenhouse conditions at the Centre of Biotechnology, Borj-Cedria, Tunisia and consisted of 145 families (lines) of B. hybridum collected across the nine populations sampled. Four seeds from each family were germinated and cultivated in plastic pots until maturity. Eighteen quantitative traits considered as descriptors for wild Poaceae were measured on 580 individuals representing the 145 families (four replicates from each family). Eleven of these were related to vegetative growth: days to second leaf emergence (D2L), number of tillers (NT), length of the main tiller (LGT), mass of the aerial part (MAP), average length of tillers (ALT), average leaf length (ALL), average number of nodes per tiller (ANNT), average internode distance (AID), number of leaves per tiller (NLT), root length (RT) and the length of the smallest tiller (LST). The remaining traits were related to reproduction or seed production: mass of spikelets (MS), average length of spikelet (ALS), average distance between spikelets (ADBS), average number of spikelets per inflorescence (ANSI), heading date (DH), average length of inflorescence (ALI) and average number of seeds per spikelet (ANSS).
Data analysis
Data collected from all morphological traits were subjected to varied statistical analyses using SPSS v.16: descriptive analysis, analysis of variance (ANOVA) and Pearson correlations between variables and climate regions. Along a gradient of increasing humidity, the bioclimatic regions were scored from 1 for arid to 6 for humid (Table 1). The structure of variation in phenotypic traits was analysed after running nested ANOVA, including population and family (nested within population) as a random effect using SPSS v.16. For altitudinal effect, the collection was subdivided into three classes of altitude (class 1: 0–80 m, class 2: 80–400 m and class 3: >400 m) (Table 1). Component of variance allowed estimations of population subdivisions (Q ST) as Q ST=(1+f) V AP/((1+f) V AP+2 V G) under the assumption of no dominance and epistasis (Spitze Reference Spitze1993; Morgan et al. Reference Morgan, Hicks, Spitze, Latta, Pfrender, Weaver, Ottone and Lynch2001), where V AP is the among-population variance component, V G is the intra-populations variance component and f is the coefficient of consanguinity. Since B. hybridum is a predominant autogamous species, f was assumed to be 1 and Q ST was simplified as V AP/V AP+V G.
For each population, the same model of ANOVA was performed to subdivide the within-population variance into among-family variance and within-family variance. These components were used to estimate the broad sense heritability (H 2) as H 2=V G/V WP=V G/(V G+V E), where V G was the genetic variance between families and V E was the environmental effect.
The standardized traits mean values were used to perform Principal Component Analysis (PCA) and a two-dimensional scatter plot was produced in order to study the grouping among studied lines (families). Based on Ward's method for the clustering algorithm, morpho-phenologic measurements were used to generate an unweighted pair group method with arithmetic mean (UPGMA) dendrogram based on Euclidean distances to illustrate the relatedness between lines (families). The Mantel test was performed in order to test the correlation between genetic and geographical distances among populations (Mantel Reference Mantel1967). Principal Component Analysis, cluster analysis and Mantel correlations tests were generated by the 13th version of XLSTAT software.
RESULTS
Morpho-phenologic variation
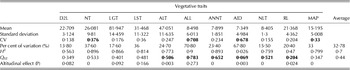
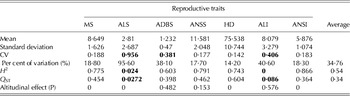
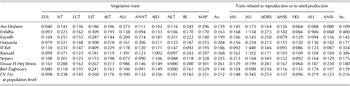
Analysis of variance, estimated as coefficient of variation (CV), showed significant variations between the 145 studied lines representing the nine populations: results are summarized in Tables 2 and 3. The CV estimated for morphological characters varies across the 145 lines and indicates variance patterns; it was slightly higher for reproductive traits (34·8%) than for vegetative traits (32·8%). It is worth noting that, at the species level, spikelet length was the most variable (95·6%), followed by ALL, AID and ALSL with CV ranging from 40·6 to 70·8%. The remaining traits showed narrow variation which did not exceed 0·4. The least amount of variation was observed for the days to the second leaf emergence (CV=0·138).
Mean values, standard deviation, coefficient of variation, % of variation, Heritability (H2), coefficient of morphologic diversity (QST) and altitudinal effect (class 1: from 0 to 80 m, class 2: from 80 to 400 m and class 3: >400 m) on the vegetative traits (days to the second leaf emergence (D2L), number of tillers (NT), length of the greater tiller (LGT), mass of the aerial part (MAP), average length of tillers (ALT), average length of leaves (ALL), average number of nodes per tiller (ANNT), average internodes distance (AID), number of leaves per tiller (NLT), root length (RT) and the length of the smallest tiller (LST)) of Brachypodium hybridum samples from Tunisia

Mean values, standard deviation, coefficient of variation, % of variation, Heritability (H2), coefficient of morphologic diversity (QST) and altitudinal effect (class 1: from 0 to 80 m, class 2: from 80 to 400 m and class 3: >400 m) on the reproductive traits (mass of spikelets (MS), average length of spikelet (ALS), average distance between spikelets (ADBS), average number of spikelets per inflorescence (ANSI), heading date (DH), average length of inflorescence (ALI) and average number of seeds per spikelet (ANSS)) of Brachypodium hybridum samples from Tunisia

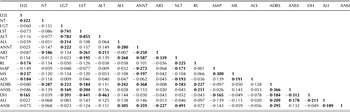
At the population level, most traits showed a broad range of variation among populations except for the ALL and the average of internode distances, which showed a wide range of variation between populations (from 7·3 and 10·2% in Ain Draham to 139·1 and 110·6% in Sejnen, respectively) and for the ALI, which varied between 9·3% in Jbel Zagouan and 144% in El Kef (Table 4).The same results were obtained for all traits in the studied ecoregions. The majority of traits showed high heritability (>0·3) with lowest border value for ALS and a mean value across traits of 0·64. Traits which showed highest heritability were: NT (0·89), LGT (0·86), LST (0·81), ALT (0·77), ANNT (0·89), NLT, (0·75), MAP (0·79), MS (0·77), ANSS (0·79), DH (0·74) and ANSI, (0·86). Overall, high values of heritability were observed for most vegetative descriptors (average of 0·7) and low values for reproductive ones (average of 0·54). The average heritability of all the quantitative traits was 0·64, which indicates that a large proportion of the phenotypic variance (0·64) was conserved from generation to generation. Pearson's correlation coefficients for agro-morphological traits showed that the most significant and negative correlations were between the DH and the majority of traits related to plant height (LGT, LST, ALT, ALI and ADBS) and biomass production (MAP and ANSS), whereas the most positive and significant correlations were among traits related to plant height and tiller and inflorescence length: LST–ALT (r=0·855, P<0·001), LGT–ALT (r=0·782, P<0·001), LGT–LST (r=0·74, P<0·001), ANNT–NLT (r=0·587, P<0·001), ANNSI–NLT (r=0·491, P<0·001), ANNT–ADBS (r=0·368, P<0·001), ANSS–ADBS (r=0·366, P<0·001), ANSIANNT (r=0·359, P<0·001) NT–D2L (r=0·322, P<0·001) and MS–MAP (r=0·300, P<0·001) (Table 5) which indicate that different plant organs grow synchronously and that NLT is indicative of the number of spikelets per inflorescence.
Coefficients of variation for all the characters analysed in each population

Av., average.
Pearson correlations between the 18 traits analysed. Values in bold type are significant at P=0·05

Structure of morpho-phenologic variation
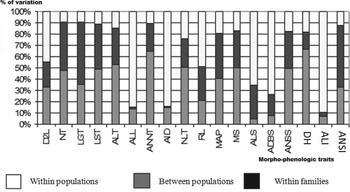
Nested ANOVA showed that, for most characters, within-population variance was greater than that among populations. In fact, ALT, ANNT and DH were dominated by the inter-populations component (>0·50 of the total variation). NT, LST, NLT, MS and ANSS showed equal levels of intra- and inter-population variations. The remaining traits were dominated by the intra-population component (Fig. 2).
Hierarchical decomposition of total phenotypic variance components (%) for all morpho-phenological traits derived from nested ANOVA (between populations, within populations and within families) in Brachypodium hybridum.

Inter-population variation
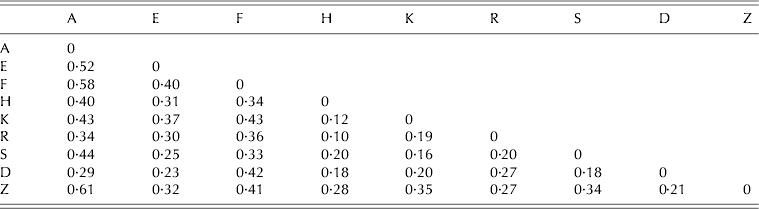
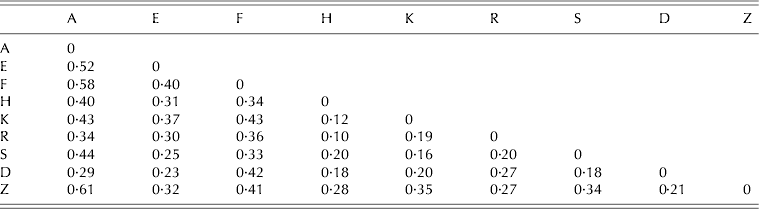
Analysis of population and family-within-population variation shows that both population and family have a significant effect for almost all measured traits (P<0·001). The components of variance were used to estimate the inter-populations differentiation (Q ST), which varied according to measured traits ranging from 0·027 for ALS to 0·78 for ALL with an average of 0·402 (Tables 2 and 3). Pairwise Q ST showed that the highest differentiation among populations was registered between Ain Draham and Jbel Zaghouan (0·61) and the smallest was between Haouria and Raoued (Q ST=0·1). Overall, Ain Draham differentiated most from the rest of populations (Table 6).
Matrix of QST for each pairwise combination of Brachypodium hybridum populations (F, Fayedh; K, El Kef; R, Raouad; H, Hawaria; E, Enfidha; Z, Jbel Zaghouan; D, Douar El Hej Wniss; S, Sejnen; A, Ain Drahem)
Altitudinal variation
Although nested ANOVA (population within altitude classes) indicated statistically significant variation between classes for 11 traits (Tables 2 and 3), decomposition of variance showed that altitude explains a part of total variation for only MS, MAP and ANNT. These traits should be considered the most affected by altitude in B. hybridum.
Principal component analysis
The 18 morphological characters were subjected to PCA. The first three components, with Eigenvalues greater than unity, explained 0·47 of the total variation among populations for the 18 quantitative traits.
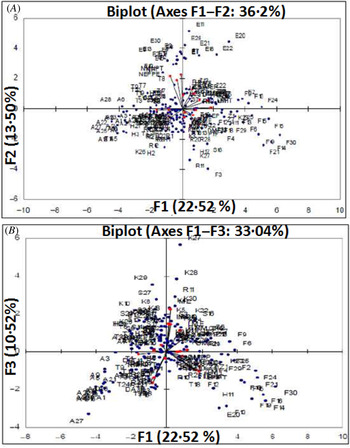
The relative magnitude of Eigenvectors from the first component (0·23) indicated that LGT, LST, ALT, ANSS, ADBS and DH were the most important characters. In the second component (0·14), predominant characters were ALL, ANNT, NLT and ANSI, while the third component (0·11) described variation in characters that were related to speed of growth (D2L) and biomass (MS). The second factor reflected the traits of vegetative organs, while the first and the third factors reflected the traits of reproductive organs. The two-dimensional plots of PCA showing the overall morphological variation of the 145 B. hybridum lines are depicted in Fig. 3. The PCA plots show that the lines originating from Enfidha, Fayedh and Ain Draham form three different groups, while the other lines are found in an extensive overlap around the origin, which suggests that these three populations display the highest levels of variation. The minimal separation among the three groups was due mainly to the first and second components. These results were confirmed by a PCA analysing the variation among populations. Based on PCA analysis for populations, Fayadh (0·77), Enfidha (0·70) and Ain Draham (0·62) were the most morphologically variable populations, whereas Jbel Zaghouan (0·06) was the population with the smallest cumulative variance.
Principal component analysis of the studied Brachypodium hybridum lines (A, axes 1 and 2; B, axes 1 and 3).

Cluster analysis
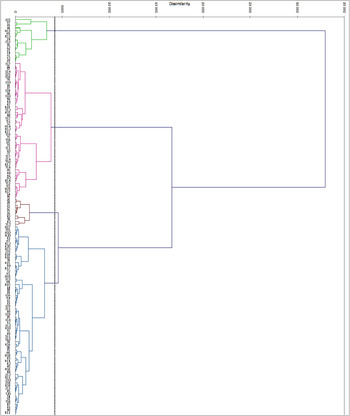
On the basis of Euclidean distances, the hierarchical cluster analysis was used to examine the aggregation patterns of 145 Brachypodium lines. Three UPGMA dendrograms were generated; the first was based on the morphological dissimilarity of the vegetative traits, the second on the dissimilarity of the reproductive traits and the third included all the morphological data. The three dendrograms showed similar patterns of clustering. In fact, the 145 lines fell into three heterogeneous groups without any clear geographically dependent pattern (Fig. 4). By analysing vegetative traits alone, the lines originating from Enfidha and Jbel Zaghouan were clustered together in the first group, the second group clustered lines originating from Raoued, Douar El Hej Wniss, Sejnen, Haouaria and El Kef, whereas Ain Draham and Fayedh lines were set apart in cluster 3. When analysing reproductive traits alone, the same tendency of clustering was found as that obtained using vegetative traits, except for lines originating from Sejnen which clustered with those originating from Enfidha and Zaghouan.
Cluster analysis of the 145 studied lines based on Euclidean distances (all the morphological data (vegetative and reproductive traits)).

The non-relatedness between the morphological variation and geographic distances was confirmed by a Mantel test, which revealed a positive, but not significant, relationship between among-population phenotypic differentiation (Q ST) and geographic distance. Moreover, the correlation analysis of population phenotypic diversity and altitude showed a significant negative relationship (r=−0·262, P<0·05).
DISCUSSION
Morpho-phenologic variation
One hundred and forty-five Tunisian Brachypodium hybridum lines, collected from nine locations representing six ecoregions and various altitudes in the north and the centre of the country, were used to analyse phenotypic diversity. Eighteen morpho-phenological characters were used to generate valuable information on the studied traits, on the natural populations and ecoregions and altitude.
The current study detected substantial variation and important heterogeneity for populations and ecoregions based on vegetative and reproductive traits. These variations were essentially related to plant vigour, biomass and seed production, suggesting that the structure of quantitative traits in natural Tunisian B. hybridum populations was influenced by environmental factors so that the degree of trait variation differs according to the region where seeds were collected. This agrees with previous studies which showed that the closely related diploid species B. distachyon was morphologically highly variable (Draper et al. Reference Draper, Mur, Jenkins, Ghosh-Biswas, Bablak, Hasterok and Routledge2001; Filiz et al. Reference Filiz, Ozdemir, Budak, Vogel, Tuna and Budak2009; Vogel et al. Reference Vogel, Tuna, Budak, Huo, Gu and Steinwand2009; Schwartz et al. Reference Schwartz, Doyle, Manzaneda, Rey, Mitchell-Olds and Amasino2010; Jaroszewicz et al. Reference Jaroszewicz, Kosina and Stankiewicz2012). Jaroszewicz et al. (Reference Jaroszewicz, Kosina and Stankiewicz2012) found a high morphological variation not only in quantitative traits but also in some developmental characteristics, such as the fragility of the spikelet rachis, the hairiness of the lemma and the accumulation of assimilates in the endosperm. The observed variation was not homogeneous across populations and characters in the B. hybridum lines of the current study. For instance, lines from Fayedh and Jbel Zaghouan were highly variable for plant height, leaf length and phenological traits while those from Sejnen were significantly different for biomass and grain yield. This finding is in agreement with many works concerning Poaceae species (Ketema Reference Ketema1993; Assefa et al. Reference Assefa, Ketema, Tefera, Nguyen, Blum, Ayele, Bai, Simane and Kefyalew1999, Reference Assefa, Tefera, Merker, Kefyalew and Hundera2001, Reference Assefa, Merker and Tefera2003; Tefera et al. Reference Tefera, Assefa, Hundera, Kefyalew and Teferra2003; Chanyalew et al. Reference Chanyalew, Tefera and Singh2009).
Estimates of variance components among populations showed that genetic variance was higher than environmental variance and consequently had a relatively high average of heritability. Generally the heritability pattern showed high estimates for most traits, which are important from the farmer's point of view in regions suitable for agricultural production and diversified culture. When characters related to biomass production are considered (i.e. the greatest variation was recorded for tillers and leaves, and the smallest for seeds), the current results suggest that the reproductive organs are the stable characters, and the vegetative organs were significantly affected by local conditions such as climate and soil. This agrees with the high level of heritability for agro-morphological traits recorded in the model grass Oryza sativa L. (Fahliani et al. Reference Fahliani, Khodambashi and Houshmand2010; Nascimento et al. Reference Nascimento, Silva and Veasey2011). Significant variation with respect to different altitude classes in Tunisian B. hybridum and high heritability for MS, MAP and ANNT indicated the presence of substantial variation in the germplasm and a possibility of selection response in these traits. The same result was reported for days to heading in barley (Esparza-Martínez & Foster Reference Esparza-Martínez and Foster1998).
Decomposition of variation among and within population indicated that on average 0·40 of the differentiation was recorded among populations and 0·60 within populations. Such a result is expected with regard to the autogamous breeding system of B. distachyon s.l and confirms the lack of inter-crossing pollination (Vogel et al. Reference Vogel, Tuna, Budak, Huo, Gu and Steinwand2009). This finding does not agree with that presented by Filiz et al. (Reference Filiz, Ozdemir, Budak, Vogel, Tuna and Budak2009) using AFLP markers and Turkish natural populations of B. distachyon but is in accordance with that found by Mahjoub et al. (Reference Mahjoub, Mguis, Rouaissi, Abdellaoui and Ben Brahim2012) in Tunisian natural populations of Aegilops geniculata Roth (Poaceae) using RAPD markers (0·80 of within-population variation) and Ehtemam et al. (Reference Ehtemam, Rahiminejad, Saeidi, Sayed Tabatabaei, Krattinger and Keller2009) in Triticum species in Iran. The high level of within-population diversity could be also explained by fluctuations in macroclimate parameters. In Tunisia, climate is characterized by considerable changes in temperature, rainfall distribution and soil moisture (Zribi et al. Reference Zribi, Anguela, Duchemin, Lili, Wagner, Hasenauer and Chehbouni2010). This finding was corroborated by a Mantel test, which showed no significant correlation between population morphological differentiation (Q ST) and geographical distances. The observed results are comparable to the previous findings of Filiz et al. (Reference Filiz, Ozdemir, Budak, Vogel, Tuna and Budak2009), based on AFLP genotyping of 1500 individual B. distachyon plants, Vogel et al. (Reference Vogel, Tuna, Budak, Huo, Gu and Steinwand2009) based on phenotypic characterization and SSR genotyping of 187 lines from 56 Turkish B. distachon locations and Jaroszewicz et al. (Reference Jaroszewicz, Kosina and Stankiewicz2012) based on B. disachyon sl morphological traits and RAPD markers.
The current study showed that the pheno-morphological and agronomic traits used are useful tools for genotyping natural population of B. hybridum and identifying the most important descriptors for detecting variation both among and within populations.