I. INTRODUCTION
Nanoporous metals (Au, Ag, Cu, Fe, Co, Ni, Pd, Pt, and Ti)Reference Cox and Dunand1–Reference Li, Misra, Baldwin and Picraux8 have numerous potential applications as functional materials, including sensors,Reference Kafi, Ahmadalinezhad, Wang, Thomas and Chen9,Reference Ding and Chen10 actuators,Reference Biener, Wittstock, Zepeda-Ruiz, Biener, Zielasek, Kramer, Viswanath, Weissmuller, Baumer and Hamza11 super-capacitors,Reference Lang, Hirata, Fujita and Chen12 catalytic substrates,Reference Wittstock, Zielasek, Biener, Friend and Baumer13 and anode substrates for Li-ion battery.Reference Yu, Gu, Lang, Zhu, Fujita, Chen and Maier14 As has been recently demonstrated,Reference Wada, Yubuta, Inoue and Kato7 nanoporous titanium can be fabricated by a novel two-step process involving a phase separation in an amorphous Cu–Ti alloy in molten Mg, followed by acid etching at ambient temperature. This method can be further applied to fabricate nanoporous β-Ti–Cr–Zr alloy with Ti, which is mechanically superior to pure α-Ti.Reference Wada, Setyawan, Yubuta and Kato15 When immersing a Cu–Ti alloy with small Zr and Cr additions, Cu80(Ti0.847Cr0.098 Zr0.056)20, into a Mg melt at 810 °C, Mg selectively alloys with Cu, while the remaining Ti–Cr–Zr phase separates into a solid skeleton with sub-micron strut size. Therefore, an Mg–Cu/Ti–Cr–Zr composite was formed as a bi-continuous structure. After solidification of the Mg–Cu phase, that phase can be removed from the composite in nitric acid at ambient temperature leaving a nanoporous Ti–Cr–Zr foam with nanosize ligaments and pores.
As the size of the metallic ligaments and the pores affects the mechanical and electrical properties of nano- and micro-porous structure,Reference Mathur and Erlebacher16,Reference Seker, Gaskins, Bart-Smith, Zhu, Reed, Zangari, Kelly and Begley17 it is expected that these properties can be optimized by changing the Mg exposure time leading to a coarsening of the Ti–Cr–Zr skeleton. Therefore, we study here arc-melted Cu–Ti–Cr–Zr samples which were alloyed with Mg by immersion in an Mg melt for 5, 10, or 30 min. Both the as-solidified composites (Mg–Cu/Ti–Cr–Zr) and the leached Ti–Cr–Zr sub-micron foams are imaged in 3D using micro-CTReference Youssef, Maire and Gaertner18 and high-resolution nano-tomography.Reference Wang, Chen, Yuan, Tkachuk, Erdonmez, Hornberger and Feser19
II. METHODS
A. Ti-foam fabrication
Six Cu–Ti–Cr–Zr samples with composition Cu80(Ti0.847Cr0.098Zr0.056)20 were prepared by arc-melting, as described in more detail elsewhere.Reference Wada, Setyawan, Yubuta and Kato15 Three Cu–Ti–Cr–Zr samples (8 mm in diameter and 1 mm in thickness) were immersed in an Mg melt at 810 °C for 5, 10, and 30 min respectively. The resulting phase-separated Mg–Cu/Ti–Cr–Zr composites will be labeled in this paper as C5, C10, and C30, where C stands for composite and the numbers stand for the Mg exposure times. Three etched foams were created by immersing another three as-prepared composite samples into nitric acid at 3 mol/L for 30 min to remove the Mg–Cu phase. The resulting Ti–Cr–Zr foams will be labeled F5, F10, and F30, where F stands for foam and the numbers again stand for the Mg exposure times.
B. Micro-tomography
Each of the six samples was cut with a diamond saw into a rectangular rod with sides of 0.5–1 mm and length of ∼1 cm for micro-tomography measurement conducted at beamline 2-BM at Advanced Photon Source (Argonne National Laboratory, IL).Reference De Carlo, Xiao and Tieman20 The energy of the monochromatic beam was 27.9 keV. Each x-ray projection was collected with an exposure time of 250 ms onto a CCD detector with a 2048 by 2048 pixels array. The field of view used was 1.5 by 1.5 mm2, and 1504 projections were collected for each sample over the full 180° angular range. A standard filtered back-projection reconstruction algorithm was used to reconstruct the 3D images.Reference Natterer21 The full reconstructed volume was a cylinder with 1.5 mm diameter and 1.5 mm height with a voxel lateral isotropic size of ∼0.73 μm.
C. Nano-tomography
The size of the porous microstructure of the Ti-foams is beyond the resolution of micro-tomography. To conduct the analysis at the proper nanometer length scale, x-ray nano-tomographyReference Wang, Chen, Yuan, Tkachuk, Erdonmez, Hornberger and Feser19,Reference Zbik, Martens, Frost, Song, Chen and Chen22 was thus carried out. The nano-tomography sample preparation was performed with two different methods—with and without focus-ion-beam (FIB) milling—to study the effects of FIB milling, which is widely used in preparing nano-tomography samples.Reference Lombardo, Ristau, Harrisa and Chiu23–Reference Shearing, Golbert, Chater and Brandon25 First, the sample preparation with FIB involved milling the sample to selectively cut a cylindrical region of interest, followed by a lift-out procedure to mount the milled cylinder onto a pin. The detailed lift-out procedure is described elsewhere.Reference Chen-Wiegart, Cronin, Yuan, Yakal-Kremski, Barnett and Wang24 Given the large volume to be milled, a high voltage (30 kV) and high Ga ion current (21 nA) were used. The FIB sample preparation results in cylindrical samples with diameters that closely match the field of view of the microscope (40 μm). However, the FIB procedure may introduce damage to the sample, thus affecting the results of the quantitative morphological analysis. Therefore, FIB-less preparation was also performed by hand-cutting the sample with a razor blade and using only the sample tip where the diameter is <100 μm. The sample being larger than the field of view, the scans were thus performed in a so-called “local nano-tomography” mode.Reference Wang, Chen, Yuan, Tkachuk, Erdonmez, Hornberger and Feser19
Nanotomography measurements were conducted at beamline X8C, National Synchrotron Light Source (Brookhaven National Laboratory, BNL). This newly developed transmission x-ray microscope (TXM) at BNL provides a markerless, automated tomography.Reference Wang, Chen, Yuan, Tkachuk, Erdonmez, Hornberger and Feser19 This was an essential capability which enabled very high resolution (voxel size of 38.9 nm for this experiment). Because of the unique capability of the local tomography character offered in the experiment, the sample could be reasonably well reconstructed, thus avoiding a complex sample preparation such as FIB milling. For each sample, a nano-tomography dataset was collected with 8 keV x-rays, using 1441 projections over an angular range of 180° with a field of view of 40 × 40 μm2 (with a 2 × 2 k CCD camera binning 2 × 2 camera pixels into one output pixel). One full nano-tomography acquisition takes approximately 4–6 h. A standard filtered back-projection reconstruction algorithm was again used to reconstruct the 3D images.Reference Natterer21 The reconstructed volume is a cylinder with 40 μm in both diameter and height.
D. Image processing and analysis of the nano-tomography results
The FIB-prepared samples were found to be severely damaged and their reconstructions are only presented here for comparison purpose, without morphological analysis. 3D quantitative morphological analysis was carried out on the nano-tomography reconstruction from all six nonFIBed samples (C and F 5–30). The reconstructed virtual cross-section slices were first cropped to remove the parts closer to the surface (∼1–2 μm), which could be damaged during cutting, also to remove the exterior empty regions in some cases when the sample did not completely fill the TXM field of view, and also to create a parallelepipedic region of interest on which image processing and calculations can be carried out. A median filter with a kernel size of 3 × 3 × 3 voxels was applied to the original image for noise reduction. The Ti-alloy region and the Mg-rich region (in C5–C30) or pores (in F5–F30) were labeled via simple threshold segmentation. The histogram (see supplemental Fig. 1) of the reconstruction images show two distinctive peaks from Mg–Cu (C5–C30) or air (F5–F30) and from the Ti phase. The threshold value was defined as the minimum value between the two peaks. A smoothed surface mesh was then generated from the threshold image using commercial software (Avizo, VSG, version 7). The surface mesh was generated based on the interface between the titanium and the exterior region of the threshold segmented image (for details, see supplemental Table I).
Various 3D parameters were then calculated from the segmented structure and surface meshes: Ti-alloy ligament size distribution, Mg–Cu and pore characteristic length, tortuosity, and curvatures. The surface meshing and the principal curvature calculations were carried out using commercial package (Avizo, v.7, VSG). All other analyses were done using customized written software (MatLab, R2011b, MathWorks) with the algorithms described elsewhere: ligament size distribution by Holzer et al.,Reference Munch and Holzer26 tortuosity by Maire et al.,Reference Maire, Caty, King and Adrien27 and characteristic length and interfacial shape distribution (ISD) by Voorhees et al.Reference Alkemper and Voorhees28 As a bi-continuous structure, it is inaccurate to represent the ligament size with one average number or minimum diameters. Therefore, the ligament size distribution used in this paper shows an overall distribution of all the present ligament diameters within the entire Ti foam structure. The algorithm for the tortuosity calculation was slightly modified such that the neighboring distance is defined by an approximation of the euclidean, a so-called “quasi-euclidean definition,” and also the entire sample volume was calculated as a single path instead of two separate sub-volume divisions as shown in the literature.Reference Maire, Caty, King and Adrien27 In the ISD calculation, as the surface meshing in Avizo results in a triangular mesh with tiles of various areas, an area weighting procedure is used when generating the probability map.
III. RESULT AND DISCUSSION
A. Ti-foam fabrication and micro-tomography
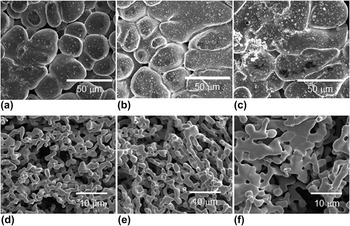
Figure 1 shows 2D images of the surface of the six as-prepared samples, obtained with a scanning electron microscope (SEM). Significant differences in morphology between the as-prepared and etched samples are visible. In particular, the surfaces of the as-prepared samples C5, C10, and C30 show a single phase with a low volume fraction of pores, rather than the expected two-phases bi-continuous composite structure consisting of a Ti-rich phase (Ti–Cr–Zr) and a Mg-rich phase (Mg–Cu). The reason for this will be explained in the next section. One can also notice that the size of the microstructure is larger for the sample F30.
SEM images of surface of as-prepared samples exposed to liquid Mg melt for (a) 5 min (C5), (b) 10 min (C10), and (c) 30 min (C30). SEM images of surface of etched foams created from these as-prepared samples for Mg exposure times of (d) 5 min (F5), (e) 10 min (F10), and (f) 30 min (F30).

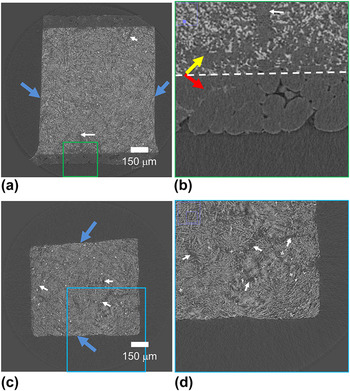
Micro-CT provides an overview of the internal structure instead of only the surface as shown in the SEM images. Figure 2 shows the virtual cross-section obtained by Micro-CT of the six samples. Only the samples exposed for 30 min to the Mg melt—as-prepared composites [C30, Figs. 2(a) and 2(b)] and etched foams [F30, Figs. 2(c) and 2(d)]—are shown here for brevity. Cross-sections of the other four samples are shown in supplemental Figs. 2 and 3. In Fig. 2(a), a slice shows the internal structure of the C30 sample, where blue arrows indicate the surface cuts after Mg melt exposure, while the other two surfaces correspond to those in contact with the Mg melt. These cuts were necessary for making the sample small enough for the micro-CT measurement. In the natural surface, as enlarged and shown in Fig. 2(b), a boundary between a near-surface region and an internal region can be seen, as marked with the dashed line in Fig. 2(b). The near surface region consists of a ∼100-μm thick layer of the residual Mg–Cu phase left from the Mg melt, which covers the entire surface of the sample [shown as red arrows in Fig. 2(b)]. Under this internal layer, the internal composite contains the two Ti–Cr–Zr (lighter gray) and Mg–Cu (darker gray) as indicated with an yellow arrow in Fig. 2(b). This surface Mg-rich layer is absent from the etched foam sample [Figs. 2(c) and 2(d)] as expected since the etching process completely removes the Mg-rich phase, both from the surface residual and from the bi-continuous structure. For both situations (before and after etching), the distribution of the Ti-rich phase within the samples is inhomogeneous in some regions, as indicated by the white arrows in all sub-figures in Fig. 2, corresponding to regions with low fractions of the Ti-rich phase.
Virtual cross-section obtained by Micro-CT of (a) composite C30 with a region marked by green rectangle enlarged in (b); the red arrow in (b) indicates the residual Mg–Cu phase on the surface and the yellow arrow indicates the internal composite: Ti–Cr–Zr (lighter gray) and Mg–Cu (darker gray). The dashed line marks the boundary between these two regions. (c) Etched foam F30 with a region marked by blue rectangle enlarged in (d). The white arrows in all the sub-figures (composites and foams) indicate regions with visibly less Ti-rich phase. The blue arrows in figures (a) and (c) indicate artificially cut surfaces for making the sample small enough for the micro-CT measurement.

B. Nano-tomography
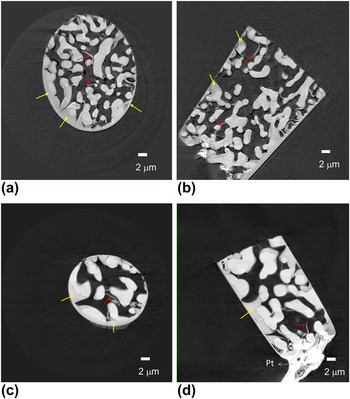
The virtual cross-section images of the nano-tomography reconstruction from the F5 and F30 samples, prepared by FIB milling and lift-out technique, are shown in Fig. 3. Two kinds of artifacts due to FIB damage can be clearly identified in these reconstructed images. First, the morphology of the surface is modified and additional materials fill the pores present at the surface, as indicated by the solid yellow arrows. Second, the internal structure shows additional filling material that might have migrated into the pores during milling and form the crescent shape structures indicated by the dashed red arrows. While FIB milling combined with the lift-out technique has been successfully applied to nano-tomography sample preparation in other systems such as solid oxide fuel cells,Reference Chen-Wiegart, Cronin, Yuan, Yakal-Kremski, Barnett and Wang24 Li-ion batteries,Reference Liu, Cronin, Chen-Wiegart, Wilson, Yakal-Kremski, Wang, Faber and Barnett29,Reference Chen-Wiegart, Liu, Faber, Barnett and Wang30 and nanoporous gold,Reference Chen-Wiegart, Wang, Chu, Liu, McNulty, Voorhees and Dunand31 this method must be avoided in the present Ti-alloy case, at least for the present milling conditions.
TXM reconstructed image of the Ti foam which underwent FIB sample preparation: F5 (a) radial virtual cross-section and (b) longitudinal virtual cross-section; and F30 (c) radial virtual cross-section and (d) longitudinal virtual cross-section (material marked Pt at the bottom of the sample is platinum used to hold the sample onto the sample holder). Artifacts described in the text are shown with arrows.

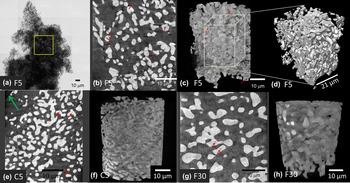
(a) TXM mosaic image for the FIB-less Ti–Cr–Zr foam F5. The square shows the location for local nano-tomography, (b) 2D longitudinal virtual cross-section from TXM reconstruction, and (c) 3D volume of the reconstructed Ti-foam. Red arrows point to enclosed pores. (d) Cropped volume (25 × 21 × 31 μm3) from F5 for 3D morphological analysis. Images of the FIB-less composite C5, (e) 2D virtual cross-section, and (f) 3D reconstruction; and foam F30, (g) 2D virtual cross-section, and (h) 3D reconstruction.

Therefore, an automated markerless local nano-tomography methodReference Wang, Chen, Yuan, Tkachuk, Erdonmez, Hornberger and Feser19 was applied on nonFIB samples. Figure 4(a) shows a TXM mosaic 2D radiographic image showing the entire geometry of the sample. For tomography, the field of view is restricted to the yellow rectangle. The resulting cross-section and 3D views are shown in Figs. 4(b) and 4(c), respectively. Fully closed pores with high curvature (indicated by red arrows) are found, as also observed in transmission electron microscopy images of nanoporous gold,Reference Rosner, Parida, Kramer, Volkert and Weissmuller32 which is prepared by a single-step acid dealloying from a crystalline Ag–Au alloy. Figure 4(d) illustrates the cropped volume from the full 3D reconstruction for the 3D morphological analysis as described in Sec. II. D. Figures 4(e) and 4(f) show the 2D cross-section and 3D volume of the composite C5, where the Mg–Cu matrix has relatively low contrast but can be vaguely seen (such as the green arrow, which indicates the surface of the Mg–Cu matrix). Qualitatively compared with E5, the morphology did not change during the etching process. Figures 4(g) and 4(h) show the 2D cross-section and 3D volume of the composite F30, where the coarsening of the Ti alloy ligament due to the longer Mg exposure can be clearly identified by comparing Figs. 4(g) and 4(h) with Figs. 4(b) and 4(c), images of E5. A complete view of all six samples can be found in supplemental Fig. 4.
C. Quantitative 3D morphological analysis from nano-tomography
1. Ti ligament diameter distribution
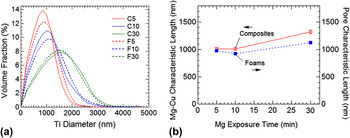
Figure 5(a) shows the Ti ligament diameter distributions of the as-prepared composite (solid lines) and etched foam samples (dashed lines). The distributions are rather identical for foam and composites indicating that the etching process changes only marginally this parameter. The SEM images in Figs. 1(d) and 1(e) seemed to indicate an apparently minor difference between F5 and F10. The quantitative analysis shows however the shifting of the ligament size distributions toward larger ligament diameters indicating very clearly that coarsening is indeed occurring during Mg exposure at an elevated temperature. The absolute value of the width of the distributions also broaden noticeably with exposure time, with the full width half maximum spanning from 1.2–1.3 μm for sample C5 and F5, 1.3–1.5 μm for sample C10 and F10, and 1.9–2.1 μm for sample C30 and F30. If we now calculate the relative width of these distributions (for instance the variation coefficientReference Maire, Colombo, Adrien, Babout and Biasetto33 and defined as the percentage ratio of the width of the distribution over its average) it is almost equal to 130% for the three holding times. Figure 5(b) shows the characteristic length for Mg–Cu phase (composite) and pore (foams) as a function of Mg exposure time. First, the size scale of the Mg–Cu phase was largely preserved by the etching process, which results in a similar characteristic length of the pore for the composites and of the Mg–Cu for the foams at a given Mg bath time. Similar to the Ti-ligament, the size of Mg-Cu also increased from 5 to 30 min of Mg exposure. The characteristic length is solely based on the ratio between the volume and surface area of Mg–Cu phase (for composites) or pore (for foams). This single value parameter is therefore less sensitive than the size distribution calculations used to quantify the titanium ligament size. However, the overall trend of size increasing with Mg exposure time for the Mg–Cu phase and pores remains similar to the one observed for titanium ligament size.
(a) Ligament diameter distribution for the three as-prepared composites (solid lines) and the three etched foam (dashed lines) showing coarsening with liquid Mg exposure time and little effect of etching, and (b) characteristic length for Mg–Cu phase (composite) and pore (foams) versus Mg exposure time.

The coarsening of the Ti-ligament size with increasing liquid Mg exposure time can be used to tailor the desired Ti-ligament size and therefore the relevant properties for specific applications.
2. Tortuosity
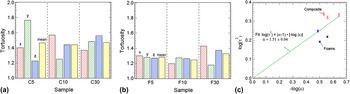
Figures 6(a) and 6(b) display the tortuosity of the six samples. The x, y, and z directions were the laboratory axes, and a quasi-Euclidean definition of neighboring voxels was used. The magnitudes and the degree of anisotropy do not indicate that the Mg exposure or etching processes caused a significant change in tortuosity. The tortuosity is slightly higher in the composites (∼1.4) than in the foams (∼1.3), which is consistent with the fact that the composites have a slightly lower volume fraction of titanium than the foams.
Tortuosity (τ) for (a) the as-prepared composites and (b) the etched foams. (c) Plot of tortuosity factor (τ2) versus volume fraction (ε) in log–log scale along with the Bruggeman coefficient fitting.

Quantitatively, the relation between the volume fraction ε and the tortuosity τ can be expressed by the Bruggeman relation: τ2 = ε1−α, where α is the Bruggeman coefficient.Reference Thorat, Stephenson, Zacharias, Zaghib, Harb and Wheeler34 The Bruggeman relation builds upon a simplified geometry—the tortuosity is calculated within a matrix where spherical particles are embedded. Specifically, α is 1.5 in this simplified case. While the Bruggeman relation can be qualitatively used to approximate the tortuosity in other geometry, the value of the parameter α may vary. Figure 6(c) shows the relationship between the tortuosity factor (τ2) and volume fraction (ε) in double (base ten) logarithmic scale along with the Bruggeman coefficient fitting. The dashed line is the best linear line fitted provided that the line passes through the origin, which is the boundary condition: when the volume fraction is unity, the tortuosity should also be unity. While the α value obtained from the fitting is close to 1.5, as in the simplified geometry, some data points deviate from the estimation of the Bruggeman relation because of the more complex geometry in the Ti-foam samples. Supplemental Fig. 5 shows the tortuosity values of all three orthogonal directions for each sample.
3. Curvature analysis–ISD
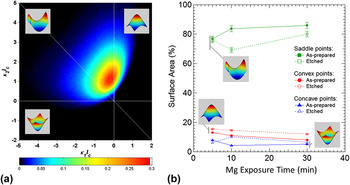
As shown in Fig. 7(a) for the F5 foam, 3D morphology of the samples is quantified using the ISD method.Reference Kwon, Thornton and Voorhees35–Reference Kammer and Voorhees37 As a way to quantify the shape of a 3D interface or a surface (interface between air and sample), an ISD provides a probability density map of finding a small patch of interface with a given pair of minimum and maximum principal curvatures, κ1 and κ2, respectively. These principal curvatures are directly related to other two common curvature quantities, mean curvature [H = (κ1 + κ2)/2], and Gaussian curvature (K = κ1κ2). H, for instance, is directly linked to the chemical potential at a point on the interface. As a result, the volume fraction of the phases and the mechanism of mass transport in the system determine the shape of an ISD. As the solid volume fraction departs from 50%, the average of mean curvature deviates from zero.
(a) Scaled interfacial shape distribution of F5 foam (insets show the corresponding shape for each quadrant). (b) Fraction of surface area for each of the three shapes (saddle, convex, and concave points) as a function of Mg exposure time, both as-prepared composites and etched foams.

On the ISD shown in Fig. 7(a), the second quadrant corresponding to K < 0 has the highest probability density, meaning that most of the surface patches of the Ti nano-foam are saddle-shaped. Some fall in the first quadruple, where both κ1 and κ2 are positive, corresponding to the convex points among the surface. The minority of the patches have concave shapes. The area percentage of these three different shapes (saddle, convex, and concave) is shown in Fig. 7(b) as a function of Mg melt exposure time and process (before/after etching).
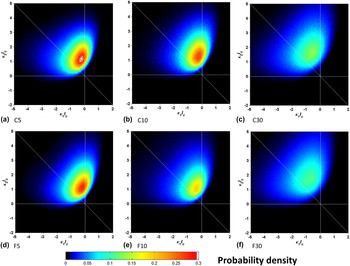
In Fig. 7(a), κ1 and κ2 are scaled with the average Ti ligament diameter calculated from Fig. 5(a), so the overall distribution does not depend on the size of the ligament (or pores) but solely on the shape of the surface. This scaling allows direct comparison of the ISDs of the Ti-foams with different Ti ligament sizes, as shown in Fig. 8. First, if we compare the time series from C5 to C30, or F5 to F30, the ISDs show a continuous broadening in their peaks, indicating that the shape of the surface morphology has changed during the coarsening. Second, comparing the as-prepared and the etched samples at the same time point (C5 versus F5, C10 versus F10, and C30 versus F30), the ISDs did not show a significant change. This is a clear indication that the etching process preserves the shape of the structure and did not introduce changes after the phase-separation in the Mg melt. Furthermore, we can compare these ISDs for nanoporous titanium with the ISDs from nanoporous gold, fabricated in a single step by dealloying an Ag–Au alloy with nitric acid.Reference Chen-Wiegart, Wang, Chu, Liu, McNulty, Voorhees and Dunand31,Reference Chen, Chu, Yi, McNulty, Shen, Voorhees and Dunand38 While the ligament size is much smaller for np-Au, the resulting ISDs from these two different processes are qualitatively similar, indicating that these two different processes—dealloying in acid for nanoporous gold and phase-separation for np-Ti—have little effect on the resulting shape of the interface and curvature distribution.
Scaled interfacial shape distribution of (a-c) the as-prepared composites and (d-e) the etched foams.

IV. CONCLUSION
Nano-tomography using TXM coupled with quantitative image analysis is an effective means of characterizing the critical 3D morphological parameters of nanoporous materials. Four key discoveries were made. First, liquid Mg melt exposure of Ti foams for 30 min causes the average Ti submicron ligament diameter to increase by about 550–850 nm in both the as-prepared and etched samples. The coarsening of the Ti ligaments in high temperature Mg is reflected in the shifting of the overall size distribution toward larger ligament diameters. Second, the magnitude of the tortuosity and the degree of anisotropy is not indicative of a clear trend of change as a function of Mg melt exposure time or etching. The relationship between the tortuosity and the volume fraction loosely follow the Bruggeman relation. Finally, the distribution of the two principal curvatures indicates that the nanoporous Ti and pore interface consists largely of saddle points where the maximum curvature is positive and the minimum curvature is negative, in addition to about 15–18% of the convex points. These area percentages remain relatively unchanged during the Mg melt exposure and subsequent etching processes. While the etching process did not have a significant effect on the ISD, the Mg melt exposure causes the ISD peak to broaden. The ISD is qualitatively very similar to the ISD of the classical nanoporous gold, indicating that the underlying mechanism between the molten Mg phase separation and acid treatment de-alloying is similar.
Supplementary Material
Supplementary materials can be viewed in this issue of the Journal of Materials Research by visiting http://journals.cambridge.org/jmr.
ACKNOWLEDGMENTS
We thank Dr. Fernando Camino (BNL) for assisting the development of the sample preparation procedure using FIB/SEM. FIB-lift out sample preparation was carried out at the Center for Functional Nanomaterials, Brookhaven National Laboratory, which is supported by the U.S. Department of Energy, Office of Basic Energy Sciences, under Contract No. DE-AC02-98CH10886. Use of the National Synchrotron Light Source is supported by the U.S. Department of Energy, Office of Science, Office of Basic Energy Sciences, under Contract No. DE-AC02-98CH10886. Use of the Advanced Photon Source, an Office of Science User Facility operated for the U.S. Department of Energy (DOE) Office of Science by Argonne National Laboratory, was supported by the U.S. DOE under Contract No. DE-AC02-06CH11357.