Introduction
Colorimetric methods based in noble metal nanoparticles (NPs) have become of great interest in recent times mainly due to their molar absorptivity in the visible region (108–1010/M/cm) often several orders of magnitude higher than most organic dyes.[Reference Audrey and Frederic1, Reference Kim, Johnson and Hupp2] Despite this great advantage, the NPs have low selectivity toward the analytes, then they must be functionalized conveniently. In particular, functionalized gold and silver NPs (AuNPs and AgNPs) have been reported as selective and sensitive sensors for different analytes. AuNPs, for example, have been functionalized with different ligands including biologic materials (DNA[Reference Lee, Han and Mirkin3]) and simple molecules (Tween-20[Reference Lin, Yu, Lin and Tseng4] and mercapto-organic acids[Reference Huang and Chang5]). AUNPs have shown excellent results as sensors, but they have important drawbacks as such the high cost of the precursor [HAuCl4 (chloroauric acid)], ligands used (oligonucleotide probes/fluorescent dyes, etc.) and long detection times. The use of functionalized AgNPs as sensor has been preferred over AuNPs, since the synthesis of the former are less expensive and the AgNPs have higher molar absorptivity as compared with AuNPs of same size.[Reference Lee, Lytton-Jean, Hurst and Mirkin6] The use of highly biocompatible ligands in the Ag NP synthesis has been an important research subject. Some reports describe methods using natural extracts of fruits[Reference Prathna, Chandrasekaran, Raichur and Mukherjee7] and leafs.[Reference Bar, Bhui, Sahoo, Sarkar, Pyne and Misra8] Nevertheless, some of these materials are often only found locally, which makes it difficult to apply.
Heavy metals ions such as Cd2+, Pb2+, and Hg2+ have harmful effects on humans, and are generally ingested via plants[Reference Liu, Song, Tang, Li, Xu, Wu, Wang and Brookes9] and animals[Reference Morcillo, Esteban and Cuesta10] where accumulation occurs from sources, including storm water[Reference Gunawardena, Egodawatta, Ayoko and Goonetilleke11] and volcanos[Reference Moune, Gauthier and Delmelle12] near crop fields. Several methods have been developed to detect Hg2+ using HPLC (high-performance liquid chromatography)[Reference Vallant, Kadnar and Goessler13], atomic absorption spectrometry,[Reference Xiaoguo, Bei and Meiqing14] and ICP-OES (inductively coupled plasma emission spectroscopy).[Reference Li, Chen, Li, Sun, Wang, Gao, Zhao and Chai15] Although these methods are selective and sensitive for the determination of Hg2+ they need expensive equipment, are time-consuming and need solvents and derivatization reagents of high purity, in order to avoid interference of other substances in the method. Hence, it is necessary to develop sensitive and selective colorimetric methods using simple and biocompatible synthesis methods.
For the detection of Hg2+ ions, UV–Vis spectrophotometry has been explored as a fast and inexpensive tool, using ligands based on simple organic molecules[Reference Coronado, Gala, Martı, Palomares, Durrant and Gratzel16, Reference Shunmugam, Gabriel, Smith, Aamer and Tew17] and biocompatible molecules such as DNA[Reference Lee, Han and Mirkin3] and oligonucleotides[Reference Ono and Togashi18] The determination of Hg also have been reported using functionalized AgNPs with different ligands like Gum kondagogu[Reference Rastogi, Sashidhar, Karunasagar and Arunachalam19], cysteine,[Reference Jiang, Guan, Rachel Lim, Polavarapu and Xu20] and others. Although these methods have led to successful development of mercury ion sensors, they use expensive and unstable reagents, sometimes of difficult acquisition, to stabilize the NP. In this work, we focus on a simple, green chemistry method using egg-white protein (EW) in the synthesis of Ag NPs: EW is a common product around the world and presents interesting biocompatible properties. It has been used previously for the synthesis of Ag[Reference Lu, Yang, Cui, Wang and Guo21]; however, the method requires a long reaction time. Here, we report a very simple method for the synthesis of egg-white-capped silver nanoparticles (EWAg NPs), and we illustrate their applicability as nanosensor for metal ion detection.
This work focuses on using optical spectroscopy techniques as a strategy to develop practical and fast assays. The method reported in this work is based on EWAg NPs as a biocompatible, optical and eco-friendly sensing material. The selectivity of the nanosensor is investigated by determining the interaction of the EWAg NPs with 16 different metal ions. The EWAg NPs were also applied in a realistic, complex systems using tap water, with excellent recoveries. High selectivity, sensitivity, low cost, and rapidity make EW/Ag NPS a suitable nanosensor for Hg2+ ions determination.
Experimental section
Materials and apparatus
Silver nitrate (AgNO3) and sodium borohydride (NaBH4) were purchased with 99.99% trace metals basis purity. All cations were used as nitrate salts [Mg(NO3)2.6H2O, Ca(NO3)2.4H2O, Sr(NO3)2.H2O, Zn(NO3)2.6H2O, Co(NO3)2.6H2O, Ni(NO3)2.6H2O, Mn(NO3)2.4H2O, Cr(NO3)3.9H2O, Cu(NO3)2.3H2O, Fe(NO3)3.9H2O, Hg(NO3)2.H2O, Cd(NO3)2.4H2O], except for Na+, Li+, and K+ that were used as chlorides, all chemicals were purchased from Sigma-Aldrich at ACS reagent grade >99%. The solutions were prepared with deionized water (18 MΩ cm). An Agilent 8454 UV–Vis diode-array spectrophotometer was used to record UV–Vis spectra. Structural characterization was carried out with a JEOL transmission electron microscope (TEM), model JEM2200FS, with spherical aberration correction in a probe mode working at 200 keV accelerating voltage. The appearance and size of NPs were analyzed in the scanning transmission electron microscopy (STEM) mode. An Agilent Cary 630 FTIR spectrometer was used to record the IR spectra. X-ray photoelectron spectroscopy (XPS) was carried out with a Thermo Scientific K-Alpha Surface Analysis spectrometer, equipped with a mono Al Kα X-ray source. The samples were not eroded before any measurement.
Synthesis of EWAg NPs
The synthesis of the EWAg NPs was studied using different quantities of NaBH4 and EW protein. Typically, a different amount of an AgNO3 aqueous solution (8.5 mg/mL) was added to 24 mL of water, and after 5 min of mixing, pure EW was added to the silver solution (Table S1). This mixture was kept under vigorous stirring for 5 min followed by the drop-wise addition of a specific amount of NaBH4 solution (1 mg/mL). The reaction was kept with stirring for 10 min. A dark, yellowish solution was obtained and kept in refrigeration for further analytical studies.
Analytical studies
To study the interaction of the EWAg NPs with a variety of metal ions, a UV–Vis titration was performed as follows. A 2 mL sample of EWAg NPs was diluted to 30 mL with water. Afterwards, 2 mL of this solution were placed in a quartz cuvette followed by the addition of 20 µL of a 1 mM cation solution; note that the resulting change in concentration as a result was negligible. The solutions were mixed for 1 min between each titration before they were analyzed in the UV–Vis spectrophotometer.
The application of the EWAg NPs in the detection of Hg in a realistic experimental system was studied by adding a small, specific amount of a 10 or 20 µM Hg2+ solution to tap water before adding the EWAg NP sensor. The standard addition method was used to determine the content of Hg2+ in the sample.
Results and discussion
Synthesis of EWAg NPs
UV–Vis spectroscopy was used to analyze the growth of the EWAg NPs and homogeneity of the resulting particle size distribution. Figure S1 shows the UV–Vis absorbance spectra of the Ag NP colloids prepared with reaction conditions Ag1 to Ag5; the dispersions prepared in Ag6 to Ag8 were not reported due to agglomeration of the NPs after a few hours. It has been reported[Reference Liu, Lee, Kim and Kim22] that agglomeration of uncoated NPs can occur when the NaBH4/AgNO3 molar ratio is smaller than 0.5. The molar ratio calculated for samples Ag1 to Ag5 was 0.2, and for the other samples: Ag6 (0.1), Ag7(0.05) and Ag8(0.005). Hence, all samples were prepared at molar ratios lower than 0.5, which could lead to unstable colloids. In our experiments, the EW protein played the role of capping agent, which helped to prevent agglomeration of particles in samples between Ag1 to Ag5. Nevertheless, it was observed that samples with even lower molar ratio were not sufficiently stable even in the presence of the protein.
The substantial absorbance of the Ag1 sample (without EW) at long wavelengths and the broadness of the plasmon band indicated a poor quality, polydisperse size distribution, and probably an agglomeration phenomenon that provoked a high light-scattering background in the spectrum. Reactions Ag2 to Ag5 showed narrow UV–Vis spectra with FWHM (full-width at half-maximum) of Ag2 (91 nm), Ag3 (74 nm), Ag4 (75 nm), and Ag5 (76 nm). Higher amounts of EW lead to a more monodisperse size distribution of the NPs. It has been reported[23] that EW protein contains approximately 2% of L-cysteine. This amino acid has free thiol groups that may act as bonding sites before the nucleation of Ag with NaBH4; more protein would form more bonding sites in the cavities, which may result in a more monodisperse particle size distribution. On the other hand, the capping of nucleated Ag NPs with EW protein may also restrict further growth, and thus focus the size distribution.
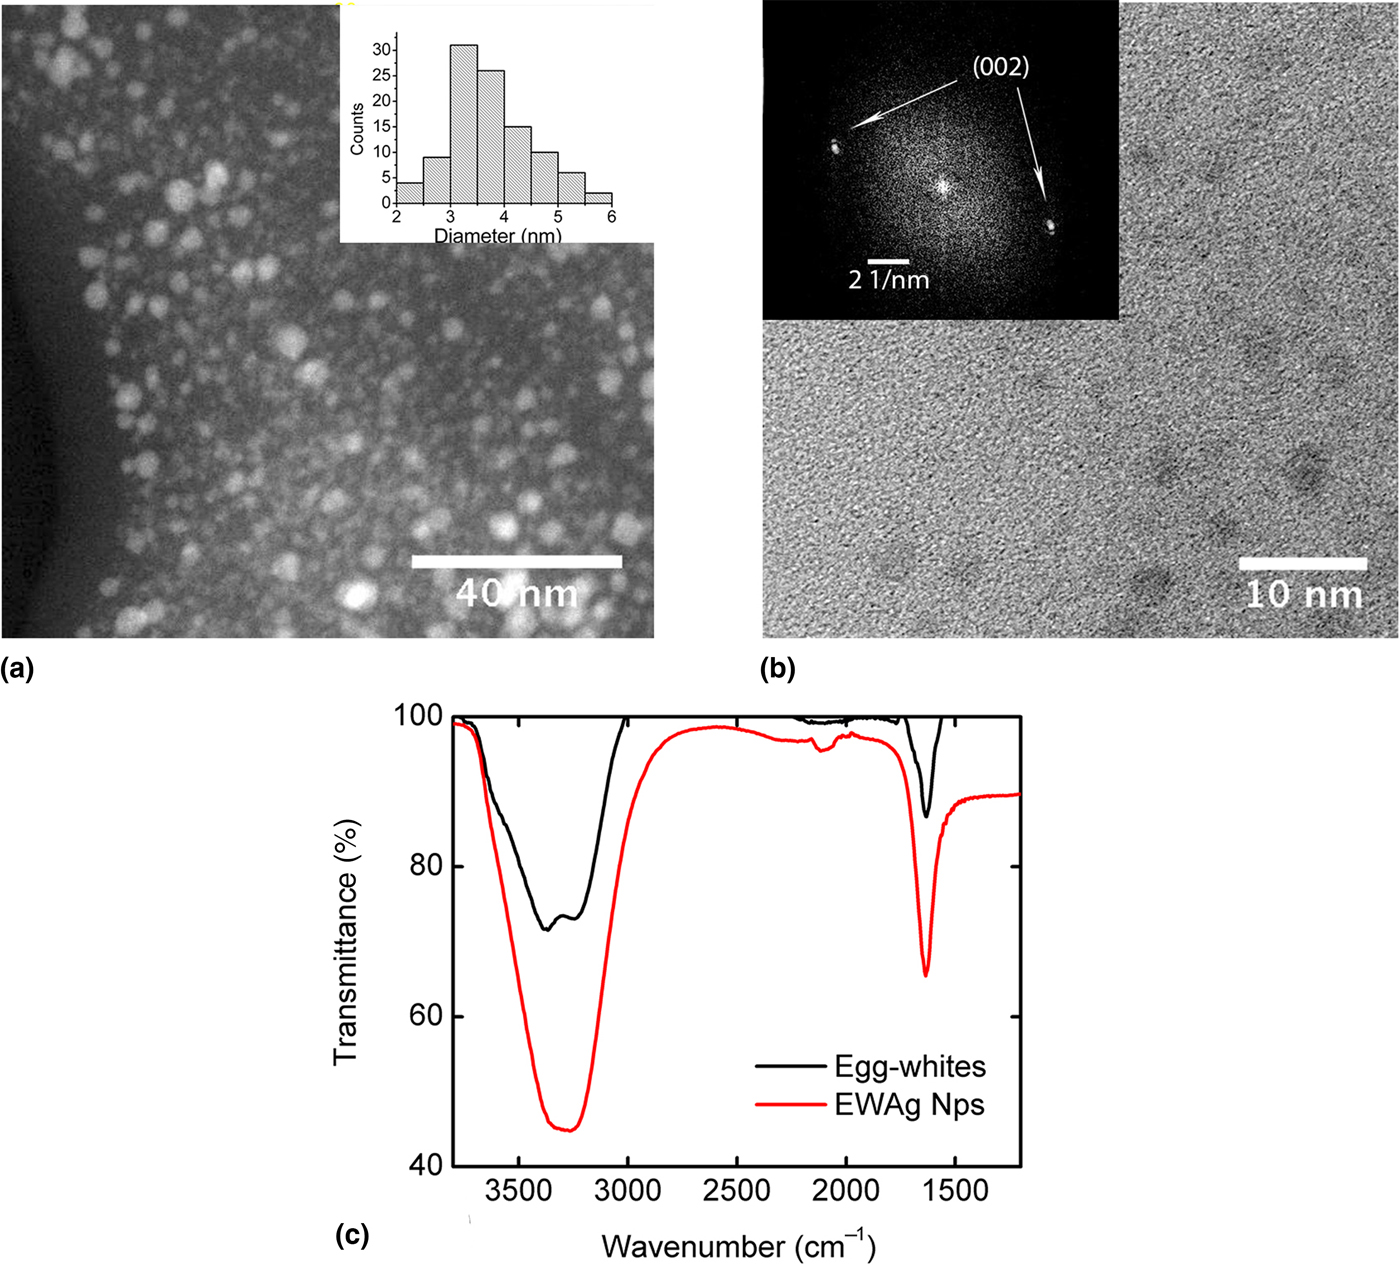
Figure 1(a) shows a selected HAADF-TEM micrograph of the sample Ag5 that revealed that the EWAg Nps were very small with an average diameter of 3.8 ± 0.5 nm, as illustrated in the histogram. Observation at higher magnification [Fig. 1(b)] allowed to identify the presence of metallic silver; the Fast Fourier Transform of the local image revealed the {002} family planes of the FCC crystal structure of silver. Figure 1(c) shows IR spectra of the crude EW protein and of the EWAg NPs. A signal is observed at 1621/cm that corresponds to the stretching vibration of the C = O carbonyl group in the amino acids of the protein. Both spectra showed this signal, confirming the presence of EW at the surface of the Ag NPs
(a) Low-resolution TEM micrograph of Ag5 sample; the inset shows the particle size distribution measured from different images; (b) high-resolution TEM micrograph, the inset correspond with the FFT of the image; (c) IR spectra of the pure EWs and the EWAg NPs.

Effect of metal ions on the EWAg NPs UV–Vis spectrum
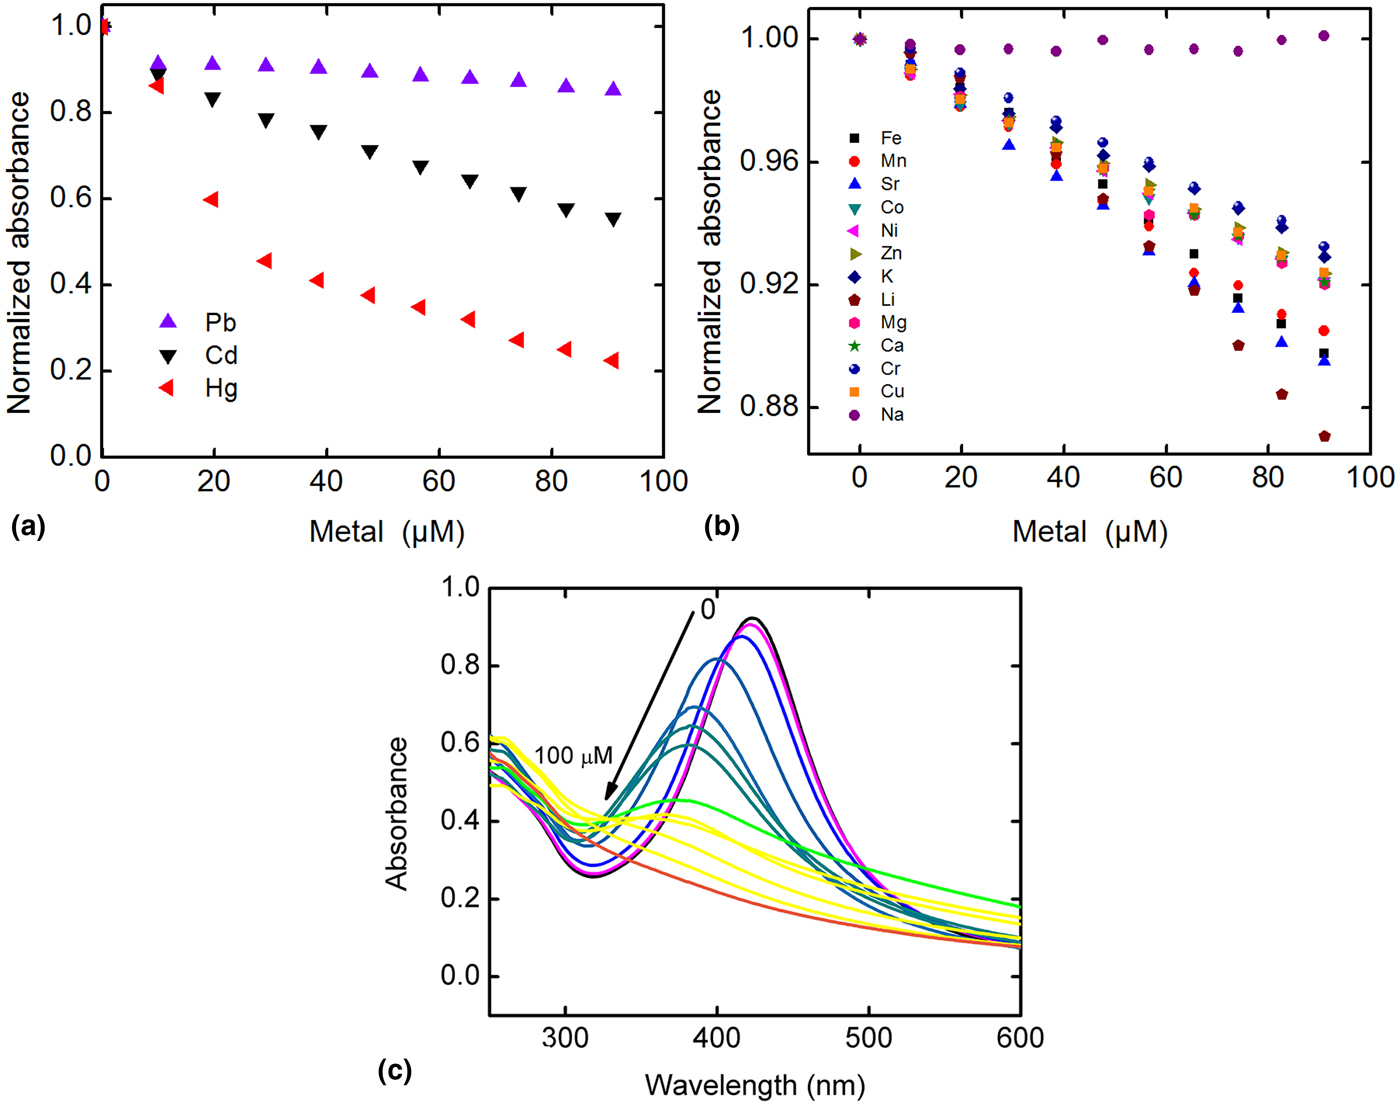
To test the sensitivity and selectivity of the EWAg NPs as nanosensor, the absorbance of the EWAg NP colloid were measured after adding 16 different cations. Figures 2(a) and 2(b) show the dependence of the absorbance of the EWAg NPs as a function of the concentration of metal ions in the reaction solution; different types of metal ions were analyzed (transition metals, heavy metals, and alkali metals). The absorbance was normalized in the plot in order to evaluate the interaction of these metals with the Ag NPs. The results showed that most of the metals do not have any effect on the absorbance of the EWAg NPs. However, Hg2+, Cd2+, and Pb2+ showed a quenching effect, resulting in a decrease of the absorbance corresponding to the NPs with time. At an ion concentration of 90 µM, the presence of Hg2+ resulted in an 80% decrease in the absorbance, Cd2+ in a 45% decrease, and Pb2+ in a 15% decrease. The association constant was determined for Hg2+, Cd2+, and Pb2+ using the Benesi–Hildebrand equation:[Reference Prabhu, Saravanamoorthy, Ashok and Velmathi24]
 $$\displaystyle{1 \over {A_0 - A}} = \displaystyle{1 \over {(A_{\max} - A_0 )K_{{\rm as}}}} \displaystyle{1 \over {[M]}} + \displaystyle{1 \over {(A_{\max} - A_0 )}},$$
where A 0 is the initial absorption intensity, A max is the absorption intensity in an equilibrium, A is the absorption intensity at each metal concentration [M], and K as is the association constant. The calculated K as for Hg2+ was 35,600/M, 14,100/M for Cd2+, and 3900 for Pb2+. This analysis illustrated that the EWAg NPs have a strong affinity for Hg2+ ions compared with for Cd2+ and Pb2+, while the sensor showed minimal changes (8–10%) with all the other metal ions.
Absorbance titration profiles of the EWAg NPs as a function of the concentration of: (a) Cd2+, Pb2+, and Hg2+ ions; (b) and other metal ions with minor effect. (c) UV–Vis spectra of the EWAg NPs as a function of the Hg2+ concentration.

The high association constant between the EWAg Nps and Hg2+ is probably due to the thiol groups (−SH) of the egg protein. Thiol groups have strong affinity to the silver surface and can also establish coordination bonds with Pb, Cd, and Hg. The stability of this SH–metal bond can be explained by the hard–soft acid and base theory proposed by Pearson.[Reference Pearson25] This bond will be more stable when a hard acid is coordinated to a hard base and vice versa. This thiol (–SH) is soft base; meaning that to form a complex with great stability a soft acid is needed. In this case, Pb2+ is in the intermediate range, but Cd2+ and Hg2+ are soft acids. However, Hg2+ has been reported as having the highest “softness” among these ions. These observations may explain why Hg2+ has the highest K as with the EWAg NPs, thus providing selectivity to the sensor for Hg2+ ions.
Sensing studies of Hg2+
The EWAg NPs were used as a sensor for the detection of Hg2+ using UV–Vis spectroscopy. A known amount of the EWAg NPs was diluted with water to maintain the maximum in the surface plasmon resonance (SPR) band at an absorbance of ~1. As shown in Fig. 2(c), the EWAg NPs have a maximum at a wavelength of about 420 nm before addition of Hg2+. After the addition of Hg2+ to the EWAg NP solution, the yellowish color of the solution becomes weaker, and a broadening of the SPR band was observed along with a blue shift of the band. The color of the solution was completely lost at a 100 µM concentration of Hg2+.
The mechanism of sensing of Hg2+ ions using EWAg NPs was based on a process in which an Ag–Hg amalgam was formed at the interphase of the Ag NPs: the core Ag NP diameter decreases, while an amalgam shell was formed. The NPs remain covered with the EW protein, which has carboxylic and thiol groups that can bond to Hg2+ ions. The thiol–Hg2+ complex at the surface can be converted to an Ag–Hg amalgam, via reduction of Hg2+ and oxidation of Ag0; some metallic Hg may also be present at the surface. Based on this mechanism, the quenching and blue shift in the SPR band of EWAg NPs are due to the decreasing Ag NP size with increasing Hg2+ concentration.[Reference Henglein and Brancewicz26] According the redox potentials of the involved half-reactions, the reduction of mercury ion to metal was expected to be a spontaneous process in the presence of metallic silver; additionally, the process could be thermodynamically favored as a result of amalgam formation.[Reference Liu, Wang, Wang, Chen and Long27] The observed electronic absorption spectra of the Hg2+–Ag0 interaction [Fig. 2(c)] suggests a partial dissolution of the NPs which was accompanied of electron localization and widening and blue shift of the SPR band.[Reference Morris, Copeland, Mclinden, Wilson and Szulczewski28]
The formation of the amalgam was corroborated using an XPS analysis of the material formed by reacting the EWAg NPs with a 100 µM concentration of Hg2+. Figure S2 shows the core-level spectrum of Hg present illustrating binding energy peaks at 100.2 and 105.0 eV for the 4f 7/2 and 4f 5/2 signals, which corresponds to the Hg0 formed at the surface. Another signal was observed at 101.2 eV that can be attributed to the binding energy 4f 7/2 of Hg2+ bonded either to thiol groups[Reference Barraud, Zylberajch-Antoine, Roulet and Dufour29] or carboxylic groups[Reference Ren, Zhu and Wang30] of the EW protein. The signal at 102.0 eV corresponds to the silicon of the substrate used to measure the XPS spectrum. In summary, these results corroborate the formation of the amalgam in the EWAg NP surface.
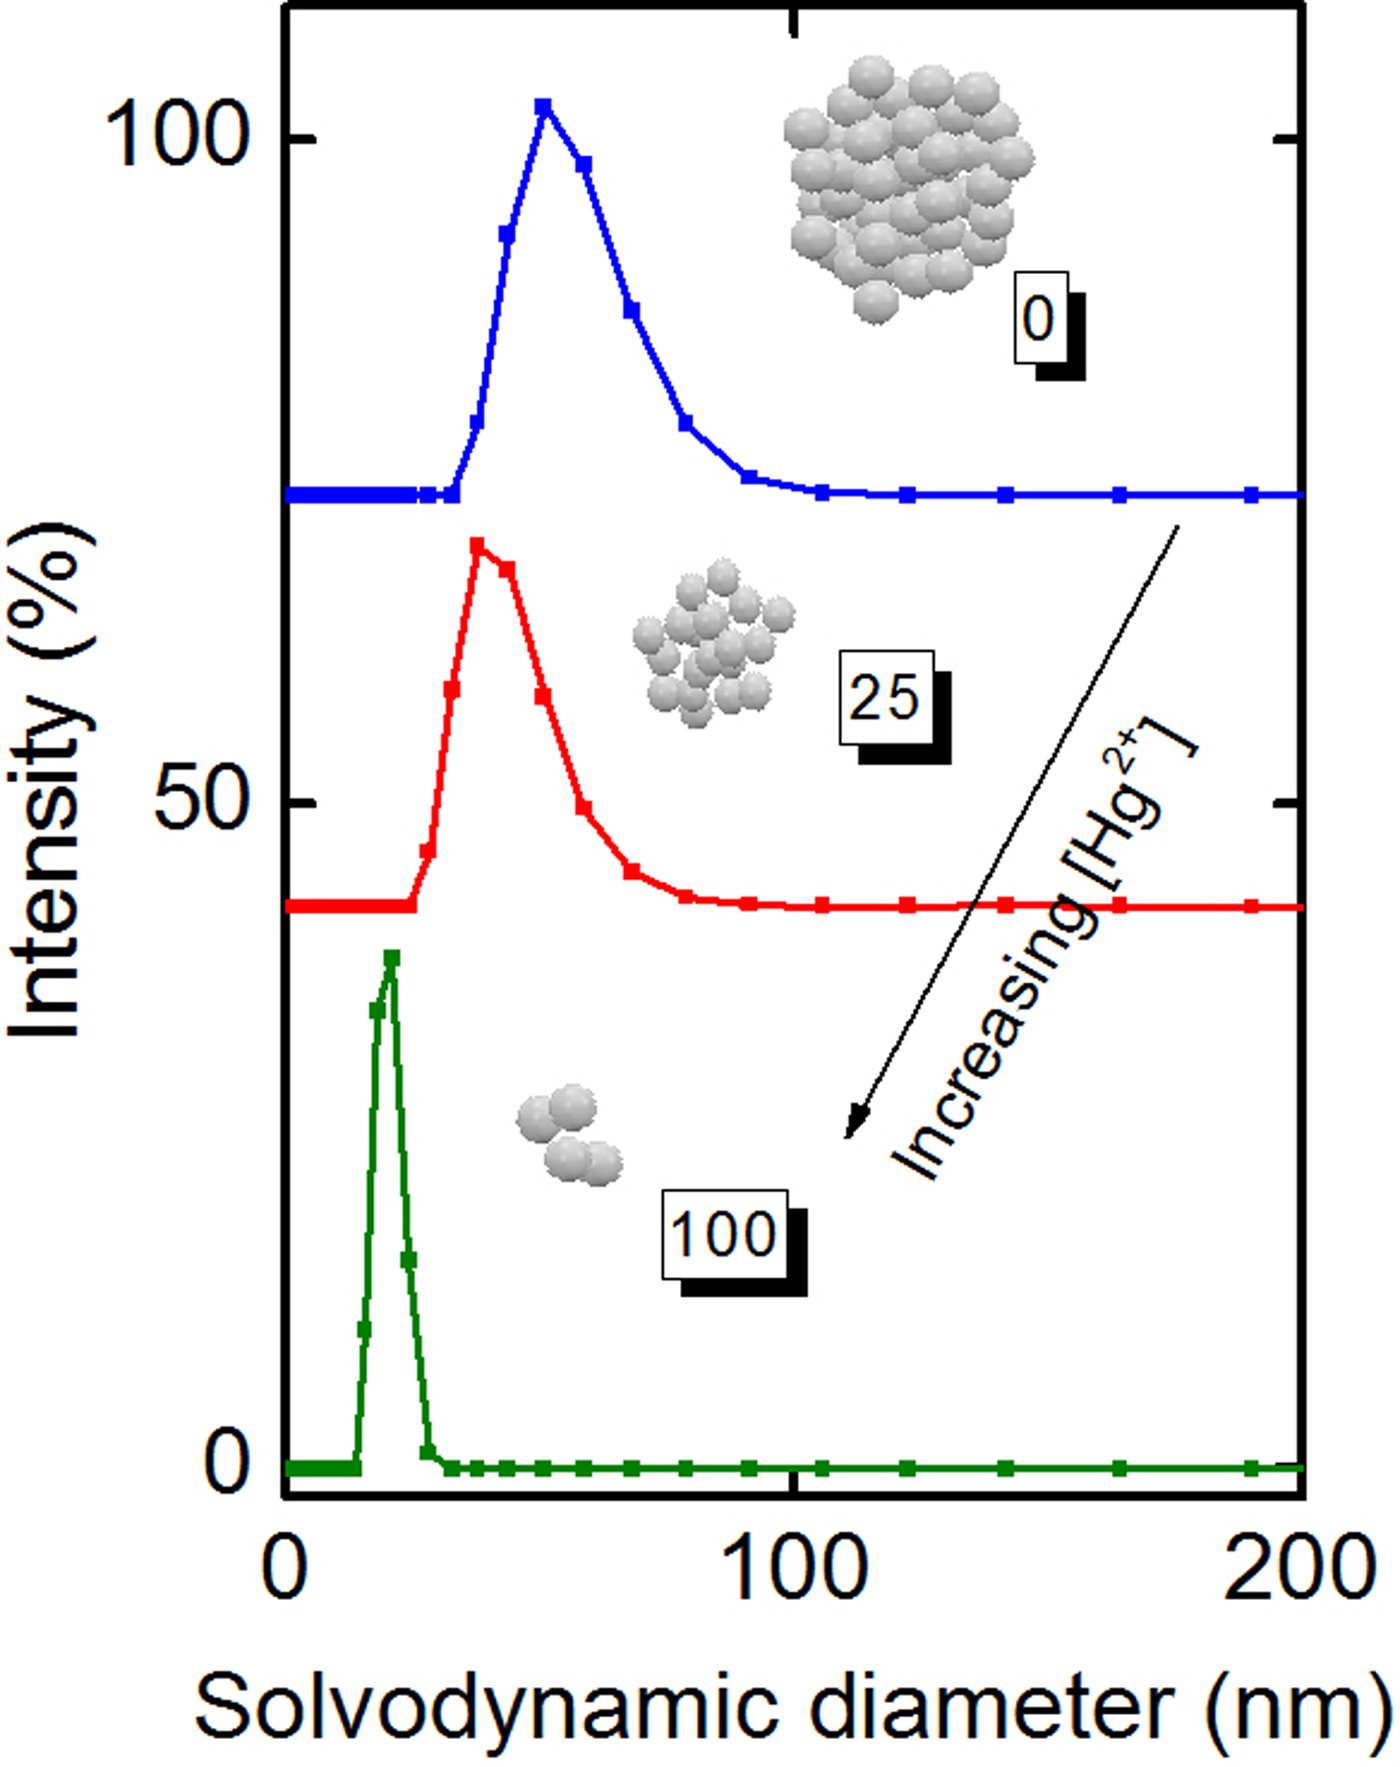
The morphology of the colloidal dispersion was investigated using DLS (dynamic light scattering). Figure 3 shows that the secondary particle size also decreases with increasing Hg2+ concentration. Hence, in agreement with the reaction mechanism, after Hg2+ adsorption and formation of the amalgam, the particles become more soluble resulting in a decrease of aggregate size.
Effect of the Hg2+ ions on the agglomerate particle size of the EWAg NPs.

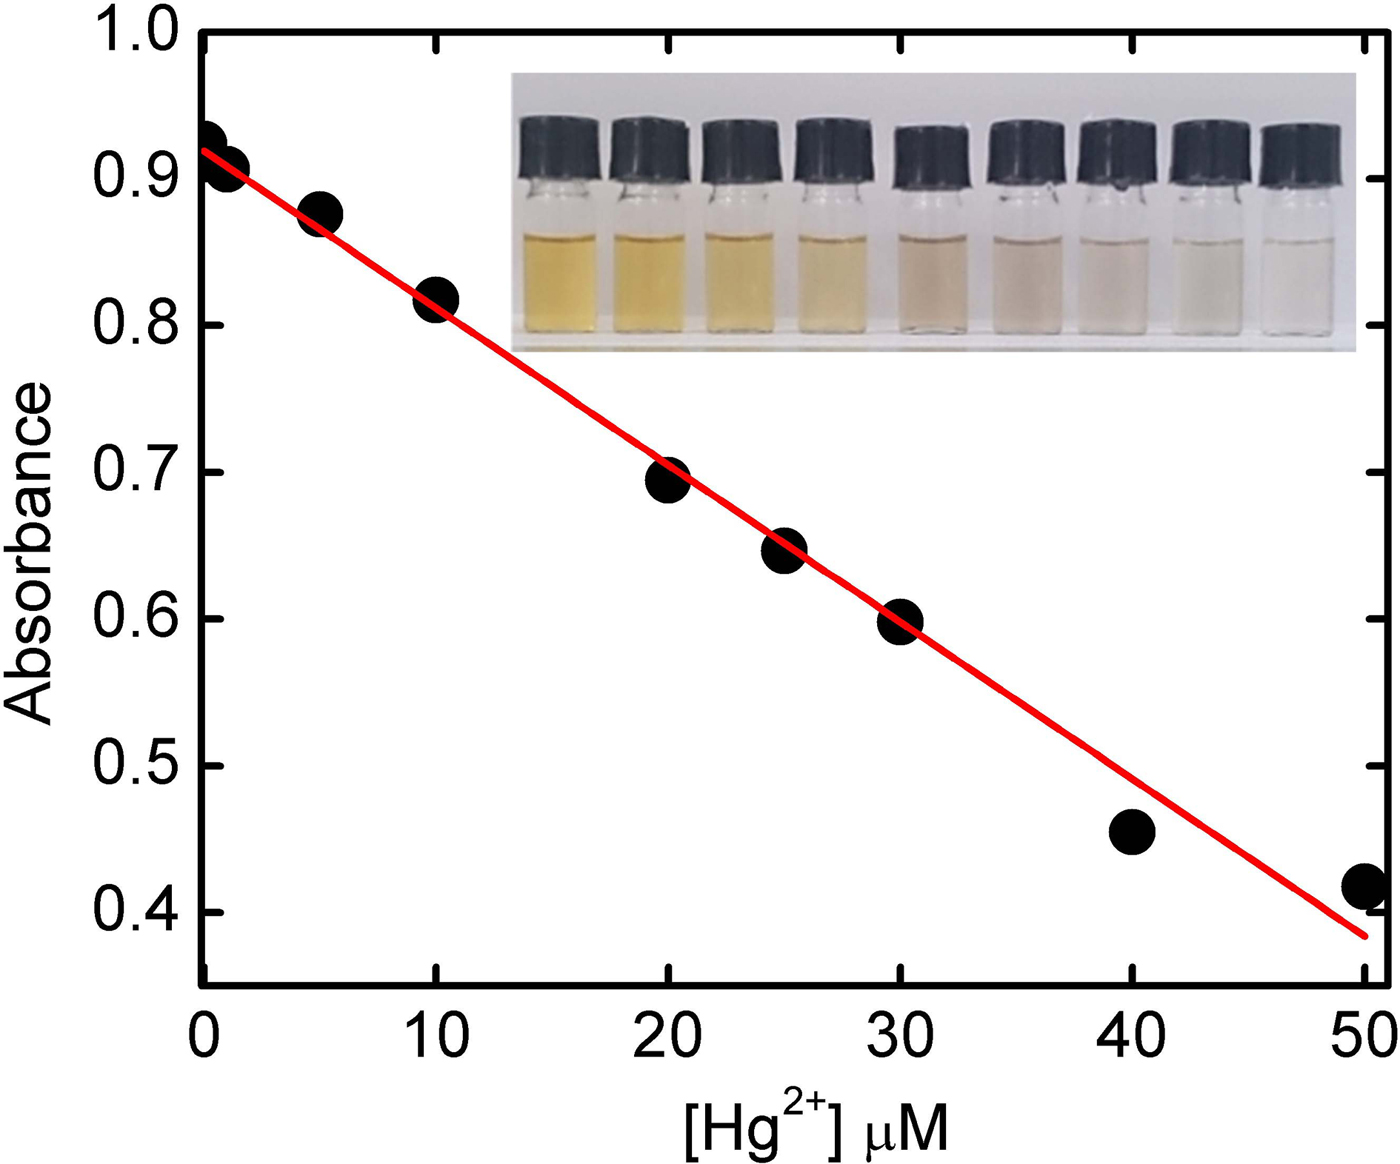
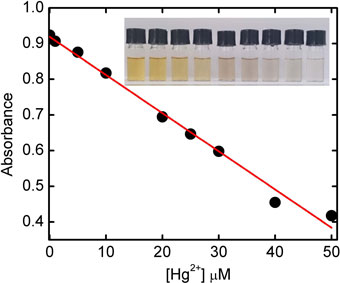
Figure 4 shows a calibration curve for the detection of Hg2+ ions in aqueous solution of EWAg NPs. The calibration curve was established with an optimal concentration range of 1–50 µM, obtaining excellent linearity with R 2 = 0.999. The calibration curve equation in this range is given by A = −0.0107 [Hg2+] + 0.919. The detection limit calculated as three times the standard deviation of the base line was 307 nM. Figure 4 also shows an inset with a photograph of the Hg2+ solutions of concentrations between 1 and 50 µM with the EWAg NPs: it can be seen that the yellowish color corresponding to the silver in the solution disappears with increasing Hg2+ ion concentration. As mentioned before, other ions such as Cd2+ and Pb2+ also decrease the absorbance of the EWAg NPs. To investigate the possible interferences of the Cd2+ and Pb2+ ions in the detection of Hg2+, we also expose the EWAg NPs to a mixture of Hg2+ with Cd2+ and Pb2+ ions in a 50 µM with a molar ration of 1:1 between ions, the absorbance measured for the Cd2+ and Pb2+ cases had an +2.79% and −3.51% error, respectively, in relation with the absorbance measured. This result corroborates that these other ions do not have interference with the Hg2+ detection.
Calibration curve of the absorbance of the Hg2+ concentration in solution with the EWAg NPs. Inset: Photographs of the solutions from low (left) to high (right) Hg2+ concentrations.

Hg2+ measurements in tap water samples
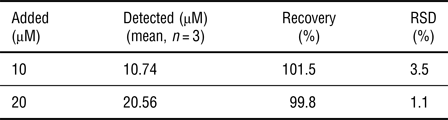
Since the EWAg NPs showed excellent sensitivity and high selectivity for Hg2+ determination, we applied the system as a sensing method to detect Hg2+ in tap water, in order to simulate realistic experimental situation. The sample was analyzed by UV–Vis spectroscopy in presence of the EWAg NPs and the Hg2+ concentration was determined using the standard addition method. The tap water samples were spiked with 10 and 20 µM Hg2+, and the results are shown in Table I. The nanosensor showed excellent recovery percentages between 99.8% and 101.5%, indicating that the nanosensor proposed is highly reproducible.
Determination of Hg2+ in tap water samples.

To compare our EWAg NP sensor with existing methods, Table S2 shows a comparison between several colorimetric sensors used to detect Hg2+. Most of the existing methods have a lower limit of detection, but the nanosensor developed in this work had an exceptionally wide linear range. These results indicated that the nanosensor based on EWAg NPs could be an attractive, simple alternative, or complement to the existing systems.
Conclusions
A simple and fast green method for the synthesis of biocompatible Ag NPs was developed: the NPs were obtained using EW, an inexpensive and universally available reagent. The material was applied for the colorimetric sensing of Hg2+ in water. The EW shows great potential not only for the controlled synthesis of Ag NPs, but also provides specific adsorption sites for Hg2+ ions related to free thiol groups, thus providing selectivity. The EWAg NPs showed excellent selectivity for Hg2+ ions versus others metal ions and high sensibility with a LOD of about 300 nM and a dynamic range of 1000–50,000 nM. These results indicated that this biocompatible nanomaterial has great potential for applications not only in analytical chemistry but also for biologic studies.
Supplementary Material
The supplementary material for this article can be found at https://doi.org/10.1557/mrc.2017.74.
Acknowledgments
Dr. Tirado-Guízar gratefully acknowledges the support from Consejo Nacional de Ciencia y Tecnología, México (CONACyT) for a postdoctoral grant. We also thank to C. Ornelas and W. Antunes for the technical support in microscopy at Nanotech CIMAV-Chihuahua, Mexico.