Introduction
Indigenous chickens (ICs) (Gallus gallus domesticus) are widely distributed throughout Africa under diversified geographical and agro-ecological conditions. Geographically isolated IC populations are subjected to local climatic conditions and each region is thought to host some unique types of chickens, hereafter called ecotypes. Such ecotypes are anticipated to possess' unique combinations of alleles on genes that may confer adaptation to local environment (Mwacharo et al., Reference Mwacharo, Nomura, Hanada, Jianlin and Hanotte2007). These ecotypes may have evolved independently and genetically diverged as a result of natural selection. Some insight into Kenyan IC ecotypes (Kilifi, Taita, Muranga, Kisii, Kitui, Marsabit, Nandi, Meru, Homa Bay and Kakamega) have been achieved using microsatellite markers (Mwacharo et al., Reference Mwacharo, Nomura, Hanada, Jianlin and Hanotte2007, Reference Mwacharo, Nomura, Hanada, Amano, Han and Hanotte2013b). However, several ecotypes remain unknown. Furthermore, none of the studies described above did study the major histocompatibility complex (MHC) of ICs in different ecosystems.
IC populations are raised under scavenging conditions characterized by a high parasite and infectious disease agent load. In order to survive, these chickens have to display a large plasticity in their immune-related genes. The MHC is associated with immune response (Parmentier et al., Reference Parmentier, Baelmans, Savelkoul, Dorny, Demey and Berkvens2004; Fulton et al., Reference Fulton, Juul-Madsen, Ashwell, McCarron, Arthur, O'Sullivan and Taylor2006; Nikbakht, Atefeh and Neda, Reference Nikbakht, Atefeh and Neda2013) and disease resistance (Lamont, Reference Lamont1989). MHC can be used to study evolutionary process (Nikbakht, Atefeh and Neda, Reference Nikbakht, Atefeh and Neda2013). Microsatellite marker LEI0258 located within the MHC region has been used successfully in genetic diversity studies (Izadi, Ritland and Cheng, Reference Izadi, Ritland and Cheng2011; Chang et al., Reference Chang, Chen, Berthouly-Salazar, Chazara, Lee, Chang, Chang, Bed'hom and Tixier-Boichard2012).
The objective of this study was to investigate the genetic make-up of different ecotypes of ICs in Kenya using both MHC-linked and non-MHC autosomal microsatellite markers.
Materials and methods
Sampling
Blood samples were collected from different regions (counties) of Kenya following FAO guidelines (2011). The covered counties included: Kakamega (KK) and Siaya (BN) in the Western region; West Pokot (WP) and Turkana (TK) in North Rift; Bomet (BM) and Narok (NR) in South Rift; Lamu (LM) and Taita-Taveta (TT) in Coastal region (Supplementary Figure S1). Each county represents an ecotype. Two mature chickens per household located more than 0.5 km away from its neighbours were sampled, resulting in a total of 768 birds (i.e. 96 samples per ecotype). One bird per household was genotyped to reduce the probability of sampling genetically related birds (i.e. 48 per ecotype). All samples were collected from free ranging IC populations. Blood samples (~2 ml in EDTA) were drawn from the wing vein of each bird.
DNA isolation, polymerase chain reaction (PCR) amplification and genotyping
Genomic DNA was obtained by standard phenol–chloroform extraction method. Individuals were genotyped with 12 microsatellite markers located on eight chromosomes (Supplementary Table S1). Two of these markers were MHC-linked markers (LEI0258 and MCW0371). The other 10 are non-MHC and are part of the 30 microsatellite markers recommended by ISAG/FAO (FAO, 2011) for chicken genetic diversity assessment. LEI0258 and MCW0371 were determined using PCR as described by McConnell et al. (Reference McConnell, Dawson, Wardle and Burke1999) and Fulton et al. (Reference Fulton, Juul-Madsen, Ashwell, McCarron, Arthur, O'Sullivan and Taylor2006).
Statistical analysis
MHC-linked markers LEI0258 and MCW0371 were examined together whereas ten non-MHC markers were analysed separately. Genetic diversity was assessed by calculating the number of alleles per marker and population (ecotype), observed (Ho) and expected (He) heterozygosity as well as fixation index (Fst) as a measure of genetic differentiation between populations. GenAlex software version 6.5b5 (Peakall and Smouse, Reference Peakall and Smouse2012) was used to estimate observed mean (Na) and effective (Ne) number of alleles, Ho and He per population. Population software version 1.2.32 (Langella, Reference Langella1999) was used for allele frequency and private allele identification. Population differentiation was estimated using Fst for each marker across ecotypes according to the variance-based method of Weir and Cockerham (Reference Weir and Cockerham1984) using FSTAT software Version 2.9.3.2 (Goudet, Reference Goudet2002). The significance of all the pair-wise Fst values was tested after permutations of multi-marker genotypes among samples and significance levels were reported after strict Bonferroni corrections to account for multiple comparisons (Rice, Reference Rice1989). Genetic distances were calculated according to the Nei's standard genetic distance, Ds (Nei, Reference Nei1972) and Dc (Cavalli-Sforza and Edwards, Reference Cavalli-Sforza and Edwards1967) using Populations software version 1.2.32 (Langella, Reference Langella1999). Analysis of molecular variance was performed to assess the percentage contribution of within and between population variations because of the geographic regions using the Arlequin 3.5 software (Excoffier and Lischer, Reference Excoffier and Lischer2011). The significance of the variance components was tested with 10 000 permutations. A Mantel test was used to investigate association between genetic differentiation (Rousset, Reference Rousset1997) and geographic distances (kilometres) between IC ecotypes using Isolation by Distance Web Service (IBDWS) version 3.23 (Jensen, Bohonak and Kelley, Reference Jensen, Bohonak and Kelley2005). The significance level was calculated from 30 000 randomizations.
Structure software version 2.3.4 (Pritchard, Stephens and Donnerly, Reference Pritchard, Stephens and Donnerly2000) with the Bayesian model-based clustering method for inferring population structure using multi-locus genotypes was executed. The program was run 50 times for each assumed genetic cluster (K) value using the admixture and correlated allele frequencies model because IC ecotypes are likely to be similar due to common ancestry and frequent gene flow among nearly all the ecotypes within the terrestrial land of Kenya. Models with a burn-in period of 20 000 followed by 50 000 of Markov chain Monte Carlo iterations were implemented. Individuals were grouped into a predefined number of K clusters (K ranging from 1 to 8). Prior information on sampling locations was provided. Structure Harvester software version 0.6.93 (Earl and Vonholdt, Reference Earl and Vonholdt2011) was used to analyse the output of Structure program, to identify the optimal of clusters from K = 1 to 8. The ad hoc statistic ΔK, based on the rate of change in the log probability between successive K values, was used to detect the optimal numbers of clusters (Evanno, Regnaut and Goudet, Reference Evanno, Regnaut and Goudet2005). Distruct software version 1.1 (Rosenberg, Reference Rosenberg2004) was used for graphical display. GSView software version 5.0 (Lang, Reference Lang2012) was used to view Distruct postscript output. GenAlex software version 6.5b5 (Peakall and Smouse, Reference Peakall and Smouse2012) was used for principal coordinate analysis (PCoA). The PCoA axes 1 (PC1) and 2 (PC2) were used to plot graphs.
Results
Genetic variability
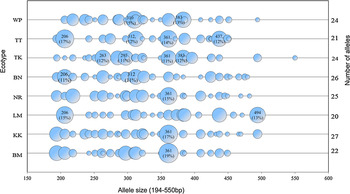
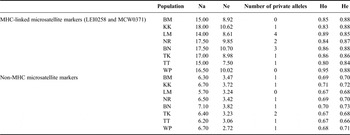
All MHC-linked and non-MHC markers typed were polymorphic with a total of 140 alleles, of which 56 (40 percent) were identified in MCH-linked markers (Supplementary Table S1). Out of 56 alleles in MHC region, 46 alleles (194–550 bp) were observed in LEI0258 (Figure 1) and 10 for MCW0371 (198–207 bp). Observed number of alleles per locus ranged from 6 (ADL0268) to 46 (LEI0258). Twenty private alleles (14.3 percent of the total 140 alleles) were observed across eight IC populations (Table 1), of which 12 were detected in LEI0258 and 8 for non-MHC markers. Lamu ecotype had a higher number of private alleles compared with other ecotypes.
MHC-linked microsatellite marker LEI0258 allele frequencies in eight IC ecotypes. Alleles are identified by length in base pairs below and number of alleles per ecotype.

Allelic patterns (Na, Ne, number of private alleles and He) in MHC-linked and non-MHC microsatellite markers across eight IC ecotypes in Kenya.

The Na and Ne per population were higher for MHC-linked markers compared with non-MHC markers (Table 1). Na per ecotype at MHC-linked markers ranged from 15.00 to 18.00 compared with 6.20 to 7.21 for non-MHC markers. Na for LEI0258 was higher than all other markers, ranging between 20 and 27 (Figure 1). Among the ecotypes, KK had the highest but LM the lowest Na. MHC-linked markers had slightly higher levels of heterozygosity compared with non-MHC markers. Ho values per population ranged from 0.80 to 0.95 and from 0.67 to 0.71 for MHC-linked and non-MHC markers, respectively. He was higher for MHC-linked markers (0.84–0.88) than non-MHC loci (0.66–0.73). Values for He were slightly less than Ho in LM and TT at MHC-linked and non-MHC markers, respectively.
Fst values varied between 0.01 and 0.03 for MHC-linked markers compared with 0.01–0.05 for non-MHC markers. Higher Fst values were observed for LM ecotype compared with the other populations. Ds and Dc between populations were higher in MHC-linked markers compared with non-MHC markers. Ds ranged from 0.02 to 0.33 and Dc from 0.13 to 0.46. Relatively long genetic distances were recorded between LM and the other ecotypes. Percentage of molecular variance for MHC-linked and non-MHC markers were high within individuals (>89 percent) compared among the ecotypes (<4 percent) and within individuals (<8 percent). A significant correlation between the genetic distances and geographic distances was observed. On average, MHC-linked markers produced a lower correlation coefficient (r) of 0.65 compared with 0.78 in non-MHC markers.
Population clustering
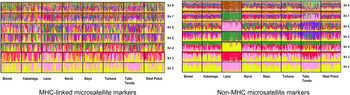
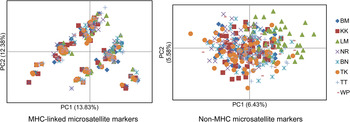
The ad hoc statistic ΔK detected the true numbers of clusters to be three for MHC-linked markers and two in non-MHC markers (Figure 2). PCoA-based principal coordinates 1 and 2 indicated three groups for MHC-linked markers and two in non-MHC markers (Figure 3). Although MHC-linked markers grouped ICs into three clusters, individuals from different ecotypes overlapped in principal coordinate space unlike distinct groups of LM (cluster one) and others (cluster two) for non-MHC markers.
Proportions of admixtures observed in the eight IC ecotypes for MHC-linked and non-MHC microsatellite markers.

PCoA plot based on genetic distance for individuals for non-MHC and MHC-linked microsatellite markers.

Discussion
Genetic variability
All MHC-linked and non-MHC markers were highly polymorphic. Number of alleles including private alleles and their apparent difference in distribution across the ecotypes indicated the existence of genetic diversity between the populations. The genetic variations have been caused by differences in ancestral origin, migration routes, hybridization of origins, genetic drift, mutation and natural selection. ICs are anticipated to have multiple origins from wild ancestors in South Asia and Island Southeast Asia and have been introduced to Kenya through several entry points (Lyimo et al., Reference Lyimo, Weigend, Janßen-Tapken, Msoffe, Simianer and Weigend2013; Mwacharo et al., Reference Mwacharo, Bjørnstad, Han and Hanotte2013a, Reference Mwacharo, Nomura, Hanada, Amano, Han and Hanotte2013b). After introduction of ICs to Kenya, they spread separately via marine and multiple terrestrial routes (Mwacharo et al., Reference Mwacharo, Bjørnstad, Han and Hanotte2013a, Reference Mwacharo, Nomura, Hanada, Amano, Han and Hanotte2013b) and their variations could be due to adaptation to the local environmental conditions provided by the specific route. Ancestors of LM ecotype are anticipated to have originated from Asia and distributed to Kenya and Tanzania through common water body of Indian Ocean. Lamu ecotype has a local name as “Kuchi” which is similar in name to Kuchi ecotype in Tanzania. Kuchi chicken in Tanzania is similar to Shamo game birds from “Kōchi” Prefecture of Shikoku Island in Japan and its thought to be its origin (Lyimo et al., Reference Lyimo, Weigend, Janßen-Tapken, Msoffe, Simianer and Weigend2013). Genetic diversity of IC ecotypes might have been contributed by cross-breeding with chicken breeds from Asia and Europe. Cross-breeding started in 1950s in Kenya and was widely spread in the country through cockerel/pullet exchange programme initiated in 1976 (FAO, 2007).
Number of alleles for LEI0258 per ecotype varied from 20 to 27 in the present study are in the same range as reported for Kuchi (22) and Medium (23) ecotypes in Tanzania (Lwelamira et al., Reference Lwelamira, Kifaro, Gwakisa and Msoffe2008). Allelic diversity in MHC-linked markers is higher than non-MHC markers. The reason why the MHC region is so allele-rich and highly diversified is because survival is associated with additive allelic effects at the MHC locus (Eyto et al., Reference Eyto, McGinnity, Consuegra, Coughlan, Tufto, Farrell, Megens, Jordan, Cross and Stet2007) and pathogen-driven selection (Nielsen, Reference Nielsen2005). Such polymorphism of MHC region in ICs is maintained by pathogen-driven balancing selection because of varying pathogen resistance over space and time (Hughes and Nei, Reference Hughes and Nei1989; Hedrick, Lee and Garrigan, Reference Hedrick, Lee and Garrigan2002). ICs studied are kept under harsh scavenging tropical conditions of varying heat stress and frequent disease outbreaks. A higher allelic diversity in the MHC region boosts IC's ability to tolerate disease challenges. However, this study did not prove the additive allelic effects of MHC locus.
Heterozygosity values for MHC-linked markers were higher than for non-MHC markers and in agreement with findings by Chazara et al. (Reference Chazara, Chang, Bruneau, Benabdeljelil, Fotsa, Kayang, Loukou, Osei-Amponsah, Yapi-Gnaore, Youssao, Chen, Laan, Tixier-Boichard and Bed'Hom2013) using wild species and unselected chicken populations. Ho were slightly lower than He in TT and LM ecotypes, suggesting selection against heterozygotes (Mogesse, Reference Mogesse2007) and limited artificial selection (Dana, Reference Dana2011) in these populations. Comparatively high Fst, Ds and Dc for LM population to the other ecotypes are as a result of restricted gene flow because of separation by Indian Ocean. Mantel test revealed positive correlation between genetic and geographic distances. Populations were sampled from eight different regions which are far apart (67–840 km) and the geographic distances had influence on the genetic structure of the farthest population (LM).
Population clustering
Studying the genetic variability of ICs would be important in establishing whether the whole population may be treated as a single gene pool or whether it should be subdivided. Cluster analysis using MHC-linked markers indicated three genetically mixed clusters (i.e. each cluster is composed of individuals from all the ecotypes). Such clustering suggested similar directional selection in the MHC region of chicken clustered together. However, this study did not prove if the MHC is under selection.
Non-MHC markers grouped ICs into two groups, LM (cluster one) and the other cluster composing of seven ecotypes (cluster two). Distinctness of LM from other IC populations indicated genetic uniqueness which could be as results of physical, geographical and socio-economic isolation of the populations. Main population barrier is Indian Ocean which isolated Lamu region from mainland. Population in cluster two are similar because of geographically proximity where, Western, North Rift valley and South Rift valley regions are very close, so it is easy for ICs to mix. Sharing of common routes from Nairobi to Turkana via Narok, Bomet, Siaya, Kakamega, and West Pokot might have made easier movement of ICs in these regions. Furthermore, residents of Western, North Rift valley and South Rift valley regions are sharing common working environment (huge tea plantations in Bomet, Kericho and Nandi counties). Interaction in such working place might have promoted the exchange of IC genetic material in form of gifts. Common cultures, living customs and intermarriages of tribes might have promoted frequent gene flow in the regions. Conversely, human interactions through trading between the studied regions as well as Kenya and other countries have led to mixing of chicken (Mwacharo et al., Reference Mwacharo, Nomura, Hanada, Amano, Han and Hanotte2013b).
Conclusion
Kenyan ICs belong to two to three genetically distinct groups (LM and others). Different markers systems have different clustering system. MHC-linked markers divided ICs into three mixed clusters, composing of individuals from the different ecotypes whereas non-MHC markers grouped ICs into two groups (LM and others). These IC ecotypes host many and highly diverse MHC-linked alleles. Higher allelic diversity indicated a huge amount of genetic variation in the MHC region of IC and supported their reputation of being hardy and resistant to diseases. Natural balanced selection driven by pathogen has enabled ICs to maintain genetic diversity which is crucial for adaptation to harsh scavenging conditions and local disease challenges.
Supplementary Materials
Supplementary materials of this paper is available at http://journals.cambridge.org/AGR
Acknowledgements
The authors are grateful to the Wageningen University, Koepon foundation and Indigenous Chicken Improvement Programme for funding this study.