INTRODUCTION
The radiocarbon concentration of oceans depends on the complex combination of surficial 14CO2 exchange with the atmosphere and mixing processes involving 14C-depleted deep waters (Stuiver et al. Reference Stuiver, Pearson and Braziunas1986). For this reason, the marine environment exhibits lower 14C activity in comparison with the atmosphere, a phenomenon known as the marine reservoir effect (MRE), being R(t), as first defined by Stuiver et al. (Reference Stuiver, Pearson and Braziunas1986), which is the difference between conventional 14C ages of samples grown contemporaneously in the atmosphere and the other carbon reservoir.
The MRE is reflected in the difference (in 14C yr) between the marine calibration curve Marine13 and, for the Northern Hemisphere, the atmospheric IntCal13 (Reimer et al. Reference Reimer, Bard, Bayliss, Beck, Blackwell, Bronk Ramsey, Grootes, Guilderson, Haflidason, Hajdas, Hatté, Heaton, Hoffmann, Hogg, Hughen, Kaiser, Kromer, Manning, Niu, Reimer, Richards, Scott, Southon, Staff, Turney and van der Plicht2013). This global time-dependent offset Rg(t) has an average value of about 400 14C yr (between AD 1350 and 1850) (Hughen et al. Reference Hughen, Baillie, Bard, Beck, Bertrand, Blackwell, Buck, Burr, Cutler, Damon, Edwards, Fairbanks, Friedrich, Guilderson, Kromer, McCormac, Manning, Bronk Ramsey, Reimer, Reimer, Remmele, Southon, Stuiver, Talamo, Taylor, van der Plicht and Weyhenmeyer2004). However, the marine curve was created from a global model (Reimer et al. Reference Reimer, Bard, Bayliss, Beck, Blackwell, Bronk Ramsey, Grootes, Guilderson, Haflidason, Hajdas, Hatté, Heaton, Hoffmann, Hogg, Hughen, Kaiser, Kromer, Manning, Niu, Reimer, Richards, Scott, Southon, Staff, Turney and van der Plicht2013) that does not consider possible variations of 14C concentration in the ocean surface associated with local factors. Phenomena related to ocean circulation produce a regional deviation ∆R from the global value Rg(t) (Stuiver and Braziunas Reference Stuiver and Braziunas1993; Ascough et al. Reference Ascough, Cook and Dugmore2005), which in first approximation is not time dependent (Stuiver and Braziunas Reference Stuiver and Braziunas1993).
The determination of ∆R values is essential for accurate calibration of 14C dates of marine samples. Currently, there are only a few studies estimating ∆R values for the coast of Cuba (Cooper and Thomas Reference Cooper and Thomas2012; Roksandic et al. Reference Roksandic, Buhay, des Armas, Súarez, Peros, Roksandic, Mowat, Vieira, Arredondo, Fuentes and Smith2015) that take into account reported values for nearby regions.
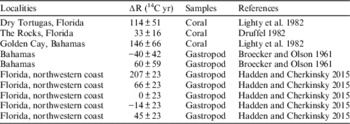
For the Gulf of Mexico and adjacent western central Atlantic, the marine reservoir database (http://calib.qub.ac.uk/marine/) reports ∆R values from −40±42 to 207±23 14C yr (Table 1). The most recent of these studies (Hadden and Cherkinsky Reference Hadden and Cherkinsky2015) proposes a mean ∆R value of −9±25 14C yr for the northwest Florida Panhandle after dating known-age gastropod shells. Other recent works not included in the mentioned database present some results for this region. Wagner et al. (Reference Wagner, Guilderson, Slowey and Cole2009) show an average value of ∆R =−36±25 14C yr for the Gulf of Mexico obtained by the 14C dating of modern (AD 1950) corals. Using 232Th/230Th dating for corals (AD 3000 and 5000) and comparing the results with 14C ages, the values shown in Druffel et al. (Reference Druffel, Robinson, Griffin, Halley, Southon and Adkins2008) indicate a ∆R of approximately –25 14C yr for the southeast coast of Florida. The only Cuban value is reported by Cooper and Thomas (Reference Cooper and Thomas2012), who indirectly estimated a ∆R of –70±40 14C yr for the northern coast of Cuba.
∆R values reported on the marine reservoir database for regions nearby the north Cuban coast, sorted by distance from Havana.

The present work is the first of a series of studies aiming to determine the regional offset correction ∆R for the Cuban coasts beginning with the analyses of samples from the northwestern region.
MATERIALS AND METHODS
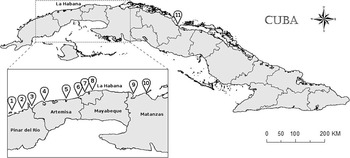
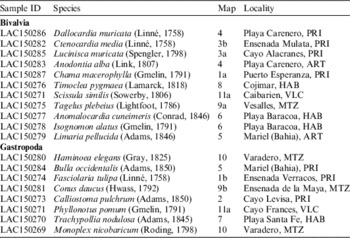
For the present study, we have selected a group of 19 marine mollusk shells of different species (Table 2). The specimens were donated by the malacology section of the Felipe Poey Museum, at the Havana University. The shells analyzed were collected between AD 1927 and 1952 along the northwestern coast of Cuba (Figure 1).
Map of study area and localities of known-age pre-bomb shells analyzed from the Felipe Poey Museum.

Species and collection localities of studied samples. Map numbers correspond to Figure 1.

Suitability for representing the local marine environment was a concern, especially when selecting gastropod species. It is well known that some species of herbivorous gastropods scrape microflora from the rock and may incorporate old carbonates during shell formation (Reimer et al. Reference Reimer, McCormac, Moore, McCormick and Murray2002; Hadden and Cherkinsky Reference Hadden and Cherkinsky2015). Other deposit-feeding species may ingest detritus of variable ages affecting the 14C concentration in the shell (Hogg et al. Reference Hogg, Higham and Dahm1998; Reimer et al. Reference Reimer, McCormac, Moore, McCormick and Murray2002). These habits can result in erroneous ages when dating the shell, making it inappropriate for ∆R estimation. In a preliminary unpublished work, samples of three three mollusk species of the Neritidae family—Nerita perolonta (Linnaeus 1758), Nerita tessellata (Gmelin 1791), and Puperita pupa (Linnaeus 1767)—had been dated. The results obtained showed 14C ages between 1200 and 2600 yr BP for shells collected in the AD 1940–1950 period. These species are commonly found on the Cuban coast and are known for their scraping behavior.
The samples were selected under the supervision of the museum curator of the malacology section, prioritizing bivalve species and avoiding some gastropod species, which are known to be scrapers. Special care was taken to select specimens that were certainly collected alive or close to the death date (e.g. periostracum intact, shiny appearance without bleaching, presence of operculum; and lack of epibionts in the inner surface of shell) (Hadden and Cherkinsky Reference Hadden and Cherkinsky2015).
The shells were prepared at the Radiocarbon Laboratory of the Universidade Federal Fluminense (LAC-UFF) following standard protocols (Macario et al. Reference Macario, Gomes, Anjos, Carvalho, Linares, Alves, Oliveira, Castro, Chanca, Silveira, Pessenda, Moraes, Campos and Cherkinsky2013, Reference Macario, Oliveira, Carvalho, Santos, Xu, Chanca, Eduardo, Jou, Oliveira, Pereira, Moreira, Muniz, Linares, Gomes, Anjos, Castro, Anjos, Marques and Rodrigues2015a). Between 20 and 40 mg of each sample were etched with amounts of 0.1M hydrochloric acid from 1.9 to 3.4 mL to remove the outer layer of the shell (50% in mass) and subsequently reacted for 12–24 hr in vacuum with 1 mL of 85% phosphoric acid to obtain carbon dioxide. The resulting gas was purified by means of dry ice/ethanol and liquid nitrogen traps (Macario et al. Reference Macario, Gomes, Anjos, Carvalho, Linares, Alves, Oliveira, Castro, Chanca, Silveira, Pessenda, Moraes, Campos and Cherkinsky2013). Graphitization was performed using zinc and titanium hydrate, with an iron catalyst as described in Xu et al. (Reference Xu, Trumbore, Zheng, Southon, McDuffee, Luttgen and Liu2007) at 520°C (Macario et al. Reference Macario, Oliveira, Carvalho, Santos, Xu, Chanca, Eduardo, Jou, Oliveira, Pereira, Moreira, Muniz, Linares, Gomes, Anjos, Castro, Anjos, Marques and Rodrigues2015a).
Sample 14C/13C measurements were performed using the 250kV SSAMS accelerator at the Physics Institute of the Universidade Federal Fluminense, Niterói, Brazil (Macario et al. Reference Macario, Gomes, Anjos, Carvalho, Linares, Alves, Oliveira, Castro, Chanca, Silveira, Pessenda, Moraes, Campos and Cherkinsky2013). OXII (NBS SRM 4990B) was used as a primary standard and processed IAEA-C2 was used as the control sample. 14C ages were calculated using LACAMS analysis software (Castro et al. Reference Castro, Macario and Gomes2015). The 14C dates were corrected using the online measured 13C/12C in the accelerator and the blank correction was performed on fraction modern with sea urchin skeleton with a known-age greater than 50 kyr.
RESULTS AND DISCUSSION
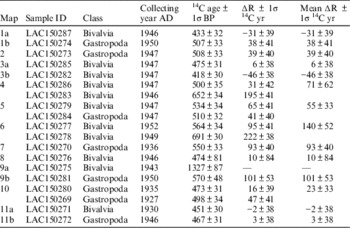
The obtained 14C ages and corresponding ΔR values are listed in Table 3. Most 14C dates are within 400 and 700 14C yr, except for sample LAC150275, which corresponds to a deposit-feeding bivalve mollusk species (Holland and Dean Reference Holland and Dean1977), the shell of which could have been affected by the incorporation of old carbon. The other possible explanation could be a discrepant local reservoir effect. The collection place is located within the Matanzas Bay, surrounded by the city of the same name, where two rivers (Yumuri and San Juan) flow into the sea. The rivers could be a source of old-carbon due to either the local geology (carbonate rocks are present in this area) or human activity. As the unavailability of more samples prevents us to prove either hypothesis, this result was discarded in our analysis.
Radiocarbon results and ∆R values grouped by locality.

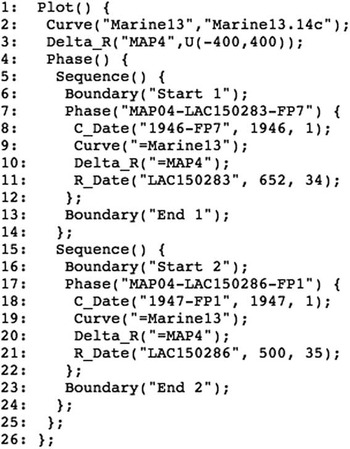
The ∆R value for individual samples was obtained following a straightforward method for known-age samples (Stuiver et al. Reference Stuiver, Pearson and Braziunas1986; Russell et al. Reference Russell, Cook, Ascough, Scott and Dugmore2011). However, to determine the “mean” value for the localities with two samples, we decided to use Bayesian methods to obtain a probability distribution for ∆R (Alves et al. Reference Alves, Macario, Souza, Pimenta, Douka, Oliveira, Chanca and Angulo2015a, Reference Alves, Macario, Souza, Aguilera, Goulart, Rita Scheel-Ybert, Bachelet, Carvalho, Oliveira and Douka2015b; Carvalho et al. Reference Carvalho, Macario, De Oliveira, Oliveira, Chanca, Alves, Souza, Aguilera and Douka2015; Macario et al. Reference Macario, Souza, Trindade, Decco, Lima, Aguilera, Marques, Alves, Oliveira, Chanca, Carvalho, Anjos, Pamplona and Silva2014, Reference Macario, Souza, Aguilera, Carvalho, Oliveira, Alves, Chanca, Silva, Douka, Decco, Trindade, Marques, Anjos and Pamplona2015b). Figure 2 shows the Chronological Query Language (CQL) used to determine ∆R using the OxCal software (Bronk Ramsey and Lee Reference Bronk Ramsey and Lee2013).
Sample script used to determine the probability distribution of ∆R in the OxCal program.

This code takes into account the collection year of the mollusks (lines 8 and 18) and the measured 14C ages of the samples (lines 11 and 21). The latter are calibrated using the marine curve Marine13 (line 2), leaving a common ∆R (lines 10 and 20) undefined between the interval −400 to 400 14C yr (line 3). The result is a probability distribution and the ∆R reported at the last column of Table 3 is the mean value of the distribution with 1σ uncertainty (68.2% probability). This model can be easily extended to find a most probable common ∆R value for a larger group of samples.
The values found for ΔR are distributed from –46±38 to 140±52 14C yr. Usually positive values are associated with the upwelling phenomenon, whereas negative values can represent freshwater influence associated with the presence of lagoons and rivers. Considering the variability of the obtained results, we present two possible approaches to handle the data: (1) taking into account the possibility of actual spatial variations related to the local ocean dynamics; and (2) considering the statistical fluctuations of the results due to biological variations and measurement reproducibility.
(1) Several factors can influence the marine reservoir offset in this region, where complex ocean dynamics takes place. The northwestern coast of Cuba is influenced by the Caribbean and Gulf of Mexico marine currents (Simanca et al. Reference Simanca, Ramírez, Fernandez, Arriaza, Rodas, Esponda, Garcia, Alburquerque and Garcia2012): the Loop Current (Hofmann and Worley Reference Hofmann and Worley1986) that has its origin in the warm water incoming through the Yucatan Channel from the Caribbean Sea, crossing through the Straits of Florida; and the Cuban Countercurrent (Emilsson Reference Emilsson1971; Ochoa et al. Reference Ochoa, Sheinbaum, Badan, Candela and Wilson2001; Perez-Santos et al. Reference Perez-Santos, Schneider and Fernández-Vila2015).
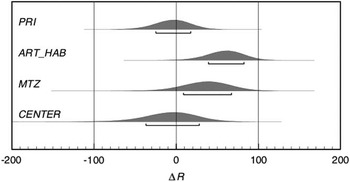
The results obtained indicate a possible pattern of increasing values towards location 6 in the map (MAP6), where ΔR reaches the highest value. In this approach, we can group samples by geographic regions and apply the above code to obtain a probability distribution for each region (Figure 3). If we look separately at the coasts of Pinar del Rio (MAP1-3) with its mean value of ∆R=–4±21 14C yr, Artemisa-Havana (MAP4-8) with ∆R =61±22 14C yr, Matanzas (MAP9-10) with ∆R =38±29 14C yr, and central region (MAP11) with ∆R =–4±32 14C yr, a possible pattern is observed, where the first and the latter groups have lower ΔR values.
∆R probability distribution for regional groups: PRI: MAP1-3; ART_HAB: MAP4-8; MTZ: MAP9-10; and CENTER: MAP11.

The negative values in the first group can be associated with freshwater influence. Puerto Esperanza (MAP1a) directly receives intermittent riverine discharge. It is a very muddy, boggy, and murky place with some small lagoons near the coast, which also may have runoff areas. Ensenada Mulata (MAP3b) receives four rivers with effluents coming from Pan de Guajaibón, west of Sierra del Rosario and Cajalbana. This coast is also swampy and muddy, and there may be terrigenous runoff and freshwater. The entire area of this group presents a wider and more gradual platform than in the Havana and Matanzas groups, where the geology of the coast is mostly rocky.
The second and third groups seem to be more influenced by upwelling. A simulation study (Arriaza et al. Reference Arriaza, Hernandez, Lorenzo, Olivera, Rodas, Montesino, Carillo, Almeida, Siamanca and Padron2012) has shown a complex circulation of currents and countercurrents in the northwestern Cuban coast. This behavior produces eddies that can lead to upwelling. Extreme phenomena like hurricanes and cold fronts are also common in this area and can cause mixing of ocean water. Even though these factors are seasonal, the stratification of the water column can occur at any time of year due the influence of the wind and tide.
(2) Despite the variation in local offset, it is possible to assume a common ΔR for the whole northwestern coast of Cuba. To estimate a mean value for this region, we made the following considerations. First, the locality of MAP11 is situated away from all the others, toward the Cuban central region (see Figure 1). We decided then to use only the first 10 locations, excluding samples LAC150271 and LAC150272 and leaving MAP11 because of their different ∆R values. On the other hand, if we apply a chi-squared test (Ward and Wilson Reference Ward and Wilson1978) to the remaining set of ∆R values, it fails (Tc=49.25 higher than χ2 0.05=25.00) due to samples LAC150278 and LAC150283 exhibiting obviously higher values. A better estimate is achieved by excluding these samples (Tc=14.76, χ2 0.05=22.36), assuming there is no specific explanation for these higher values and the variation is only related to statistics.
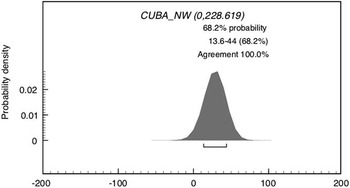
Applying a similar code to the one used in Figure 2 and considering selected samples as belonging to a unique location with a common ∆R value, we found the probability distribution with a mean value of 28±13 14C yr for the northwestern coast of Cuba (Figure 4).
∆R probability distribution and mean value for the Cuban northwestern region.

CONCLUSIONS
The present work presents the first estimation of local variations of MRE in Cuba. The results obtained vary from –46±38 to 140±52 14C yr at 14 different locations on the northwestern Cuban coast. However, these variations may be associated with both local effects and the small quantity of measured samples. For the moment, until further studies with more samples (which are not yet available) are made, we propose a ∆R =28±13 14C yr as a mean value for the northwestern region of Cuba.
ACKNOWLEDGMENTS
This work was supported by the Brazilian financial agencies CNPq (Conselho Nacional de Desenvolvimento Científico e Tecnológico), CAPES (Coordenação de Aperfeiçoamento de Pessoal de Nível Superior), FAPERJ (Fundação Carlos Chagas Filho de Amparo à Pesquisa do Estado do Rio de Janeiro), and PRONEX (Programa de Apoio a Núcleos de Excelência). The authors would like to thank the Felipe Poey Museum and the Biology Faculty of Havana University for the shells donated for this study.