Ethnic Diversity and Trust
Much recent attention within the social capital literature has focused on the effect of cultural and ethnic diversity on civic attitudes and behaviour. Drawing on psychological theories of social identity and inter-group conflict,Footnote 1 political commentators and academic scholars alike have drawn quite pessimistic conclusions about the effects of ethnic diversity on community cohesion and the provision of public goods.Footnote 2 Perhaps most notable in this regard is Robert Putnam’s recent account of the negative consequences of ethnic diversity on both inter-ethnic and intra-ethnic trust in the United States. Drawing on wide-ranging analysis of the Social Capital Community Benchmark (SCCB) survey, Putnam contends that ethnic diversity causes people to ‘hunker down’, ‘to withdraw from collective life, to distrust their neighbours, regardless of the colour of their skin’.Footnote 3
Others have come to similar conclusions, using independent data sources, alternative geographies and different measures of both trust and ethnic diversity. And, while some of the conclusions drawn from these analyses are rather more circumspect than Putnam’s, there appears to be a growing concern that ‘high levels of racial and ethnic heterogeneity are accompanied by lower levels of trust and other civic attitudes’.Footnote 4 And, as Putnam points out, such conclusions are particularly worrying for policy makers, given the historically high level of ethnic diversity in most Western democracies, a trend which is likely to increase in the future.Footnote 5
Yet, despite the prima facie plausibility of such concerns, there are several reasons to pause before we accept the strong claim that neighbourhood ethnic diversity represents a worrying corrosive influence on trust between citizens in multi-cultural societies. First, the vast majority of extant empirical investigations are based on data collected in North America and are hence of limited generality for addressing broad questions relating to the effect of ethnic diversity on trust. Second, on closer inspection, the pattern of findings in existing research is rather more nuanced and inconsistent than might, at first sight, appear to be the case. In particular, empirical scholars have paid insufficient attention to distinctions drawn in theoretical accounts between different kinds of inter-personal trust and how these should be measured empirically. Finally, existing studies have placed greater emphasis on the statistical than on the substantive significance of the diversity–trust relationship. Thus, while we may not be able to reject the null hypothesis of zero correlation in the population, it is not yet clear that the magnitude of the association between diversity and trust should really be a cause for concern with regard to the future well-being of multi-cultural societies.
Our aim in this article, then, is to question the view that ethnic diversity has a strong, linear influence on the extent to which citizens trust one another and, instead, to highlight its essentially weak and contingent nature. By contrast, neighbourhood socio-economic deprivation and the degree of social integration of individuals within their communities are, we argue, more appropriate sites of academic and policy concern. The article proceeds as follows. First, we review in more detail the existing evidence base relating to the effect of ethnic diversity on trust. Next, we describe the data and key measures to be used in our statistical models, before presenting the results of these analyses. We conclude with a discussion of the implications of our findings for our understanding of how, if at all, the ethnic diversity of a neighbourhood affects the interpersonal trust of its residents.
The existing evidence
American Exceptionalism?
As we noted above, the majority of published accounts of the diversity–trust relationship are based on North American data.Footnote 6 This does not, in itself, problematize the statistical analyses underpinning the conclusions of these studies. However, the limited range of contexts in which the negative association between community diversity and trust has been observed has implications for the generality of the conclusions that have been drawn.Footnote 7 For, if racial and ethnic heterogeneity really do cause people to ‘hunker down’ and view one another with distrust and suspicion, we should expect this effect to generalize to most, if not all, social and political contexts.
It is entirely plausible, though, that the effect of ethnic diversity on civic attitudes is particular to the specific political and historical context in which the current level of ethnic diversity was instantiated.Footnote 8 In the United States, for instance, the ethnic diversity of most neighbourhoods is highly tainted by the legacy of eighteenth- and nineteenth-century slavery and its social and political aftermath in the twentieth and twenty-first centuries. This is a feature of inter-ethnic identity which is considerably less salient in Britain and other European countries with significant proportions of black citizens. In short, the nature and implications of ethnic diversity is highly historically contingent, and we cannot assume, without evidence, that associations observed in one context will generalize in a straightforward manner to others. And, indeed, in the analyses that have been conducted in contexts outside of North America, the results and conclusions drawn have been considerably more equivocal about the influence of diversity on social capital. Letki, for example, finds no effect of ethnic diversity on social interaction within local communities in Britain, once the degree of economic deprivation of neighbourhoods has been taken into account,Footnote 9 while Leigh finds no effect of ethnic or linguistic fractionalization on a measure of generalized trust in the Australian context.Footnote 10
The possibility of ‘American exceptionalism’, of course, echoes critiques of Putnam’s broader thesis of America’s civic decline since a notional heyday in the 1950s. The failure to corroborate the long-term decline in trust and associational membership in comparable socio-political contexts questions the universalistic nature of the proposed causal mechanisms.Footnote 11 The research we report on here will, we hope, go some way towards redressing this comparative imbalance.
Contact or Conflict?
Putnam’s account of the effects of immigration and ethnic diversity contrasts two opposing mechanisms from the social psychological literature on inter-group contact. On the one hand, while diversity might serve to improve inter-ethnic relations by replacing unfounded negative beliefs and stereotypes with more positive evaluations derived through direct contact, ‘contact theory suggests that diversity erodes the in-group/out-group distinction and enhances out-group solidarity or bridging social capital, thus lowering ethnocentrism’.Footnote 12 On the other hand, conflict theory suggests that interaction between different ethnic groups will, as the name suggests, result in tension and hostility, primarily through competition for scarce resources and access to public goods, but also through innate psychological processes of in-group and out-group identification.Footnote 13 However, while these mechanisms of conflict and contact are presented as alternative or competing explanations, it seems more reasonable to anticipate that both processes will operate in tandem in most neighbourhoods.Footnote 14 That is, for some individuals, direct contact will reduce distrust of those from ethnic out-groups; while, for others, the appearance of new ethnic groups in a neighbourhood will lead to avoidance of social contact and the development, or exacerbation, of existing stereotypes and out-group mistrust.
An appropriate test of this contingent view of the contact/conflict mechanisms requires the estimation of the interaction between ethnic diversity and the level of interpersonal contact between an individual and the residents of his or her neighbourhood, in addition to the main effect of diversity. This type of multiplicative specification allows the degree of contact to determine whether diversity results in conflict or harmony; where contact with neighbours is low, we might expect a corrosive effect of diversity on trust, but where it is high, diversity may have little or no effect. In the only existing empirical investigation to date of this potential non-linearity, Stolle et al., using data from the 2005 US Citizenship, Involvement, Democracy (CID) survey, find a positive interaction between perceived ethnic diversity and degree of social contact.Footnote 15 We develop this more optimistic line of inquiry here by testing the moderating effect of social contact on the diversity–trust relationship in the British context. We are able to build on the work of Stolle et al. by using an independent measure of neighbourhood ethnic diversity, rather than the self-reported perceptions of survey respondents, which are susceptible to various forms of endogeneity bias.Footnote 16
To assess the conflict hypothesis properly, it is also important to include the moderating effect of economic deprivation in the neighbourhood on levels of expressed trust. This is because conflict theory is based on the assumption that conflict arises due to a perceived threat that immigrants pose to scarce labour-market opportunities, social housing and other public services, which in turn gives rise to out-group hostility and the propagation of negative stereotypes. As Ross et al. put it, ‘mistrust is the product of an interaction between person and place but the place gathers those who are susceptible and intensifies their susceptibility’.Footnote 17 If conflict theory is correct, it follows that we should observe stronger negative effects of ethnic diversity in more economically deprived areas, where competition for material resources and the perception of immigrants as competing for such resources will be at its greatest. In our analysis, then, we also allow the effect of ethnic diversity to be contingent upon the degree of economic deprivation of neighbourhoods.
Heterogeneity of Empirical Approaches
Our ability to arrive at general conclusions about the diversity–trust relationship is also hampered by the wide variety of model specifications, geographies and measures of ethnic diversity and trust that have been employed in the literature to date. For instance, while some scholars have focused on single metropolitan areas,Footnote 18 others have used nationally representative samples at the same level of geography,Footnote 19 or smaller geographical units such as census tracts.Footnote 20 Similarly, some analysts have employed ‘multi-level’ model designs which account for the non-independence between individuals within the same geographical units,Footnote 21 while others treat the data as if it were a simple random sample.Footnote 22 This wide range of approaches to model specification extends to the use of key measures; with diversity measured using, variously, racial and ethnic fractionalization;Footnote 23 indices of linguisticFootnote 24 and birthplace fragmentation;Footnote 25 percentage ‘visible minority’;Footnote 26 proportion of largest ethnic groupFootnote 27 and respondent assessments of neighbourhood diversity.Footnote 28
Most importantly, perhaps, while it is clear from theoretical accounts that there exist different forms of interpersonal trust,Footnote 29 in the ethnic diversity literature trust has generally been treated in a conceptually undifferentiated manner; diversity erodes trust but it is not always made clear what kind of trust is being referred to.Footnote 30 The most important distinction with regard to forms of trust is between, on the one hand, trust in people with whom we are personally acquainted and, on the other, a more diffuse trust in one’s fellow citizens, the vast majority of whom will not be personally known to the individual making the trust evaluation.Footnote 31 Uslaner refers to the first type of trust in known others as ‘strategic’, while trust in people who are not personally known to us is designated ‘generalized’ trust.Footnote 32 While strategic trust is a matter of rational risk calculation, based on previous experience with the social actor in question,Footnote 33 trust in people we have never met should be considered more akin to a social value, or an evaluation of the moral standards of the society in which we live.Footnote 34
The distinction is crucial, for the sorts of societal returns which make social capital theory so normatively appealing are generally posited to derive more from the generalized than the particularized form of trust.Footnote 35 Societies that are able to foster and maintain collective beliefs about the goodwill of the ‘generalized other’ can reap the substantial collective and individual benefits of norms of reciprocity and co-operation.Footnote 36 The same is not necessarily true, though, of the strategic trust that develops between individuals who are personally acquainted with one another. Indeed, ‘thick’ trust can equally well give rise to malign social phenomena, such as ethnocentricism, terrorist cells and criminal gangs, the so-called ‘dark-side of social capital’.Footnote 37 As Uslaner puts it, ‘strategic trust can only lead to cooperation among people you have gotten to know, so it can only resolve reasonably small-scale problems’.Footnote 38 Clearly, then, the implications of a negative relationship between neighbourhood ethnic diversity and trust are rather different, depending on the kind of trust in question.
So, does ethnic diversity drive down generalized trust, strategic trust, or both? The answer is, it is difficult to tell, because investigators have not only been ambiguous about which kind of trust they refer to,Footnote 39 they have also used a variety of rather different measures, as if they were coterminous with one another. Although the majority of analysts have used some version of the standard generalized trust question (henceforth GTQ), in which respondents are asked to choose whether ‘most people can be trusted’, or ‘you can’t be too careful in dealing with people’,Footnote 40 others have used ‘wallet return’ questions,Footnote 41 a ‘Trust in Neighbours’ question (henceforth TiN), in which respondents are asked how many of the people in their neighbourhood can be trusted;Footnote 42 as well as some more unusual variants.Footnote 43
Yet, although they all relate ostensibly to the concept of interpersonal trust, these items do not measure the same thing. Uslaner, for instance, uses factor analysis of questions about trust in a range of different social groups and institutions to show that the TiN item does not load uniquely on the same factor as items referring to trust in groups that the individual does not know personally.Footnote 44 Similarly, Sturgis and Smith use ‘thinkaloud protocols’ to demonstrate that responses to the TiN item predominantly reflect trust evaluations of people personally acquainted with the respondent, rather than more abstract evaluations of people in general.Footnote 45 They also show that, for the GTQ, the opposite pattern is observed; respondents asked this question mainly think of individuals and groups with whom they are not personally acquainted when formulating a response.Footnote 46 Thus, although the distinction cannot be drawn in a neat or precise manner, the GTQ seems to tap into the generalized form of trust, while the TiN appears to be a mix of trust in strangers and the more strategic, or ‘thick’ variety of trust in known others.
One might be tempted to conclude that this heterogeneity of approaches lends robustness to the conclusion that diversity does indeed erode trust. And such an observation would be accurate if a consistent pattern of findings had been observed across the range of geographies and measures employed. However, on closer inspection, anomalous and inconsistent findings are frequently evident. For instance, using the 1976 Detroit Area Study, Marschall and Stolle find ethnic fractionalization of census tracts to be positively correlated with the GTQ,Footnote 47 while Leigh, Soroka et al., and Costa and Kahn find no significant association between ethnic fractionalization and the GTQ using Australian, Canadian and US, and US data, respectively.Footnote 48 Similar non-significant findings are apparent when the geographical focus is on countries rather than neighbourhoods. Hooghe et al. find only ‘in-migration of workers’ to be significantly correlated with the GTQ from amongst a host of indicators of ethnic diversity in a multi-level analysis of the European Social Survey,Footnote 49 while Anderson and Paskeviciute find no relationship between ethnic heterogeneity and the GTQ using the 1999–2001 World Values Survey.Footnote 50
These anomalous findings, of course, must be weighed against the large number of studies (including some of those cited above) that do find significant negative associations using different measures of both trust and ethnic diversity.Footnote 51 Our point in highlighting these inconsistencies, though, is not to argue that ethnic diversity is unrelated to trust but to show that the relationship is far from consistent and uniformly negative. Whether a significant relationship is observed or not appears to be dependent, inter alia, on the socio-cultural context examined, key measures, model specification and the level of geography employed.
Statistical qua Substantive Significance
A final aspect of the existing evidence base that should lead us to question the generality and importance of the conclusion that ethnic diversity erodes trust relates to the tendency in existing studies to focus on the statistical significance of the main effect of ethnic diversity, rather than on the substantive magnitude of the (contingent) relationship. Yet, despite entrenched practice in quantitative social science, it is now well appreciated that all a significance test reveals is whether a model coefficient is non-zero in the population from which a sample is drawn, a potentially trivial observation in large and heterogeneous populations.Footnote 52
For instance, while the ‘p value’ for the ethnic diversity coefficient in Putnam’s 2007 analysis has an impressive four zeros after the decimal point, the (standardized) point estimate is just 0.02. This means that the independent effect of ethnic diversity accounts for less than one-tenth of 1 per cent of the total variability in trust in this model.Footnote 53 Where efforts have been made to place the magnitude of coefficient estimates on to a more meaningful yardstick, statistically significant ‘effects’ of ethnic diversity have sometimes turned out to be substantively trivial.Footnote 54 In our analysis here, then, we explicitly consider the substantive as well as the statistical significance of the association between diversity and trust.
Data and measures
The data used in this analysis come from the Taking Part Survey (TPS), an annual survey of adults in Great Britain, which has a stratified multi-stage sample design.Footnote 55 The first interviews in the TPS took place in July 2005 and have been conducted on a continuous basis since that time, with approximately 2,000 completed each month. The TPS achieved a response rate of 56 per cent in 2005/6 and 55 per cent in 2006/7, the years that we use in our analyses here. This is lower than desirable but certainly comparable to other face-to-face probability samples conducted in Britain at this time. The potential for non-response bias cannot be discounted but, we would argue, is less of a concern here because our analyses focus on associational rather than descriptive estimates. The primary purpose of the TPS is to measure the participation of different social and demographic groups across a broad range of sporting and cultural sectors. In addition, the TPS contains question modules on social and cultural capital.Footnote 56
The TPS has a number of advantages over alternative data sources for the purposes of our analysis here. First, it contains both the standard GTQ and the TiN item. Secondly, it has an extremely large sample size, with approximately 25,000 interviews conducted in total each year. Thirdly, owing to the policy requirement to assess both levels and annual change in participation within and across ethnic groups accurately,Footnote 57 the TPS contains an over-sample of black and minority ethnic (BME) groups. Finally, because the TPS implements a clustered sample design, we are able to study the influence of the characteristics of the neighbourhoods within which respondents live on their expressed levels of trust.
The TPS uses a standard sample design for random, face-to-face surveys in Britain, in which postcode sectors are randomly selected from the Postcode Address File with the probability of selection proportional to the size of the sector. An equal-sized sample of addresses is then selected at random within each sector and an individual randomly selected for interview from among the adult members (16+) in each selected address.Footnote 58 The over-sample of BME groups is achieved by means of focused enumeration.Footnote 59 FE works by sampling addresses adjacent to the main sample address. When contact is made with the main sample address, the interviewer asks whether any target individuals live in the adjacent addresses. If any such individuals are identified, the address in question is contacted and an interview attempted with a randomly selected individual at that household.
Defining Neighbourhoods
The clustered nature of the TPS sample design enables us to use a multi-level model, in which individual respondents are nested within ‘neighbourhoods’. Since postcode sectors are not a particularly meaningful level of geography with regard to neighbourhoods or local areas,Footnote 60 we use the recently created Super Output Area (SOA) classification. SOAs are an area classification produced by the Office for National Statistics for the release of small area census statistics from the 2001 Census onwards. Unlike previous geographies used for this purpose, such as electoral wards, SOAs have been designed with the intention that they are more homogeneous in size and remain stable over time, together with a view to maintaining ‘natural’ boundaries at a small area level.Footnote 61 SOAs are hierarchical in nature, with the smallest level being a census Output Areas (OA). OAs contain approximately 150 households and are grouped together on the basis of homogeneity of dwelling type and tenure. In addition to the agglomeration algorithm, initial OA definitions were sent to local authorities for feedback, to ensure that they did not cross any clear physical boundaries such as major roads or waterways.
The lowest level OAs are then grouped together using the same clustering criteria to form Lower Super Output Areas (LSOAs), which contain, on average, around 600 households. LSOAs are then combined in the same manner to form Middle Super Output Areas (MSOAs) which contain an average of 5,000 households. Upper Super Output Areas (USOAs) are planned for the future but have not yet been produced at this point in time. For this analysis, we have used MSOAs as our neighbourhood classification. This is because OA and LSOA would, on average, yield too few individuals per area for accurate estimation of random effects.Footnote 62 Our sample contains 3,927 MSOAs, with an average of 6.3 respondents per MSOA.
Neighbourhood Characteristics
Measures of neighbourhood characteristics are derived from population data made available from the 2001 Census, covering all of England, Scotland and Wales. The 2001 Census includes a range of items covering the geo-demographic and structural character of each neighbourhood. This is based on aggregated responses from all the individuals living within each defined area, with characteristics represented as proportions of the total. By using neighbourhood data from sources independent of the TPS, we are able to have greater confidence that they accurately represent the effect of neighbourhood differences, rather than the composition of the TPS sample within each selected area.Footnote 63 For the purposes of this analysis, data have been obtained from the Office for National Statistics on all 6,780 MSOA in England, with measures selected based on previous research that has incorporated the impact of neighbourhood socio-economic characteristics.Footnote 64
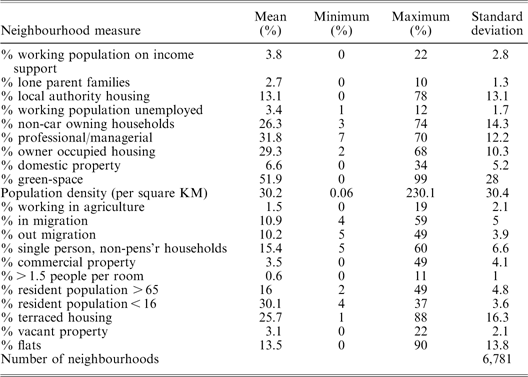
The measures cover the extent of economic disadvantage of the neighbourhood, the occupational structure, housing tenure and household types, residential mobility, the age structure of the area, and the amount of land classified as domestic, non-domestic and green-space. Table A1 in the Appendix provides summary details for these neighbourhood-level variables. Multicollinearity is a common problem with the use of neighbourhood-level data and this can lead to estimation problems, inflated standard errors and unstable results. To mitigate these problems, and for parsimony of exposition, we adopt a factorial ecology approach to generate a set of indices that summarize the strong correlations amongst the identified neighbourhood characteristics.Footnote 65
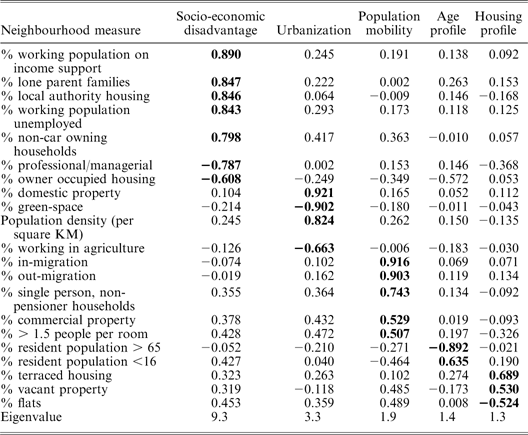
The factorial ecology approach involves subjecting the raw neighbourhood characteristic variables to a principal components analysis with oblique rotation. This yielded a five-component solution, using the retention criterion of eigenvalues >1.Footnote 66 The factor structure is very similar to that reported in previous factorial ecology studies in Britain.Footnote 67 The factor loading matrix for this five-component solution is presented in Table A2 in the Appendix. The five components represent the following five summary characteristics of neighbourhoods:
— economic deprivation
— urbanization
— in-migration and out-migration
— age structure
— housing stock.
Ethnic Diversity
The level of ethnic diversity of each MSOA is assessed using the Herfindahl fractionalization index, where:

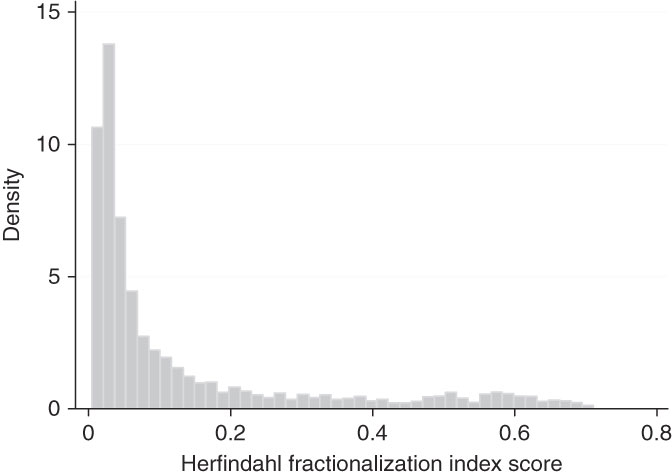
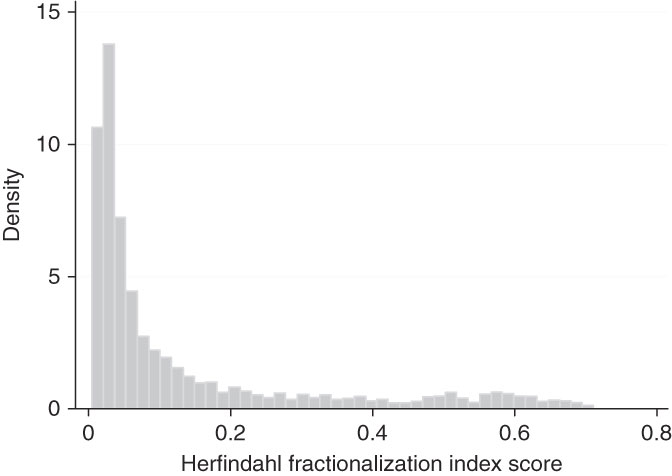
In this equation, si reflects the population share of ethnic group i, from a total of five groups: white, black, Asian, mixed and ‘other’ ethnic group. These are collapsed categories from the full census classification. We do not use the full ethnic classification from the Census due to the large number of empty cells when constructing the index at the MSOA level. This inevitably results in some rather crude aggregations across different ethnic groups but is unlikely to affect our results and conclusions, because there is a high degree of correspondence between the index derived from all ethnic groups and that based on the aggregated categories.Footnote 68 To calculate the index, we sum the squared proportion of each ethnic group, and subtract this total from 1. This quantity yields the probability of two randomly selected individuals from the same locality being of different ethnic origin. The theoretical range of the index runs from 0 to 1, with 0 representing an area in which every individual is from the same ethnic group and 1 representing an area in which each individual is from a different ethnic group. In practice, the median value of the index is 0.14 with a standard deviation of 0.18 (minimum = 0.004; maximum = 0.711). Figure A1 in the Appendix shows a histogram of this index across the 3,927 MSOAs. Since the distribution of the index is highly positively skewed, we take the natural log of the raw index for use in our models. Other indices of ethnic diversity and segregation are available, but we use the Herfindahl measure for consistency with the existing literature.Footnote 69
The fact that we are using data from the 2001 Census to construct our measure of ethnic diversity means that there is a five-year gap between the point at which neighbourhood diversity was measured and the point at which respondents to the survey were interviewed. Although changes in the diversity of neighbourhoods between these time points would not be detected, the effect of this is likely to be minimal, due to the high degree of stability in indices of neighbourhood diversity over such a relatively short time period.Footnote 70 The period 2001–07 does, though, include the rapid increase in immigration to Britain from the accession countries of Eastern Europe, and therefore it is important to acknowledge that our analysis is not able to take account of this recent and somewhat controversial wave of immigration in our measure of diversity. However, although East European immigration undoubtedly resulted in some hostility towards the immigrant groups in specific areas of Britain, its effect on the ethnic diversity of neighbourhoods in Britain as a whole was minimal. This is because the total number of immigrants, though this figure is subject to some uncertainty,Footnote 71 was small relative to the total population but also because the vast majority of East European immigrants would be classified as ‘white’ under the census categorization anyway.
Individual-Level Covariates
In addition to the characteristics of areas, we also include a broad range of individual-level covariates that have been found in previous research to be correlated with trust.Footnote 72 These are: age; sex; social class; health status; marital status; housing tenure; extent to which individuals know their neighbours; life-happiness; ethnicity; educational attainment; time spent watching television; time lived in the area; and annual gross earnings.Footnote 73
The Trust Measures
The TPS contains the generalized trust question (GTQ), which is taken from Rosenberg’s misanthropy scale, and, as we argued earlier, taps the ‘generalized’, or ‘moralistic’, form of trust:Footnote 74
Generally speaking, would you say that most people can be trusted, or that you can’t be too careful in dealing with people?
The TPS also contains the trust in neighbours (TiN) item. Reflecting the fact that most people will know some, but not all of their neighbours, this item is more a combination of trust in strangers (in the neighbourhood) and the ‘strategic’ type of trust endowed in people with whom we are personally acquainted:
Would you say …
1. Many of the people in your neighbourhood can be trusted, 2. Some can be trusted, 3. A few can be trusted, 4. (or that) No one can be trusted (?)
The trust questions are administered to a random half of the full TPS sample each year. In addition, the GTQ was only administered in the second year of the survey (2006). This yields an analytical sample size of 11,963 for the GTQ item and, by combining the data from years 1 and 2, 24,922 for the TiN item.
Analysis
To model simultaneously the effect of individual and area level characteristics on individual level trust, we use a multi-level modelling framework.Footnote 75 This enables us to account properly for the non-independence between respondents within the same geographical location and to model heterogeneity in trust at the neighbourhood level as a function of characteristics of neighbourhoods. We specify models with a random intercept and random coefficients. In conceptual terms, this means that each neighbourhood is allowed to have its own mean level of trust and the coefficients for the individual-level covariates are allowed to take on different values in different areas. For the TiN item, the model has the following form (for simplicity of exposition, Equation 2 shows only the reduced form equation and a single covariate at each level):

Where yij is trust for the ith individual in the jth area, β 0 is the intercept, β 1 is the regression coefficient for individual i in area j for the individual level covariate x, and α is the regression coefficient for the area level covariate, w, in area j. The part of Equation 2 in parentheses shows the random effects;  is the area level error for the random intercept,
 is the corresponding random error for the regression coefficient, and
 is a person-specific error. These random effects are assumed to have means of 0 and normally distributed variances denoted, respectively, by
 , as well as the covariance between the random intercept and the random coefficient,
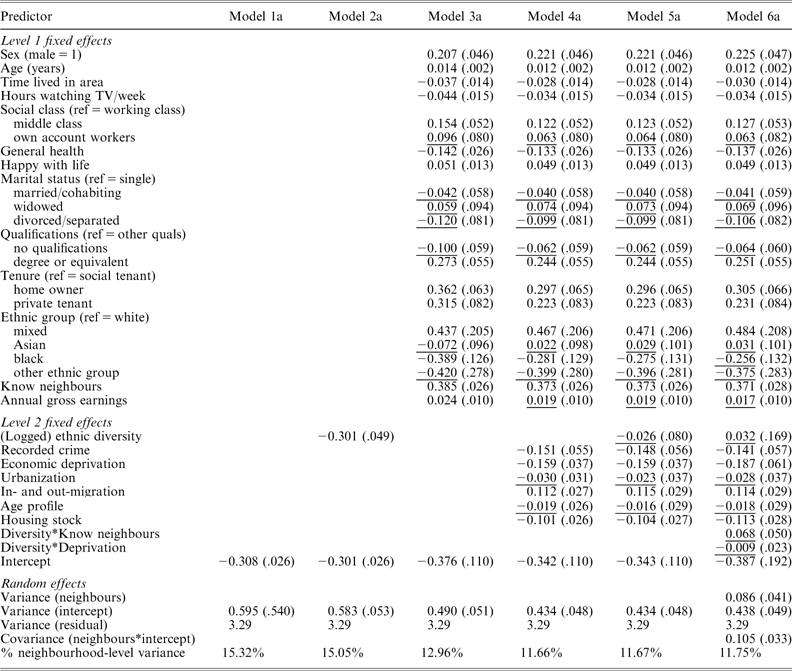
 . All right-hand side variables are centred at their mean values.Footnote 76 Since the GTQ item is binary, we specify a logit link function for Models 1a–6a, in which it is the outcome, so that the coefficients represent the log of the odds such that the respondent selects the trusting response alternative, for each unit change in the covariate.Footnote 77
Our modelling strategy proceeds in the following manner. First, we specify a ‘null’ model with a random intercept but no individual or neighbourhood-level covariates. This provides us with a descriptive picture of how the total variability in trust is partitioned across individuals and areas, before accounting for compositional differences between neighbourhoods. Next, we introduce our measure of ethnic diversity, the Herfindahl index, as a neighbourhood-level predictor to investigate its unconditional relationship with trust. We then replace the Herfindahl index with the individual-level covariates in a third model, before introducing the additional neighbourhood characteristics in a fourth. These models allow us to investigate the extent to which the characteristics of individuals and neighbourhoods are able to account for variability in trust, relative to ethnic diversity considered on its own. In Model 5, we make our key comparison – between the conditional and the unconditional effect of ethnic diversity by reintroducing the Herfindahl index. In the final model, Model 6, we introduce the interactions between the Herfindahl index and (a) the number of people the respondent knows in the area and (b) the economic deprivation of the neighbourhood. The coefficients for these interactions enable tests of the contact/conflict hypotheses. If contact between different ethnic groups increases trust, we should observe a positive interaction for (a). In contrast, if conflict over scarce resources reduces trust, we should observe a negative interaction for (b).Footnote 78
Results
Table 1 shows the model parameter estimates for the generalized trust item. Model 1a shows that, before controlling for differences between individuals and neighbourhoods, 15.3 per cent of the variability in generalized trust is situated at the neighbourhood level. Model 2a introduces ethnic diversity as an area-level predictor, which, although statistically significant, has little explanatory power, with the unexplained neighbourhood-level variance reduced by less than a third of 1 per cent. The coefficients for the individual-level fixed effects in Models 3a–6a are in line with the results of previous cross-sectional investigations. Men, older people, those in higher social class groups, those in better health and who are happier with their lives have higher level qualifications, and those who are personally acquainted with their neighbours have a higher probability of selecting the trusting response alternative. Conversely, more time spent watching television, being divorced or separated, and living in social housing are characteristics related to a reduced probability of trust. There are differences in trust between ethnic groups, with blacks being less trusting than whites, Asians and those of ‘other’ ethnic origins. Those of mixed ethnic origin are the most trusting of all these rather broad ethnic categorizations. Length of residence in the neighbourhood is associated with lower levels of trust, a somewhat counter-intuitive finding, which is likely to be due to the constraints on residential mobility experienced by those living in more run-down and economically deprived neighbourhoods.
Random Effects Logit Models – Generalized Trust

Source: Taking Part Survey 2005–2007; n = 11,963; coefficients are logits; underlined coefficients are non-significant at the 95 per cent level of confidence.
In Model 4a, the neighbourhood-level characteristics are introduced as covariates. As expected, more economically deprived areas, those with higher rates of recorded crime, greater population turnover and poorer housing-stock have lower levels of generalized trust. The degree of urbanization and the age profile of the neighbourhood have no independent effect. The difference in trust between blacks and other ethnic groups is now reduced by around a quarter. This demonstrates that if we fail to take account of the social and economic composition of neighbourhoods, incorrect inferences can be made about differences in trust between ethnic groups. The combined effect of the individual and neighbourhood-level characteristics reduces the level 2 variance component to 11.7 per cent, a quarter of the total neighbourhood-level variability in trust.
Of greater interest for our purposes here, however, is the non-significant effect of ethnic diversity in Model 5; when we control for compositional differences between areas, ethnic diversity is completely unrelated to generalized trust. Neither is this relationship moderated by the degree of social contact or economic deprivation in the neighbourhood (Model 6a); it is zero order irrespective of the extent of personal familiarity people have with their neighbours, or the degree of economic deprivation of the area. The random part of Model 6a shows that there is a significant random coefficient for the variable ‘know neighbours’ and a significant negative covariance between this random coefficient and the random intercept. In substantive terms, the random coefficient indicates that the association between the extent to which people know their neighbours and generalized trust is significantly different across neighbourhoods. The negative covariance indicates that the magnitude of the coefficient for the variable ‘know neighbours’ is highest in areas with low levels of generalized trust, and vice versa. That is, the importance of social contact in fostering generalized trust is greatest in neighbourhoods where trust is low.
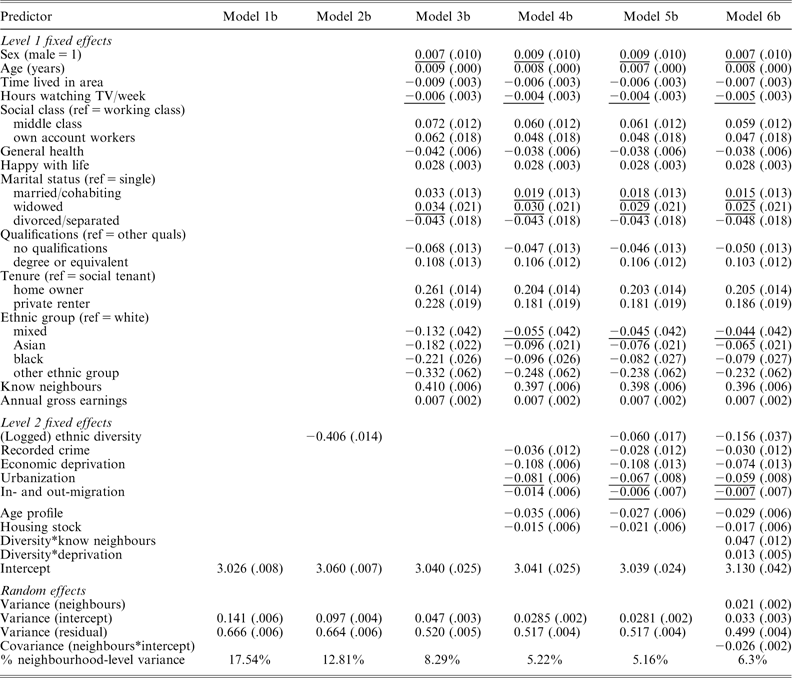
Turning next to the TiN item, Table 2 shows the parameter estimates for these models. Although the coefficients are now the expected change in the mean rather than the log odds of trust, the pattern of magnitude and significance is similar in many respects to that found for the generalized trust models; age, social class, health status, life happiness, housing tenure and knowing one’s neighbours are all significant and in the same direction as was found for the GTQ. There are, however, some notable differences that serve to bear out the observation that these items do not measure the same form of trust. There is no difference in trust between men and women, while Asians, blacks and those from other ethnic groups are now all less trusting than are whites and those of mixed ethnic backgrounds. The amount of time spent watching television is now not significantly related to trust,Footnote 79 while being separated or divorced, having no qualifications and higher gross annual earnings are. The neighbourhood-level variance component in Model 1b, at 17.5 per cent, is of a similar magnitude to the same ‘intercept only’ model for the GTQ item.
Random Effects Models – Trust in Neighbours

Source: Taking Part Survey 2005–2007; n = 24,922; coefficients are expected change in mean of trust for unit change in predictor; underlined coefficients are non-significant at the 95 per cent level of confidence.
The unconditional effect of ethnic diversity in Model 2b is again negative and significant, although this time it is of a considerably greater magnitude, explaining 27 per cent of the neighbourhood-level variability in strategic trust. This, of course, takes no account of compositional differences between neighbourhoods, which may themselves be correlated with both ethnic diversity and trust. Models 3b and 4b introduce individual-level and neighbourhood-level covariates, which together reduce the unexplained neighbourhood-level variance to just 5 per cent, explaining more than two-thirds of the total variance partitioned at the neighbourhood level. The estimates for the neighbourhood characteristics are also broadly similar to those obtained for the GTQ, but for the TiN item, ‘in and out-migration’ is not significant, while the type of housing stock is. Although reduced in magnitude by approximately 85 per cent from the unconditional model (2b), the coefficient for ethnic diversity in Model 5b is statistically significant at the 99 per cent level of confidence. Even controlling for this broad spectrum of individual-level and neighbourhood-level characteristics, then, individuals in more ethnically diverse neighbourhoods are less trusting of the people living in those neighbourhoods. So, following Putnam, we can also confidently conclude that the association between diversity and the kind of trust measured by the TiN item is highly unlikely to be zero in the population.
Before considering the substantive importance of the diversity–strategic trust association, let us first examine the moderating influence of social contact and economic deprivation on this relationship. Model 6b introduces interactions between diversity and social contact and neighbourhood deprivation. Both coefficients are positive and significant. For the ‘know neighbours’ variable, this means that the more people an individual knows in his or her neighbourhood, the weaker the negative association between diversity and trust becomes. So, as Stolle et al. have argued, whether diversity results in ‘conflict’ or not appears to depend, in the British as in the American context, on the extent of contact between an individual and those in his or her neighbourhood.Footnote 80 If you are personally acquainted with many people in your neighbourhood, diversity has little or no effect on your trust in them. As with Model 6a for generalized trust, there is a significant negative covariance between the random intercept and the random coefficient for the ‘know neighbours’ variable; the importance of knowing one’s neighbours is greatest in areas of low neighbourhood-level trust.
As for the deprivation–diversity coefficient, conflict theory should lead us to anticipate a negative interaction between these variables; so the positive coefficient for this interaction is in the opposite direction to what conflict theory would lead us to expect – the negative relationship between diversity and trust is at its weakest in the most economically deprived areas. The converse, of course, is also true; as economic deprivation decreases, the magnitude of the negative relationship between ethnic diversity and trust increases. So, if diversity does indeed erode trust, this corrosive influence would not appear to arise out of conflict over scarce resources, or at least not those with localized markets, such as social housing and jobs.
Turning finally to a consideration of the substantive significance of the ethnic diversity coefficient in the strategic trust models, we can first consider this in terms of variance explained. Controlling for the observed characteristics of individuals and neighbourhoods, we see that ethnic diversity explains only 1.4 per cent of the neighbourhood-level variability in trust – hardly a powerful effect. By way of contrast, the neighbourhood-level variance explained by economic deprivation is 16.3 per cent, while the ‘know neighbours’ variable accounts for 25 per cent of unexplained variance at the neighbourhood level and 16 per cent at the individual level.Footnote 81 In evaluating the substantive importance of the diversity coefficient, it is also important to acknowledge the fact that the neighbourhood-level variables available to us are unlikely to be exhaustive of the aspects of neighbourhoods that are correlated with trust. For instance, there is no measure of income on British Census, and therefore we have no direct way of controlling for distributional and mean differences in income across neighbourhoods. It is likely, therefore, that these weak estimates of the substantive influence of ethnic diversity represent something of an upper bound.
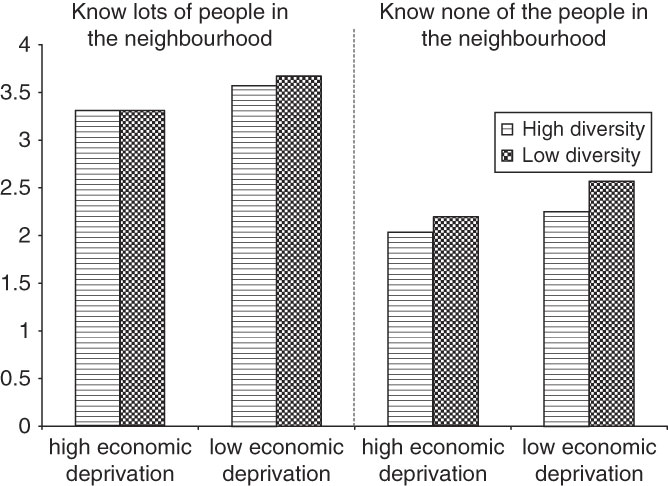
In addition to the variance explained, it is also useful to evaluate the substantive importance of regression coefficients through model fitted values. Figure 1 plots predicted trust scores from Model 6b for different combinations of ethnic diversity, economic deprivation and acquaintance with people in the neighbourhood. For the neighbourhood-level variables (ethnic diversity and economic deprivation), ‘low’ and ‘high’ are defined as 1.5 standard deviations above and below the mean. For acquaintance with neighbours, values are varied between knowing ‘lots of people’ and ‘none of the people’ in the neighbourhood. All other variables are set at their sample mean values.
Predicted values of trust in people in the neighbourhood

The first thing that is clearly apparent from Figure 1 is that being acquainted with people in the neighbourhood has a substantial positive association with trust in neighbours at all levels of deprivation and diversity. In substantive terms, then, this social contact variable dominates. In addition, however, it is clear that the relationship between diversity and this kind of trust is strongly conditioned by the other two variables. It is only when individuals live in more affluent neighbourhoods and are broadly unacquainted with the people who live there that ethnic diversity has even a moderate negative effect on trust, with a three standard deviation unit increase in diversity reducing trust by a quarter of one point, on a four-point scale. In areas of high deprivation, the predicted probability of trust is actually slightly higher in more diverse areas, for individuals who know many people in their neighbourhood (although this difference is not statistically significant). In sum, the relationship between ethnic diversity and strategic trust is both substantively weak and strongly moderated by the economic and social-interactional characteristics of the neighbourhood.
Discussion
The analyses we have presented here challenge the frequently articulated view, amongst academic scholars and media commentators alike, that ethnic diversity represents a worrying corrosive influence on trust between citizens in multi-cultural societies.Footnote 82 In contrast, the primary conclusion to be drawn from the evidence we have presented is that the diversity–trust relationship is much better characterized by its weak and contingent nature. First in this regard, we have shown that it is essential to be clear about the sort of trust that is being referred to and how it is being measured. While theoretical accounts draw a clear distinction between generalized trust in strangers and strategic trust in known others,Footnote 83 this demarcation has not been sufficiently acknowledged in empirical studies of the diversity–trust relationship, where a wide variety of different measures have been used interchangeably, as if they all measured the same thing.
Using the standard question for measuring the generalized or ‘moralistic’ variety of trust,Footnote 84 we find no evidence of a relationship between the ethnic diversity of neighbourhoods and the propensity of individuals to express trust in others. This finding is not an isolated one, unique to the British context, for it corroborates a number of independent studies already conducted in different contexts that find no relationship between ethnic diversity and generalized trust, as measured by the GTQ.Footnote 85 And, indeed, the analyses in Putnam’s 2007 article that principally motivate our concerns in this article are themselves based on the ‘trust in neighbours’ item, rather than the GTQ.
One might counter here that we should not expect generalized trust to be responsive to short- to medium-term variations in the external environment, as this kind of ‘moralistic’ trust is more akin to a core value, or personality trait developed at an early stage of the life-course.Footnote 86 Such an argument carries some weight, although it must be reconciled with the fact that our results have shown this kind of trust to be highly responsive to the level of economic deprivation and other social and economic features of neighbourhoods. It is also important to bear in mind that it is this kind of generalized or ‘thick’ trust that is argued to yield such powerful societal rewards, and it is the decline in trust as measured by the GTQ in the General Social Survey that forms a key pillar in Putnam’s seminal account of America’s civic decline.Footnote 87 If ethnic diversity has no influence on the kind of trust in which social capital theorists have placed so much weight in key empirical analyses, then the implications for individual and societal well-being are considerably less profound.
On a measure which we have argued taps more into the strategic form of trust in known others, the ‘trust in neighbours’ (TiN) item, we found a significant and quite substantial unconditional negative association with ethnic diversity. However, once we controlled for compositional and structural differences between neighbourhoods, the association became substantively trivial, explaining just 1 per cent of the remaining neighbourhood-level variability. Compared to other features of individuals and neighbourhoods, such as the degree of social contact and the level of economic deprivation, the magnitude of the ethnic diversity ‘effect’ is, at most, weak. By way of counter-factual, if it were somehow possible to make every neighbourhood in Britain completely ethnically homogeneous, it would have a barely perceptible impact on the extent to which the British trust people in their neighbourhoods. In drawing these conclusions, it is important that we do not overstate the accuracy of the measurement properties of our two outcome measures and acknowledge that it is likely that both measures incorporate elements of both generalized and strategic trust. For the majority of respondents, the terms ‘most people’ and ‘people in your neighbourhood’ will evoke a mix of both strangers and individuals with whom they are personally acquainted. That being said, however, research into the measurement properties of these questions shows that the GTQ is considerably more likely than the TiN item to evoke cognitive framing in respondents that corresponds to the conceptual definition of generalized trust, while the reverse is true for strategic trust.Footnote 88 A key implication of these findings, then, is that research into the causes and consequences of trust must pay greater attention to the type of trust being investigated and how this relates to the choice of empirical indicators.
In addition to emphasizing the importance of the conceptual and empirical distinction between generalized and strategic trust, we have also scrutinized the mechanisms through which diversity has been assumed to exert its corrosive influence. On the one hand, it is argued, diversity can ameliorate inter-group relations by dispelling misplaced fears and stereotypes through direct contact. On the other, ethnic heterogeneity can lead to conflict over perceived threats to scarce social and economic resources. In Putnam’s analysis, it is the latter which wins out over the former in the American context, causing people of all ethnic groups to ‘hunker down’ and view one another with suspicion and distrust. As Stolle et al. have observed, however, these processes need not be considered mutually exclusive – diversity may lead to hostility and distrust in the absence of social contact but this effect may be diminished, or even reversed, as the degree of social contact increases.Footnote 89 Our findings lend further support to this contingent perspective; the relationship between diversity and strategic trust is strongly conditioned by the extent to which an individual knows people in his or her neighbourhood. Thus, we cannot conclude simply that ethnic diversity reduces trust, but only that ethnic diversity can have a small negative effect on trust in neighbours, when the level of inter-personal contact an individual has with those in his or her neighbourhood is low.
A second implication of the proposed causal mechanism is that ethnic diversity should exert its most deleterious influence on trust in economically deprived areas, where competition for public goods such as social housing, employment and local authority facilities is at its greatest, ‘for various reasons – but, above all, contention over limited resources, diversity fosters out-group distrust’.Footnote 90 While our analysis did identify an interaction between the ethnic diversity and economic deprivation of neighbourhoods, the coefficient was in the opposite direction to what conflict theory, taken at face value, would lead us to anticipate. Ethnic diversity had no effect on strategic trust in the most deprived areas but did have a significant, although still weak, effect in more economically affluent neighbourhoods. Therefore, if diversity does reduce trust in one’s neighbours, it would not appear to be a result of competition, real or imagined, between different ethnic groups for scarce local resources.
If conflict for scarce resources is not the mechanism through which diversity exerts a negative influence on trust in neighbours, we must address the question of how the counter-intuitive negative relationship we have observed here actually does arise. Coming, as it does, after our empirical analyses what follows is, necessarily, speculative. In addition, since we are dealing with interacting effects, the answer must be considered in two parts. First, it seems likely that, in economically deprived areas, what we are witnessing is a ‘floor effect’; the powerful negative influence of economic deprivation ‘drowns out’ any weak effect of ethnic diversity in more deprived neighbourhoods. Or, to put it another way, the corrosive effect of economic deprivation reduces trust to such an extent that diversity has no further room to exert any influence in these neighbourhoods.
Secondly, in more affluent areas, individuals express less trust in their neighbours if the area is ethnically diverse and they do not know many people in the neighbourhood personally. This contingent pattern suggests that the weak negative effect on trust arises, not from ethnic diversity per se, but from the ‘indirect’ experience of people who, on the surface at least, appear ‘different’. Therefore, individuals who live in affluent but ethnically diverse areas will be less trusting of people in their neighbourhood, if they have little or no direct contact with them. These conclusions have clear implications for policy makers. To the limited extent that societal well-being is indeed at threat from ethnic diversity of local areas, the solution would not appear to lie in reducing, or restricting, the ethnic diversity of neighbourhoods but in fostering increased contact and communication between those communities in which people of different ethnic, religious and cultural backgrounds already coexist.
Conclusion
The effects of ethnic and cultural diversity on civic attitudes and behaviour at both the local and national level have long been, and remain, sensitive topics of political discourse. Yet, debate concerning the appropriate approach to the cultural integration of immigrant communities is often characterized by unevidenced, polarized opinions traded by ideologically entrenched protagonists. It is entirely appropriate, therefore, that empirically-oriented social scientists should contribute to a more reasoned approach to understanding and developing policy in this area. As Putnam correctly notes, ‘it would be unfortunate if a politically correct progressivism were to deny the reality of the challenge to social solidarity posed by diversity’.Footnote 91
Yet, while political dogma should certainly not deter social scientists from contributing to this controversial question, it is equally imperative that research findings which imply negative consequences arising from the presence of immigrant and ethnic minority groups are themselves subjected to rigorous scrutiny. This has been our aim in this article. Our findings and conclusions contradict the view that the increasing ethnic heterogeneity of community life in the twenty-first century represents a worrying and corrosive influence on trust between citizens. An important limitation to this generalization is that our conclusions relate to Britain about 2005. Failure to corroborate the pattern of results that has been observed in the United States does not negate those findings but does, we contend, pose a strong challenge to claims of their universalistic nature.
Appendix
Summary Statistics for Neighbourhood Characteristics

Rotated Factor Loadings from Principal Components Analysis of Neighbourhood Characteristic Variables

Source: Coefficients in bold indicate the component on which each neighbourhood characteristic variable loads.
Histogram of Herfindahl index values across middle super-output areas