Introduction
Goat milk production is a vital and expanding sector that is crucial for the welfare of millions globally and integral to many economies (Leitner et al., Reference Leitner, Merin and Silanikove2011). However, productivity in developing regions often lags due to various factors, including the genetic potential of local breeds. Sustainable breeding programmes offer a way to reduce this performance gap. Genetic parameters, including correlations and heritabilities, play a crucial role in developing effective breeding strategies and conducting genetic evaluations in livestock (Willam et al., Reference Willam, Nitter, Bartenschlager, Karras, Niebel and Graser2008). In the context of milk production traits, significant genetic progress has been achieved, especially in cumulative milk production over a 240-day lactation period, with an annual increase of 1.7% over the past decade. However, selecting goats for higher milk yields can intensify the interaction between the udder and milking equipment, potentially increasing the risk of mammary gland infections. This increased interaction, combined with the stress on productivity experienced by goats, may make them more vulnerable to infectious agents. Similar to dairy cattle, this may suggest an increased incidence of mastitis in goats (Capoferri et al., Reference Capoferri, Cremonesi, Castiglioni, Pisoni, Roccabianca, Riva, Filipe, Del Corvo, Stella and Williams2021). The somatic cell count is often used as an indicator of udder health in dairy cattle (Barkema et al., Reference Barkema, Van der Ploeg, Schukken, Lam, Benedictus and Brand1999; Guzzo et al., Reference Guzzo, Sartori and Mantovani2018). The logarithmic transformation of somatic cell count (SCC) into somatic cell score (SCS) is necessary to normalise the distribution for genetic evaluation of udder health (Ali and Shook, Reference Ali and Shook1980). Hence, it acts as an efficient tool for managing mammary gland disorders like mastitis. White blood cells and specific epithelial cells from mammary gland tissues are the main components of SCC in goat’s milk (Podhorecká et al., Reference Podhorecká, Borková, Šulc, Seydlová, Dragounová, Švejcarová, Peroutková and Elich2021).
The primary constituents of SCC in goat milk are white blood cells and specific epithelial cells from mammary gland tissues. Notably, SCC significantly rises with mastitis-induced infection of udder tissues (Moroni et al., Reference Moroni, Pisoni, Ruffo and Boettcher2005; Koop et al., Reference Koop, Dik, Nielen and Lipman2010). However, SCC levels can be influenced by various factors, making it challenging to distinguish between chronic or repetitive mastitis based on this data (Bergonier et al., Reference Bergonier, De Crémoux, Rupp, Lagriffoul and Berthelot2003). Furthermore, there is insufficient research on sheep and goats to establish a clear relationship between SCC and the likelihood of mastitis (Persson and Olofsson, Reference Persson and Olofsson2011; Knuth et al., Reference Knuth, Stewart, Taylor, Yeoman, Bisha, Page, Rowley, Lindsey, Van Emon and Murphy2019). According to Miles and Huson (Reference Miles and Huson2021), interpreting SCC monitoring and analysis should indicate a multifactorial mammary gland inflammation problem, as it is challenging to identify the threshold level of subclinical mastitis or the affected udder quarter.
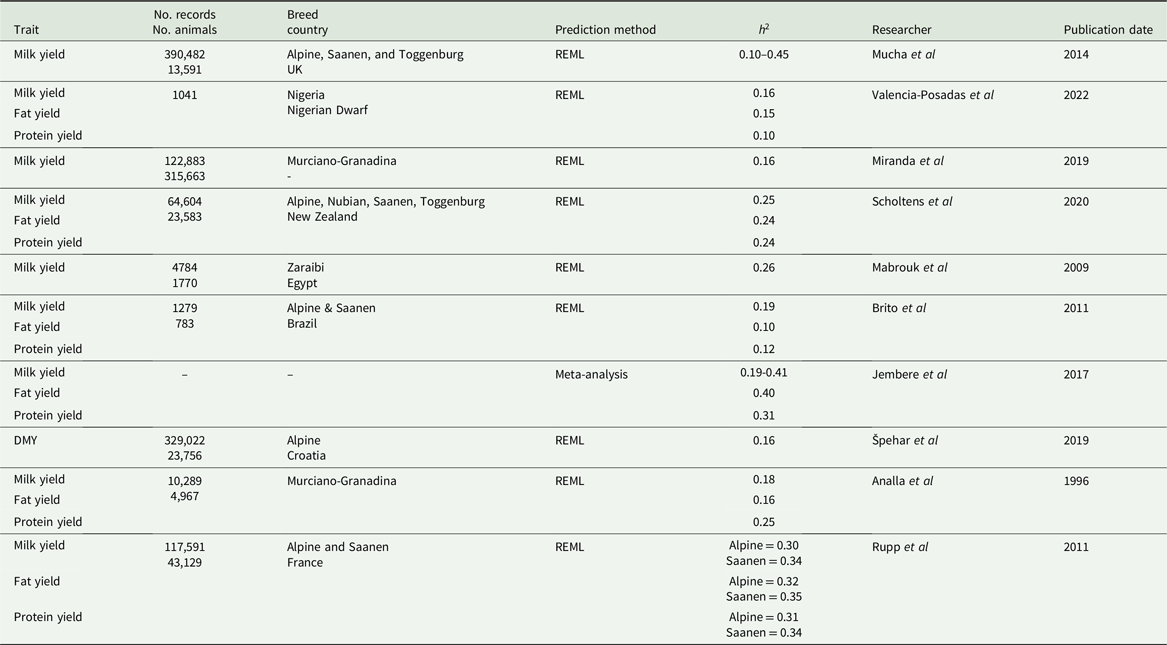
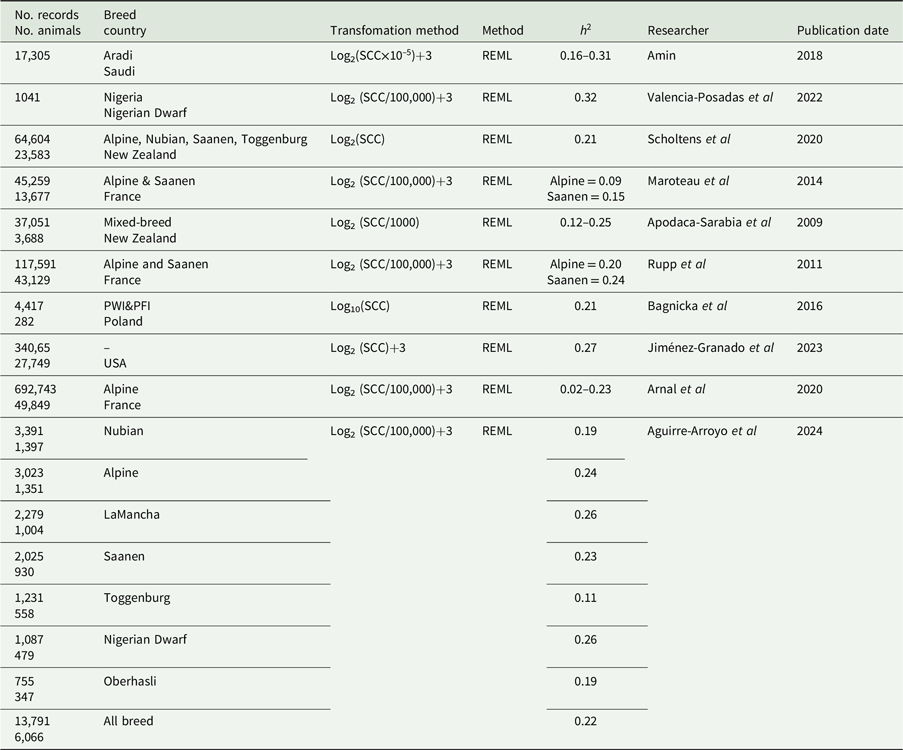
In recent years, efforts to enhance udder health in dairy animals have concentrated on reducing the somatic cell score (SCS), a key indicator of udder health and mastitis. These initiatives leverage advanced genetic technologies, with genomic selection serving as a pivotal method for identifying genes associated with mastitis resistance. Furthermore, balanced breeding programmes are being developed to concurrently improve both milk production and udder health. Nonetheless, challenges such as the complexity of heritability, data limitations, antimicrobial resistance, and the economic ramifications of decreased milk production must be addressed. A multidisciplinary approach is essential to overcome these challenges and attain sustainable improvements (Al-harbi et al., Reference Al-harbi, Ranjbar, Moore and Alawneh2021). Although a few studies on genetic parameter estimation and estimated heritability for SCS in dairy goats using REML methods have been published (Tables 1–3), there is a notable gap in research regarding the application of Bayesian approaches to estimate variance components and genetic parameters of dairy traits and somatic cell score (SCS) so the primary objective of this study is to estimate these parameters using an animal model and Bayesian methods for milk SCS trait and its genetic correlation with dairy traits in the Murciano-Granadina goat breed in Iran.
Published heritability estimates for dairy traits in dairy goats

Published heritability estimates for somatic cell score in dairy goats

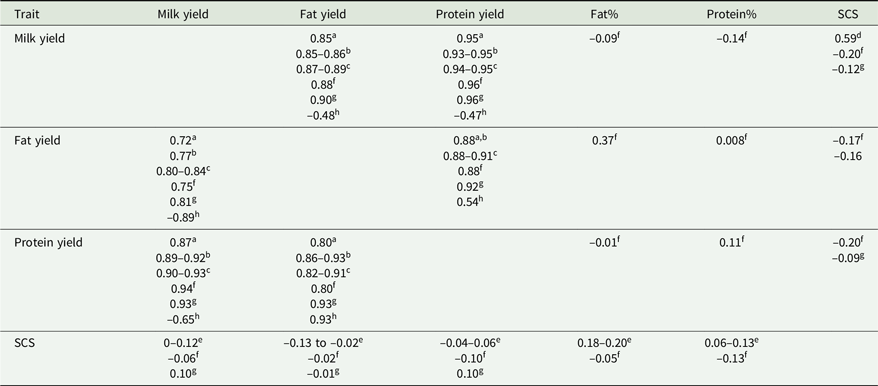
Published phenotypic (above diagonal) and genetic correlations (below diagonal) between dairy traits and somatic cell score for dairy goats

aTorres-Vázquez et al., Reference Torres-Vázquez, Valencia-Posadas, Castillo-Juárez and Montaldo2009; bBélichon et al., Reference Bélichon, Manfredi and Piacère1999; cBoichard et al., Reference Boichard, Bouloc, Ricordeau, Piacere and Barillet1989; d Bagnicka et al., Reference Bagnicka, Lukaszewicz and Ådnøy2016; eRupp et al., Reference Rupp, Clément, Piacere, Robert-Granié and Manfredi2011; fAspilcueta-Borquis et al., Reference Aspilcueta-Borquis, Araujo Neto, Baldi, Bignardi, Albuquerque and Tonhati2010; gScholtens et al., Reference Scholtens, Lopez-Villalobos, Garrick, Blair, Lehnert and Snell2020; h Analla et al., Reference Analla, Jimenez-Gamero, Munoz-Serrano and Serradilla1996.
Materials and methods
Data and variables
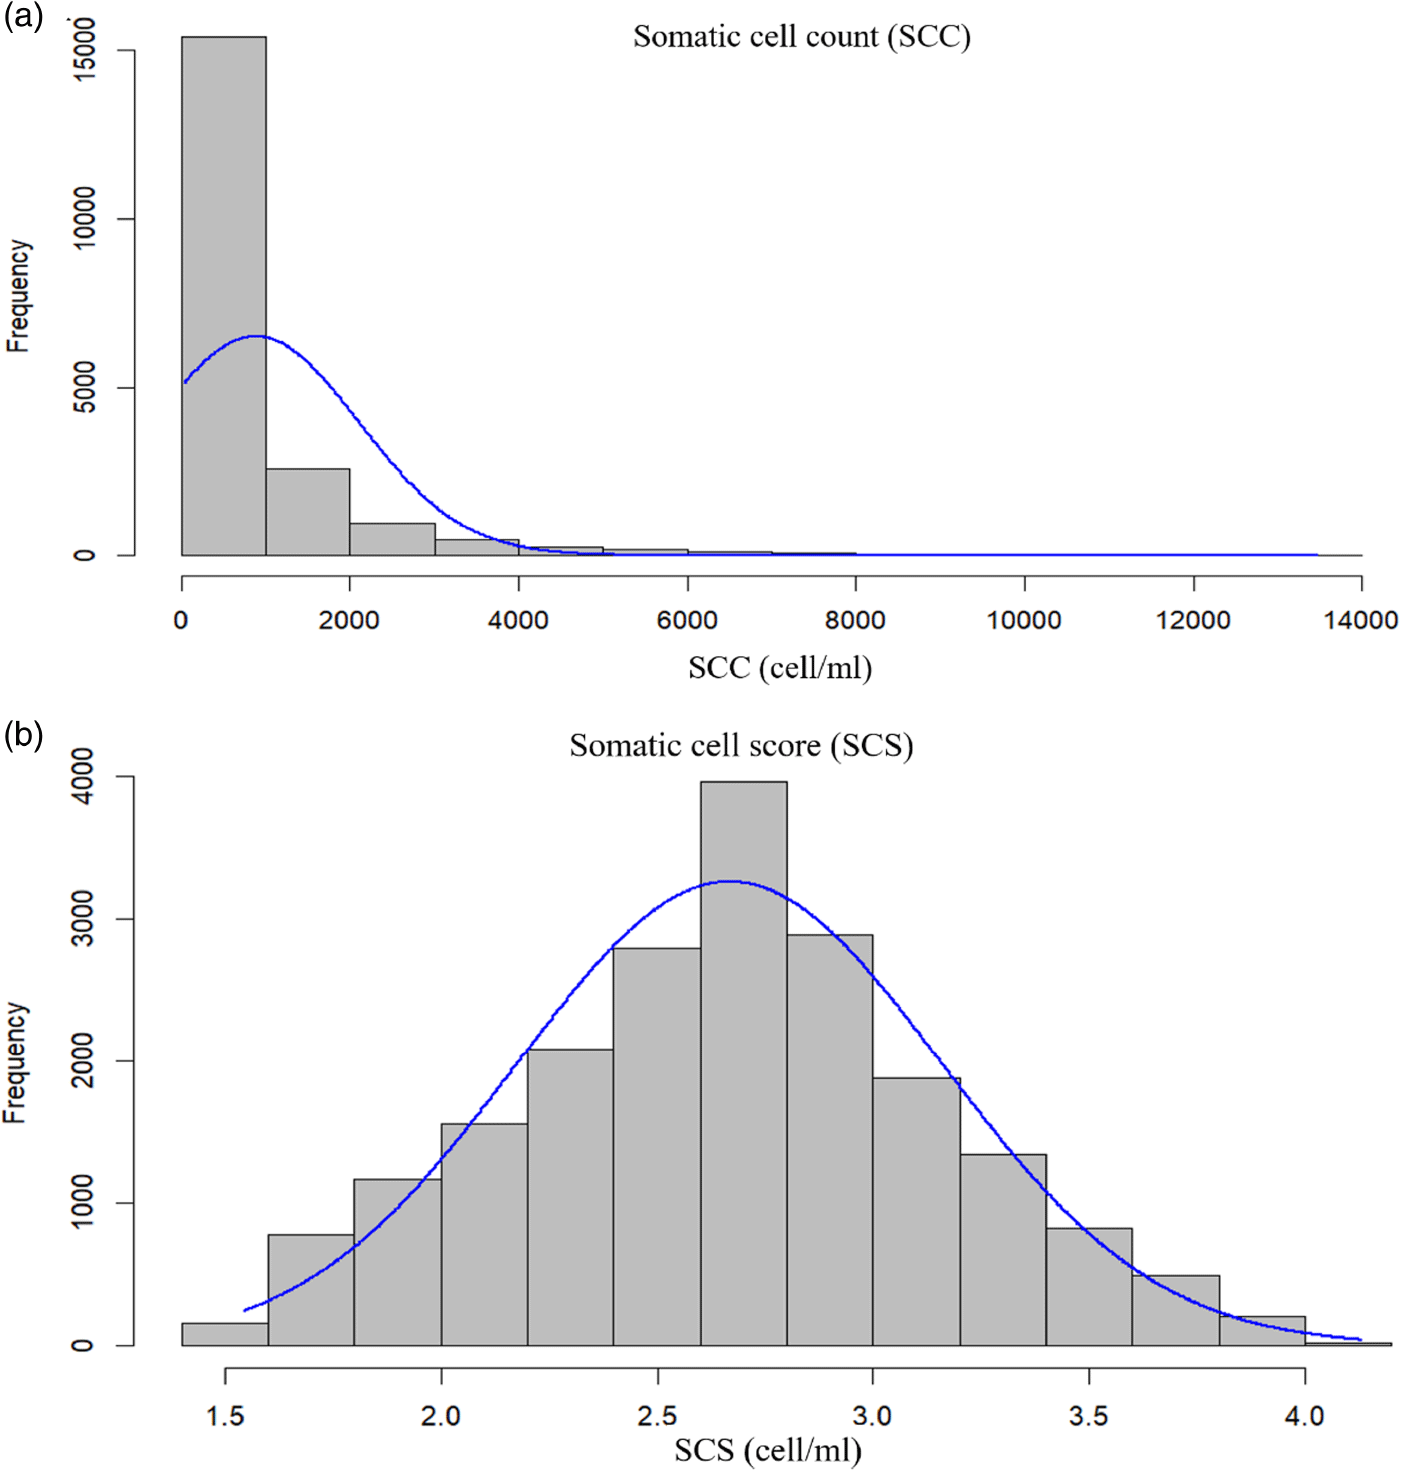
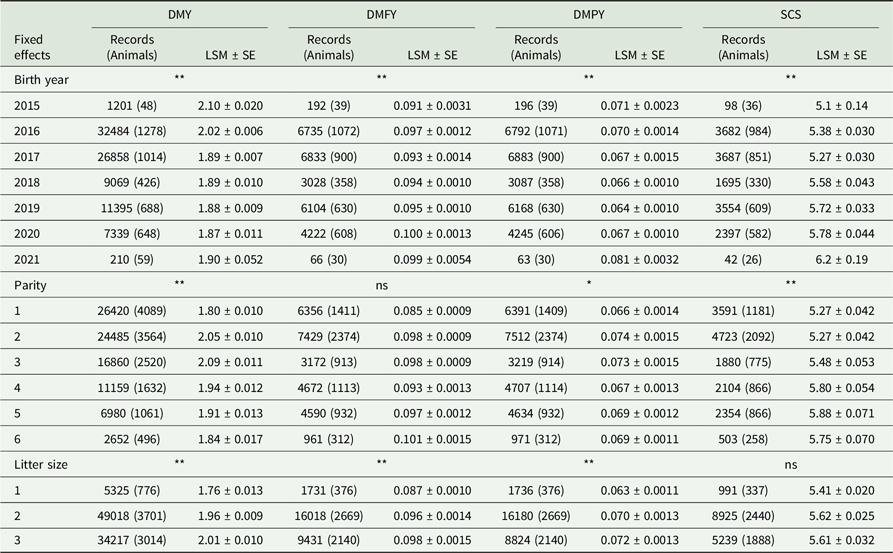
The data consisted of 99,839 records from 4,307 Murciano-Granadina goats from the southern region of Iran, specifically from Ghale-Ganj dairy goat farm located in Kerman province (refer to Figure 1), collected between 2015 and 2021. The research primarily focused on assessing traits such as daily milk yield (DMY), daily milk fat yield (DMFY), daily milk protein yield (DMPY), and somatic cell score (SCS). Table 4 presents descriptive statistics for all traits. Somatic cell count data typically exhibit a non-normal distribution, often skewed to the left, as can be observed in Figure 2a. Next, we implemented a logarithmic transformation as recommended by previous research, resulting in a successful attainment of normal distribution, as demonstrated in Figure 2b.
The geographical location of goat farm is included in the study.

Descriptive statistics for daily milk production traits and somatic cell score in Murciano-Granadina dairy goats

SD, Standard Deviation; Min, Minimum; Max, Maximum; CV, Coefficient of Variation; DMY, daily milk yield; DMFY, daily milk fat yield; DMPY, daily milk protein yield; SCC, somatic cell count; SCS, somatic cell score.
Frequency distribution of the variable somatic cell count in Murciano-Granadina goat before (a), and after logarithmic transformation (somatic cell score, (b)).

Normalising the data can significantly reduce variability and the impact of outliers. Somatic cell counts are often highly variable and contain many outliers, and they exhibit positively skewed distributions that deviate from normality. This can distort analyses and lead to unreliable estimates of genetic parameters. By compressing large values, the data becomes more manageable for statistical analysis and leads to more accurate and reliable genetic parameter estimates (Xia, Reference Xia2023). Various methods exist for data normalisation, including Min-Max, Z-score, logarithmic, and square root transformations. In this study, logarithmic (log2) transformations were employed. Given that somatic cell counts (SCC) exhibit high variability and dispersion, these two methods are effective in reducing this variability (Noel et al., Reference Noel, Justin, Alphonse, Désiré, Dramane, Nafan and Malerba2021). The formula used for the transformation was :
 $${\rm{SCS}} = {\rm{lo}}{{\rm{g}}_2}\left( {{\rm{SCC}}/100,000} \right) + 3$$
Statistical analysis
Analysis of variance and Tukey-Kramer tests were employed to determine the significance of environmental effects. All data editing procedures, assessment of environmental effects significance, and model fitting were conducted using R (R Development Core Team, 2023) and Excel software. Table 5 displays the least squares means for respective traits. The model used was as follows:
 $${{\rm{Y}}_{{\rm{ijklmn}}}} = \mu + {\rm{B}}{{\rm{Y}}_i} + {{\rm{P}}_{\rm{j}}} + {\rm{L}}{{\rm{S}}_{\rm{k}}} + {\rm{DI}}{{\rm{M}}_{\rm{l}}} + {\rm{Ag}}{{\rm{e}}_{\rm{m}}} + {{\rm{e}}_{{\rm{ijklmn}}}}$$
where Y represents observations related to DMY, DMFY, DMPY, and SCS, µ is overall mean, BY is birth year (i = 2015, …, 2021), P is parity (k = 1, …,6), LS is litter size (l = 1, 2, 3), DIM is days in milk (m = 1, …, 250), Age (day) represents (273, …, 2759), and e is the random effect of residual factors.
Number of records, number of animals and least squares means (±SE) for dairy traita and somatic cell score of Murciano-Granadina goats

aDMY, daily milk yield; DMFY, daily milk fat yield; DMPY, daily milk protein yield; LSM, Least squares mean; SE, standard error.
*, P < 0.05; **, P < 0.01.
The mixed model used for analysing dairy and SCS traits in the Murciano-Granadina goat data employed a single-trait structure as follows:
 $${\bf{y}} = {\bf{X\beta }} + {\bf{Za}} + {\bf{e}}$$
where y is the vector of observations of the trait under analysis; β is the vector of fixed effects (eg., birth year, litter size, days in milk); a is the vector of additive genetic effects; e is the vector of residual random effects; and X and Z are the incidence matrices that relate the observations to the effects present in the vectors β and a, respectively. The following matrix illustrates the presumed (co)variance structure of the model:
 $${\rm{Var}}\left[ {\matrix{ {\bf{a}} \cr {\bf{e}} \cr} } \right] = \;\left[ {\matrix{ {{\bf{A}}{\rm{\sigma }}_{\rm{a}}^2} & 0 \cr 0 & {{{\bf{I}}_{\rm{n}}}{\rm{\sigma }}_{\rm{e}}^2} \cr} } \right]$$
where the values
 ${\rm{\sigma }}_{\rm{a}}^2$
and
 ${\rm{\sigma }}_{\rm{e}}^2$
stand the variances associated with direct additive genetic and residual, respectively. A is the numerator relationship matrix.
 ${\rm{\;}}{{\bf{I}}_{\rm{n}}}$
is identity matrice with the appropriate dimensions. It was assumed a ∼ N (0,
 ${\bf{A}}{\rm{\sigma }}_{\rm{a}}^2$
) and e ∼ N (0,
 ${{\bf{I}}_{\rm{n}}}{\rm{\sigma }}_{\rm{e}}^2$
).
Pedigree analysis
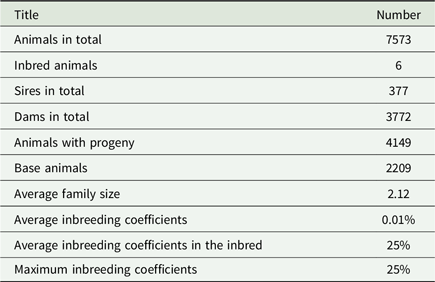
After manipulating the data in Excel and R, the pedigree structure was condensed using the Coancestry, Inbreeding (F), and Contribution (CFC) software (Sargolzaei et al., Reference Sargolzaei, Iwaisaki and Colleau2006). Table 6 presents additional details regarding the pedigree structure of this flock and their mating system. The total number of animals included in the pedigree analysis is 7,573, of which only six are classified as inbred. This indicates that inbreeding is not prevalent in this population, as evidenced by the low average inbreeding coefficient of 0.01%. However, within the subset of inbred animals, the average inbreeding coefficient is significantly higher at 25%, suggesting considerable inbreeding intensity within this small group. The pedigree structure comprises 377 sires and 3,772 dams, collectively resulting in 4,149 animals with progeny. This underscores the substantial contribution of both sires and dams to the genetic composition of the population. Additionally, 2,209 animals are identified as base animals, representing the foundational lineage from which subsequent generations are derived.
Pedigree structure of the Murciano-Granadina dairy goats

Genetic parameters
Variance components were estimated using a Gibbs sampling algorithm in the GIBBSf90 software (Misztal et al., Reference Misztal, Tsuruta, Strabel, Auvray, Druet and Lee2002). In all Gibbs calculations, the number of iterations was set to 150,000 with a burn-in of 50,000. Every tenth iteration was sampled to estimate the posterior distribution. These values were selected by graphically evaluating the differences in values between consecutive results. After the selected burn-in period, all models achieved stabilised results. Starting values for the Gibbs method were selected based on the variability of observations for the single-trait analysis. The posterior mean of the samples (i.e., the common output of the post-Bayesian analysis generated by the ‘postgibbsf90’ programme; (Misztal, Reference Misztal2008) was utilised as a point estimate of the (co)variance component and the associated parameters. The lower and upper bounds of the 95% highest posterior density (HPD) interval were obtained from the estimated marginal densities of (co)variance components and from the derived marginal densities obtained for heritability. The decision to utilise the Gibbs sampler, as opposed to the AI-REML or EM algorithms, was influenced by challenges encountered during the analysis. Specifically, the AI-REML and EM algorithms did not converge, leading to implausible estimates. In contrast, the Bayesian approach employing the Gibbs sampler yielded stable and reliable estimates, effectively accommodating the complexity of the data. To ensure the accuracy of the results, convergence diagnostics were performed, including trace plots, effective sample size calculations, and the Gelman-Rubin diagnostic. These diagnostics confirmed that the chains had converged appropriately, thereby supporting the robustness and reliability of the findings.
Heritability
Heritabilities (h2) were estimated using the formula
 ${{\rm{h}}^2} ={{\rm{\sigma }_{\rm{a}} ^2}\over{{{\rm{\sigma }}_{\rm{p}}^2}}}$
where
 ${\rm{\sigma }}_{\rm{a}}^2$
represents the additive genetic variance, and
 ${\rm{\sigma }}_{\rm{p}}^2$
denotes the phenotypic variance. The phenotypic variance (
 ${\rm{\sigma }}_{\rm{p}}^2$
) is defined as the sum of the additive genetic variance (
 ${\rm{\sigma }}_{\rm{a}}^2$
) and the residual or environmental variance (
 ${\rm{\sigma }}_{\rm{e}}^2$
) (Aguirre-Arroyo et al., Reference Aguirre-Arroyo, Castañeda-Bustos, Lechuga-Arana, Gutiérrez-Chávez, Ángel-Sahagún, Hernández-Marín and Valencia-Posadas2024).
Genetic and phenotypic correlations
Genetic correlations (rg) were calculated using the following formula from Aguirre-Arroyo et al. (Reference Aguirre-Arroyo, Castañeda-Bustos, Lechuga-Arana, Gutiérrez-Chávez, Ángel-Sahagún, Hernández-Marín and Valencia-Posadas2024):
 $${\rm{r}}_{\rm{g}}} = {{{\rm{cov}}\left( {{\rm{ax}}.{\rm{ay}}} \right)}\over{{\sqrt {{\rm{\sigma }}_{{\rm{ax}}}^2 \times {\rm{\sigma }}_{{\rm{ay}}}^2} }}$$
where cov(ax,ay) is the additive genetic covariance between traits X and Y, σ2 ax is the additive genetic variance of trait X, and σ2 ay is the additive genetic variance of trait Y.
Phenotypic correlations (rp) were determined using the formula:
 $${{\rm{r}}_{\rm{p}}} = {{{\rm{cov}}\left( {{\rm{px}}.{\rm{py}}} \right)}\over{{\sqrt {{\rm{\sigma }}_{{\rm{px}}}^2 \times {\rm{\sigma }}_{{\rm{py}}}^2} }}$$
where cov(px,py) is the phenotypic covariance between traits X and Y, σ2 px is the phenotypic variance of trait X, and σ2 py is the phenotypic variance of trait Y. Subsequently, confidence intervals for rg and rp were estimated using the psychometric package (Fletcher, Reference Fletcher2023) in R software version 4.2.2 (R Development Core Team 2023).
The estimated breeding values (EBVs) for somatic cell score (SCS) were calculated using the best linear unbiased predictor methodology, which relies on previously defined statistical models. Additionally, the reliability of the EBVs (denoted as r2) was computed using the formula:
 $$\rm{r}}_{{\rm{IA}}}^2 = 1 - {{{\rm{SE}}{{\rm{P}}^2}}\over{{{\rm{\sigma }}_{\rm{a}}^2}}$$
where
 ${\rm{r}}_{{\rm{IA}}}^2$
= Reliability of the EBVs; SEP = Standard Error of Prediction;
 ${\rm{\sigma }}_{\rm{a}}^2$
= Additive Genetic Variance.
This formula is derived from Mrode (Reference Mrode2005), which provides a method to assess the confidence or accuracy of the estimated breeding values by accounting for the proportion of the genetic variance explained by the model.
Results
Environmental effects
Analysis of variance showed the significant effect of BY and DIM on all the trait studied (P < 0.01). Age of doe and LS had a significant effect (P < 0.01) on all traits except SCS and DMPY, respectively. Parity had no significant effect on DMFY (P > 0.05). DMY, DMFY, and DMPY had a mean value and standard deviation of 1.99 and 0.77 kg, 0.09 and 0.04 kg, and 0.07 and 0.03 kg, respectively. The SCS had average and standard deviation of 5.45 and 1.26, respectively.
Hertabilities
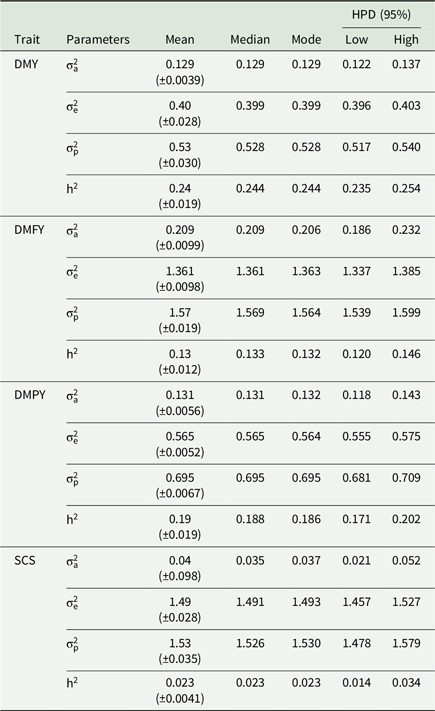
Results for the estimates of (co)variance components and heritabilities are shown in Table 7. The heritability of dairy traits and SCS, namely DMY, DMFY, DMPY, and SCS was estimated to be 0.244, 0.133, 0.188, and 0.023 respectively. The SCS trait exhibited a positive genetic correlation with both DMY and DMPY while demonstrating a negative genetic correlation with DMFY. The range of estimates was from –0.005 to 0.42. Phenotypic correlations of SCS with DMY and DMPY were positive (0.34 and 0.04), but negative with DMFY (–0.01).
Means, medians, modes, and highest posterior density intervals (HPD) of genetic parameters for the studied traits

 ${\rm{\sigma }}_{\rm{a}}^2$
, additive genetic;
 ${\rm{\sigma }}_{\rm{e}}^2$
, residual variances;
 ${\rm{\sigma }}_{\rm{p}}^2$
, phenotypic variance;
 ${{\rm{h}}^2}$
, heritability.
Correlations
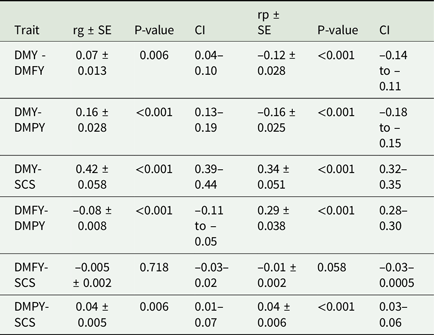
Table 8 provides insights into how different dairy traits and SCS are related genetically and phenotypically. Genetic correlations of SCS with DMY and DMPY were unfavourable (positive) with values of 0.04 and 0.42, respectively. A favourable (negative) genetic correlation was observed between SCS and DMFY. The genetic correlations between DMY-DMFY and DMY-DMPY were all positive. But the value of rg between DMPY and DMFY was negative. Positive values of phenotypic correlations were found between SCS with DMY and DMPY (0.34 and 0.04), and a negative phenotypic correlation was observed with DMFY (–0.01).
Genetic and phenotypic correlations for dairy traits and somatic cell score

rg, genetic correlation; rp, phenotypic correlation; CI, confidence intervals.
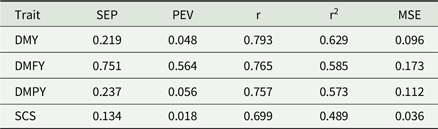
Daily milk yield, daily milk fat yield, and daily milk protein yield show high reliability and accuracy in their breeding value estimates (Table 9). This means that the predictions for these traits are both precise and reflective of genetic differences, providing a strong foundation for selecting goats based on these traits. Somatic cell score has lower reliability and accuracy compared to the other traits. This indicates that the estimates for SCS are less precise and more susceptible to variability, which may be influenced by environmental factors, management practices, or measurement errors rather than solely genetic differences. In summary, the effectiveness of breeding value estimations varies by trait, with DMY, DMFY, and DMPY providing more dependable genetic evaluations, while SCS require careful consideration of their higher variability and lower precision.
Estimating the reliability (r2) and accuracy (r) of breeding values for dairy traits and somatic cell score

SEP, standard error of prediction; PEV, prediction error variance; r, accuracy; r2, reliability; MSE, mean squared error.
Discussion
The mean values for DMY, DMFY, DMPY and SCS were within the range reported by other researchers (Vacca et al., Reference Vacca, Stocco, Dettori, Pira, Bittante and Pazzola2017; Špehar et al., Reference Špehar, Mulc, Barać, Mioč and Kasap2019; Magro et al., Reference Magro, Costa, De Marchi and Manuelian2022). Miranda et al. (Reference Miranda, León, Pieramati, Gómez, Valdés and Barba2019) documented values of 1.21 for DMY, 1.05 for DMFY, and 1.03 for DMPY in the same breed.
Milerski and Mareš (Reference Milerski and Mareš2001) and Ciappesoni et al. (Reference Ciappesoni, Milerski and Přibyl2002) reported higher average DMY for Czech dairy breeds, measuring 2.58 and 2.93 kg/d, respectively. In contrast, in Slovenian Saanen and Alpine goats, Brežnik et al. (Reference Brežnik, Kovač, Kompan and Malovrh1997) reported a lower mean DMY (1.98 kg/d). Differences in average estimates for dairy traits may occur due to varying feeding and management practices (Valencia-Posadas et al., Reference Valencia-Posadas, Lechuga-Arana, Ávila-Ramos, Shepard and Montaldo2022). The mean of SCC was 5.45, closely aligning with the 4.57 reported by Barrón-Bravo et al. (Reference Barrón-Bravo, Gutiérrez-Chávez, Ángel-Sahagún, Montaldo, Shepard and Valencia-Posadas2013) for Nubian and Toggenburg breeds in the United States. The average SCS observed was greater than the 2.85 reported by Valencia-Posadas et al. (Reference Valencia-Posadas, Lechuga-Arana, Ávila-Ramos, Shepard and Montaldo2022) for Nigerian Dwarf. The study conducted by Vacca et al. (Reference Vacca, Stocco, Dettori, Pira, Bittante and Pazzola2017) revealed that the coefficients of variation (CV) were 59% for milk yield, 50% for fat and protein yield. The value of CV for SCC compared to SCS was higher. The elevated coefficient of variation can be attributed to the skewed distribution of the SCC values. The coefficient of variation (CV) of the SCS was found to be 31%, which is similar to the 35% reported by Vavcca et al. (Reference Vacca, Stocco, Dettori, Pira, Bittante and Pazzola2017) in several breeds. However, this value is significantly lower than the 45.28% reported by Valencia-Posadas et al. (Reference Valencia-Posadas, Lechuga-Arana, Ávila-Ramos, Shepard and Montaldo2022) for Nigerian Dwarf.
Estimating the heritability of a trait is a pivotal aspect in designing effective breeding programmes. Heritability refers to the proportion of phenotypic variation in a trait that is attributable to genetic variation among individuals within a population. In this study, the heritability estimates of dairy traits are within the range reported in different goat populations, as summarised in Tables 1–2, with values for DMY (0.10–0.45), DMFY (0.10–0.40), DMPY (0.10–0.34), and SCS (0.02–0.32). Among the traits studied, DMY is more significantly influenced by additive genetic effects than the other traits. This indicates that the genetic contribution to the variation in DMY is stronger compared to traits such as DMFY, DMPY, and SCS. DMFY and DMPY traits are crucial for milk quality. While they are influenced by genetics, environmental factors such as diet and management practices also play a significant role. Moderate heritability for milk and protein yield has been reported for Alpine goats by Scholtens et al. (Reference Scholtens, Lopez-Villalobos, Garrick, Blair, Lehnert and Snell2020) in the New Zealand, Mucha et al. (Reference Mucha, Mrode, Coffey and Conington2014) in the UK, and Mabrouk et al. (Reference Mabrouk, Shaat and Bata2009) in Egypt. The heritability estimate for DMY was found to be lower than previous published results as described in Table 1 for various other goat breeds, which typically range from 0.15 to 0.24 (Mucha et al., Reference Mucha, Mrode, Coffey and Conington2014; Jembere et al., Reference Jembere, Dessie, Rischkowsky, Kebede, Okeyo and Haile2017; Valencia-Posadas et al., Reference Valencia-Posadas, Lechuga-Arana, Ávila-Ramos, Shepard and Montaldo2022). In various studies, the heritability estimates for fat and protein yields obtained from 0.10 to 0.43 (Analla et al., Reference Analla, Jimenez-Gamero, Munoz-Serrano and Serradilla1996; Brito et al., Reference Brito, Silva, Melo, Caetano, Torres, Rodrigues and Menezes2011; Scholtens et al., Reference Scholtens, Lopez-Villalobos, Garrick, Blair, Lehnert and Snell2020). The heritability estimate for fat yield reported by Valencia-Posadas et al. (Reference Valencia-Posadas, Lechuga-Arana, Ávila-Ramos, Shepard and Montaldo2022) was 0.15, which closely matches the results of the present study. The results for DMPY are consistent with the findings of other studies. Different estimates for the heritability of DMPY have been reported, ranging from 0.10 in the Nigerian dwarf breed (Valencia-Posadas et al., Reference Valencia-Posadas, Lechuga-Arana, Ávila-Ramos, Shepard and Montaldo2022) to 0.34 in the Saanen breed (Rupp et al., Reference Rupp, Clément, Piacere, Robert-Granié and Manfredi2011). The heritability values for various traits can differ across populations and environments. The moderate heritability of milk yield and protein yield suggests that selective breeding can effectively improve these traits. Therefore, a substantial genetic enhancement can be achieved in a relatively short period, especially when the selection is guided by accurate genetic assessments.
SCS is an indicator of udder health and mastitis resistance (Amin, Reference Amin2018). The heritability (h2) estimate for somatic cell score (SCS) aligns with the range reported in previous studies (Table 2). However, it is noteworthy that this value is not consistent with our findings. While the majority of the literature reports moderate heritability estimates for this trait, our results indicate a lower heritability, suggesting that genetic factors play a relatively limited role in influencing SCS in the studied population. Instead, environmental conditions, management practices, overall herd health appear to have a more substantial impact on SCS variability. Maroteau et al. (Reference Maroteau, Palhière, Larroque, Clément, Ferrand, Tosser-Klopp and Rupp2014) reported low heritability estimates for SCS, which ranged from 0.09 to 0.15 in Saanen and Alpine breeds. In agreement with our results, the heritability of Somatic Cell Score in Alpine goats was estimated to be 0.02 (Arnal et al., Reference Arnal, Larroque, Leclerc, Ducrocq and Robert-Granié2020). The h2 values for SCS in French Alpine and Saneen breeds were 0.20 and 0.24 (Rupp et al. Reference Rupp, Clément, Piacere, Robert-Granié and Manfredi2011) and 0.24 for Spanish Florida goats (Jimenez-Granado et al. Reference Jiménez-Granado, Molina, Sánchez Rodríguez, Ziadi and Menéndez Buxadera2023). These values were higher than those estimated for Murciano-Granadina goats in this study. The heritability estimates for DMY, DMFY, DMPY, and SCS in goats provide valuable insights for breeding programme design. In contrast, the lower heritability of fat yield highlights the importance of environmental and management factors alongside genetic selection. The very low heritability of SCS underscores the need for enhanced management practices to improve udder health. By integrating genetic and environmental strategies, breeding programmes can optimise productivity and health in goat populations, ensuring comprehensive improvements across various traits.
In our study, the genetic correlations between DMY and DMFY, DMY and DMPY, DMY and SCS, DMFY and DMPY, DMFY and SCS, and DMPY and SCS were 0.07, 0.16, 0.42, –0.08, –0.005, and 0.04, respectively. These results provide insights into the genetic relationships among these traits and their implications for breeding programmes. Comparing with published literature as summarised in Table 3, genetic correlations for milk yield and fat yield range from –0.89 to 0.84, milk yield and protein yield from –0.65 to 0.94, and milk yield and SCS from –0.06 to 0.12. Fat yield and protein yield correlations range from 0.80 to 0.93, milk yield and SCS from –0.12 to 0.59, fat yield and SCS from –0.13 to –0.01, and protein yield and SCS from –0.10 to 0.10.
The genetic correlations between dairy traits and SCS in cattle predominantly indicate unfavourable relationships, suggesting that higher milk production is associated with elevated somatic cell counts (Mrode and Swanson, Reference Mrode and Swanson1996). In dairy goats, there is considerable variability in the estimated genetic correlations between milk yield and somatic cell score, with values ranging from antagonistic of 0.25 to 0.59 (Bagnicka et al., Reference Bagnicka, Lukaszewicz and Ådnøy2016; Valencia-Posadas et al., Reference Valencia-Posadas, Lechuga-Arana, Ávila-Ramos, Shepard and Montaldo2022) to favourable values between –0.12 and –0.20 (Aspilcueta-Borquis et al., Reference Aspilcueta-Borquis, Araujo Neto, Baldi, Bignardi, Albuquerque and Tonhati2010; Scholtens et al., Reference Scholtens, Lopez-Villalobos, Garrick, Blair, Lehnert and Snell2020). In agreement with our results, Valencia-Posadas et al. (Reference Valencia-Posadas, Lechuga-Arana, Ávila-Ramos, Shepard and Montaldo2022) found that the genetic correlation between MY and SCS in Nigerian dwarf goats was positive. Our findings, particularly the higher DMY-SCS correlation (0.42), suggest a stronger link between milk yield and udder health, indicating a need for balanced selection strategies in breeding programmes. To address this challenge, breeding programmes can implement selection indices that integrate both production and health traits. By assigning appropriate economic weights to each trait, genetic progress in milk yield can be achieved while maintaining or improving udder health. Furthermore, genomic selection provides opportunities to enhance the accuracy of selecting animals that excel in both production and health traits. Positive genetic correlation was detected between SCS and DMPY, with an estimated value of 0.04. The findings indicate that an increase in somatic cell count correlates with higher levels of milk and protein yield. A genetic correlation of –0.005 was observed between DMFY-SCS. This result is consistent with the estimate of –0.17 reported by Aspilcueta-Borquis et al. (Reference Aspilcueta-Borquis, Araujo Neto, Baldi, Bignardi, Albuquerque and Tonhati2010). The low genetic correlation between fat yield and SCS suggests that improving fat yield will not significantly impact udder health. These results emphasise integrating genetic selection with management practices for sustainable improvements. The observed phenotypic correlation between dairy traits and somatic cell score in this study varies from –0.16 to 0.34, consistent with previous literature findings (Bélichon et al., Reference Bélichon, Manfredi and Piacère1999; Torres-Vázquez et al., Reference Torres-Vázquez, Valencia-Posadas, Castillo-Juárez and Montaldo2009; Valencia-Posadas et al., Reference Valencia-Posadas, Lechuga-Arana, Ávila-Ramos, Shepard and Montaldo2022). The phenotypic correlation between milk yield and somatic cell score observed in this study was 0.34, which aligns with the findings reported in previous literature (Wu et al., Reference Wu, Heringstad, Chang, De los Campos and Gianila2007; Valencia-Posadas et al., Reference Valencia-Posadas, Lechuga-Arana, Ávila-Ramos, Shepard and Montaldo2022). Notably, milk yield has a moderate to strong genetic and phenotypic association with SCS, while other traits like fat yield and protein yield show varying degrees of correlation with SCS. The results can help guide breeding strategies by identifying relationships between traits and their impacts on milk production and udder health.
Conclusion
This study shows that DMY in goats has a moderate heritability (0.244), suggesting potential for genetic improvement, whereas DMFY, DMPY, and SCS have lower heritabilities, indicating significant environmental influence. SCS, a key indicator of udder health, shows very low heritability, emphasising the importance of management practices. Genetic and phenotypic correlations highlight the complex relationships among traits, with notable associations between milk yield and SCS. Effective breeding programmes should combine genetic selection with optimal management to enhance milk production and udder health.
Acknowledgements
The authors are grateful to the head and coworker of the Murciano-Granaina goat breeding farm for providing the raw data and allowed to use them.
Author contributions
GE and MBZ conceived and designed the study. MT performed statistical analyses and wrote the primary version of the manuscript. AB conducted data collection. GE and MBZ edited, revised and improved the final draft. The final manuscript has been read and approved by all authors.
Funding statement
This research received no specific grant from any funding agency, commercial or not-for-profit sectors.
Competing interests
The authors declare there are no conflicts of interest.
Ethical standards
Not applicable.