I. INTRODUCTION
Investigating oxide glasses under irradiation is a subject of great interest not only for nuclear applications but also for applications in nanotechnology. In particular, high energy electron irradiation can modify the local properties, structure, and composition of glasses, Reference Jiang1 including phase separation, precipitation, gas bubble formation, alkali migration, volume expansion, shape transformation, and crystallization. Reference Weber, Ewing, Angell, Arnold, Cormack, Delaye, Griscom, Hobbs, Navrotsky, Price, Stoneham and Weinberg2–Reference Cassingham, Stennett, Bingham, Hyatt and Aquilanti5 The irradiation resistance of oxide glasses has been the subject of much research focused on the immobilization of radionuclides. Borosilicates Reference Weber, Ewing, Angell, Arnold, Cormack, Delaye, Griscom, Hobbs, Navrotsky, Price, Stoneham and Weinberg2 and zinc borosilicates Reference Cassingham, Stennett, Bingham, Hyatt and Aquilanti5 have been widely explored for their loading limits with extra cations and under a variety of ion, gamma, and electron irradiations.
On the other hand, the fabrication of metal nanoparticles in glass has attracted much attention due to their unique applications in different fields, such as electrical charge storage Reference Nakajima, Futatsugi, Nakao, Usuki, Horiguchi and Yokoyama6 and light emission. Reference Borany, Grötzschel, Heinig, Markwitz, Matz, Schmidt and Skorupa7
Electron beams in transmission electron microscopy (TEM) have been used to generate nanometer-sized particles in oxide glasses, with the beam serving simultaneously as imaging and fabrication tools (in situ fabrication and characterization). This approach has significant importance in elucidating the atomic mechanisms behind this process and in line control of the shape, size, and distribution of nanoparticles. Reference Jiang, Qiu and Spence8,Reference Ito, Jain and Williams9 Jiang et al. Reference Jiang, Qiu and Silcox10,Reference Jiang, Qiu, Ellison and Silcox11 reported the precipitation of crystalline zinc nanoparticles about 7 nm in diameter in zinc-rich borosilicate glass under high intensity electron irradiation. Formation of metallic zinc nanocrystals about 7–10 nm in size embedded in an amorphous silica layer by electron beam irradiation of a zinc oxide thin film on silicon substrate has been reported by Kim et al. Reference Kim, Shin, Lee, Jung, Lee, Choi and Jin12 Amorphous zinc nanoparticles were initially formed under thermal annealing followed by prolonged irradiation. Further irradiation resulted in phase transformation into crystalline zinc nanoparticles. These preliminary Zn particle formation studies used uniform irradiation without attempt at patterning.
On the other hand, patterned particle formation in glasses is known, e.g., via ion implantation through nanoporous masks for cobalt implanted into amorphous silica Reference Guan, Ross, Bhatta, Ghatak, Peng, Inkson and Möbus13 and for zinc implanted into both crystalline CaF2 and amorphous silica. Reference Liu, Mu, Xu, Lu, Shen, Fan, Henderson and White14 Against this background, “direct write” electron beam patterning of initially uniform glasses without a mask appears to be promising due to its greater flexibility and resolution. Outside the field of glasses, electron beam induced preparation of metal nanoparticles from their precursors has been demonstrated in a variety of materials. Reference Li and Zhang15–Reference Ghatak, Guan and Möbus18
Our study on Zn nanocluster and nanocrystal formation derives its importance from the ability to generate nanoplasmonic surface-near arrays in a transparent matrix, e.g., for light-coupling applications (such as Ag in borosilicates Reference Penninkhof, Polman, Sweatlock, Maier, Atwater, Vredenberg and Kooi19 ). After oxidation of the Zn nanocrystals to ZnO, these may find applications as UV-range semiconductor quantum dots, as previously attempted with ion implantation. Reference Liu, Mu, Xu, Lu, Shen, Fan, Henderson and White14 We aim at advancing earlier studies in the directions of nanoscale pattern formation by TEM direct-write, assessing glass compositional influence and tracking particle formation in situ.
II. MATERIALS AND EXPERIMENTAL PROCEDURES
The experimental process consists of the three steps of bulk glass melting, sample preparation via powder crushing, and irradiation with imaging and spectroscopy.
A. Glass composition selection and melting
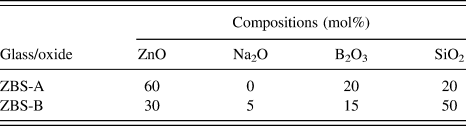
Zinc borosilicate glasses of two compositions, labeled ZBS-A and ZBS-B (Table I), have been chosen for the purpose of irradiation-induced precipitation and even more so for spatial patterning, the glass composition needs to be close to phase separation/precipitation and quenched into a frit, to suppress any particles before irradiation. One suitable candidate is zinc-rich borosilicate glass (ZBS-A). This glass is well established as a candidate material for phosphorescence applications (with Mn or Pr doping), Reference Ehrt20 and its high irradiation sensitivity has been reported by Jiang et al. Reference Jiang, Qiu and Silcox10 In addition, we have developed a low-zinc alkali-borosilicate glass (ZBS-B) with potential advantages: (i) Zn patterning is expected to show with higher Z-contrast between particle and matrix, (ii) the over-sensitivity of ZBS-A to weak electron irradiation with problems in pre and postpatterning imaging can be avoided, and (iii) it provides better compatibility with standard industrial composition ranges of borosilicates, widely used in areas ranging from laboratory glasses to nuclear waste glasses. Both together glasses A and B allow a basic study of the compositional influence on the irradiation and patterning processes.
Compositions of glass (mol%).

The glass batches have been prepared by mixing powders of zinc oxide, boric acid, sodium carbonate, and silica sand to obtain 300 g glass melt. The mixture was then melted in a platinum crucible and electric furnace at 1450 and 1300 °C for ZBS-A and ZBS-B, respectively. To ensure glass miscibility for the low-Zn range, a small amount of alkali was added. Reference Taylor and Owen21
B. TEM sample preparation
Electron microscope specimens were prepared by grinding the quenched glass frits into a very fine powder in acetone using a pestle and mortar. To reduce agglomeration, the powder-suspension was then ultrasonicated for 15 min. Then, a small amount of the powder was placed on a holey carbon film supported by a copper grid.
C. Electron irradiation process
The electron beam irradiation and patterning were carried out in a JEOL JEM 2010F field emission gun (FEG) TEM and a JEOL JEM 3010 LaB6 thermal filament TEM (Tokyo, Japan), operating at 200 and 300 keV, respectively. Different electron beams with varying intensities in different modes have been used in the irradiation, including stationary irradiation using an electron beam of >100 nm diameter and patterning by line-scan mode using a highly focused e-beam of <10 nm diameter. During imaging of the results, spreading the e-beam to »100 nm was necessary to stop further irradiation modifications. Electron energy loss spectroscopy (Gatan GIF 200, Pleasanton, CA) and scanning transmission electron microscopy (STEM) have also been conducted in the JEM 2010F. The irradiation is conducted on both TEMs with largest condenser aperture, spot size 1, except for one experiment (Fig. 5), where any condenser aperture has been removed, as detailed below.
III. RESULTS
Experiments in irradiation induced Zn precipitation are sorted into stationary and pattern-forming beam-control, followed by special experiments observed along the main objective of precipitation-patterning.
A. Stationary e-beam irradiation
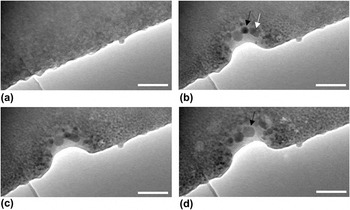
Figure 1 shows TEM images of the low-ZBS-B prior to electron irradiation and the same region after successive steps of irradiation. The thin edge of this glass fragment is suspended on a holey carbon film visible at the bottom left, but most of the field-of-view shows the glass over a carbon-hole.
Low-ZBS-B fragment (a) before and (b–d) after 1, 3, and 6 min of electron beam irradiation, respectively (JEM 3010 TEM at 300 keV). Scale bar = 90 nm. Irradiation of 105 ± 15 pA/cm2 (main screen), see the text for details.

Initially, the glass sample is relatively homogeneous apart from surface roughness and the speckle characteristic of the amorphous structure; see Fig. 1(a). The high intensity electron beam, which can be quantified to carry around 25–30 nA (from a 105 ± 15 pA/cm2 main screen reading, see the Discussion section for more details), resulted in partial glass ablation and formation of nanoparticles in parallel. Irradiation at rest generated a mostly ring-shaped nanoparticle pattern with a size range inverse to the distance from the e-beam center indicating a nucleation and growth process most advanced under the peak intensity. With increasing irradiation time, some nanoparticles in the center of e-beam coalesced with each other forming larger nanoparticles. For example, a roundish nanoparticle of about 32 nm in diameter [black arrow in Fig. 1(b)] merged with the adjacent nanoparticle [white arrow in Fig. 1(b)] producing a larger rectangular nanoparticle of 26–66 nm diameter at 3 min irradiation. This nanoparticle transformed to a faceted-shaped nanocrystal [arrow in Fig. 1(d)] with further irradiation. The final nanocrystal has a 35–46 nm oval shape (measurements accurate to ±1 nm).
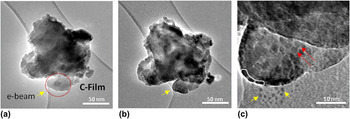
In Fig. 2, the dotted area in Fig. 2(a) has been irradiated using a broad electron beam for prolonged time. Before any electron irradiation, no indication of precipitates or phase separation can be seen, except for a small piece of glass fragment attached to the top of this area. The carbon film is initially clean as well. After about 20 min of irradiation [Fig. 2(b)], nanoparticles have formed, and there is rounding of the rough surfaces of the glass. Reference Möbus, Yang, Saghi, Xu, Hand, Pankov and Ojovan4 Some of the fabricated nanoparticles are faceted [red arrows in Fig. 2(c)], others are spherical, and a few have elliptical morphologies.
Low-ZBS-B fragment (a) prior to irradiation and (b) after about 20 min irradiation (JEM 3010 TEM at 300 keV) of the ringed region in (a). (c) Magnified image of the ringed area in (a) after irradiation.

Unlike the case shown in Fig. 1, no glass ablation was observed and this is due to the medium intense electron beam irradiation used here. A chain of nanoparticles of about 6 nm in diameter has been found at the edge of the irradiated glass area [highlighted by the white contour in Fig. 2(c)]. Some ablation of the carbon film due to irradiation can also be seen [shown by the yellow arrow in Fig. 2(b)] while particles on the carbon film [yellow arrows in Fig. 2(c)] are discussed below (see Sec. III. C. 2).
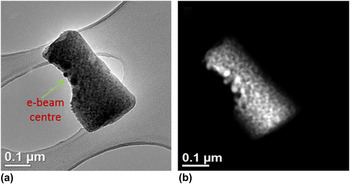
Figure 3 shows bright field (BF) and annular dark field (ADF) images of a ZBS-A fragment after prolonged irradiation.
(a) BF TEM and (b) ADF STEM micrographs of an irradiated ZBS-A fragment (JEM 2010F TEM at 200 keV).

This fragment has been initially fully irradiated using a low intensity electron beam for a prolonged time, and this resulted in small nanoparticles about 5–7 nm in size being precipitated throughout. Then, high intensity electron beam has been used to irradiate the lower left edge of the glass fragment as indicated in Fig. 3(a). During this stage, irradiation at rest using a stationary e-beam produced mostly spherical nanoparticles about 20–40 nm in size. Here, the competition of partial glass ablation and nanoparticles formation is also evident. Especially, surface decoration of the glass with nanoparticles sticking out can be seen at the bottom-left edge. These nanoparticles show bright atomic number contrast in the ADF image [Fig. 3(b)], supporting the presence of metallic Zn over ZnO as Zn is the heaviest atom in this glass (Z = 30); however, full confirmation of the metallic identity is derived from electron energy loss spectroscopy (EELS) spectra and high resolution transmission electron microscopy (HRTEM) images [Fig. 4].
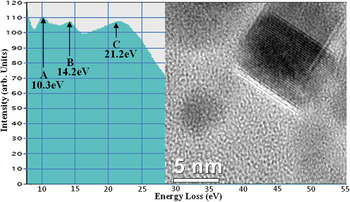
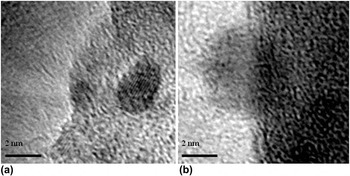
EELS spectrum for ZBS-A after several minutes of electron irradiation. Peaks A−C are close to literature data for Zn M4,5 core edge, Zn-bulk plasmon, and glass bulk plasmon, respectively. Inset: HRTEM image of a typical particle.

The EELS spectrum has been acquired from the region of peak-irradiation in Fig. 3. The energy scale is re-calibrated via another low-exposure (noisy) spectrum including the low-loss region and the zero-peak. From the figure, three prominent peaks can be identified around 10.3, 14.2, and 21.2 eV. The first peak with an onset just below 10 eV matches the core level excitation (M4,5 edge) of metallic zinc, expected at 9.4 eV onset, as predicted by Widder et al., Reference Widder, Knupfer, Knauff and Fink22 and is also consistent with literature. Reference Jiang, Qiu and Silcox10,Reference Ahn, Krivanek, Burgner, Disko and Swann23 The second peak matches well the zinc volume plasmon signal. Reference Widder, Knupfer, Knauff and Fink22 This Zn metal-specific signal is well below the possible alternative zinc oxide plasmon of 18.8 eV, Reference Jiang, Qiu and Silcox10,Reference Hengehold, Almassy and Pedrotti24 which we never observed, and therefore, confirming our particles as metallic. The third peak is the matrix contribution for the borosilicate glass, recorded mainly in a hole of the carbon carrier film (Fig. 3). The inset shows a lattice resolved nanoparticle by HRTEM with fringe spacings conforming with metallic Zn (010) planes. However, repeat measurements of multiple particles, all showing single fringe systems only, range from 0.21 to 0.28 nm giving less clear evidence of Zn versus ZnO, accounting for errors in the scale bar and the poor signal-to-noise ratio, such that the main evidence for a majority of metallic Zn remains with the EELS data.
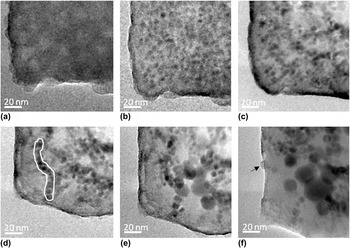
In particular, interest is the live observation of nanoparticle growth under electron irradiation as shown in Fig. 5 for a low-ZBS-B fragment. Prior to the irradiation, the condenser aperture has been removed to allow a relatively high current to be spread over the entire glass fragment. The glass fragment has initially rough surfaces and is homogenous with no nanoparticles [Fig. 5(a)]. Then, a uniform distribution (homogenous nucleation and precipitation) of particles (average diameter ∼5 ± 2 nm) is found after 3 min irradiation [Fig. 5(b)]. Surprisingly, during the next 3 min [Fig. 5(c)], the particle size increases only marginally but introduces a de-homogenization of the particle distribution, which occurs with clusters of particles appearing dark separated by very bright bands of Zn-depleted BS-glass. Another 3 min of irradiation [Fig. 5(d)] results in the formation of particle chains, the longest of which (highlighted by the white contour) is about 100 nm long and consists of 11 nanoparticles.
Time series TEM images of low-ZBS-B at (a) 0 min, (b) 3 min, (c) 6 min, and (d) 9 min electron irradiation; (e, f) more focused irradiation initiating growth to >10 nm diameter particles (JEM TEM 2010F at 200 keV).

Subsequently, the irradiation level was applied via a more focused beam (following reinsertion of the condenser aperture) and moved across the center/right region of the field of view [Fig. 5(e)]. Now sudden particle growth (as seen previously in Figs. 1 and 3) is found, and different nanoparticle morphologies such as hexagonal, square, and spherical can be seen. The spherical nanoparticle sizes are 16 ± 7 nm. Appearance of even larger patches of particle-free glass indicates that the growth process is sustained by ripening and not by further precipitation; quite possibly, the glass was already losing its Zn content during the initial irradiation [Figs. 5(a) and 5(b)], with all subsequent changes being rearrangement of metallic Zn. Another step of high intensity irradiation over the entire field of view resulted in a few even larger particles up to a maximum size of ∼35 nm [Fig. 5(f)]. Faceted cubic, hexagonal, and spherical shapes are now observed.
B. Line-scan patterning
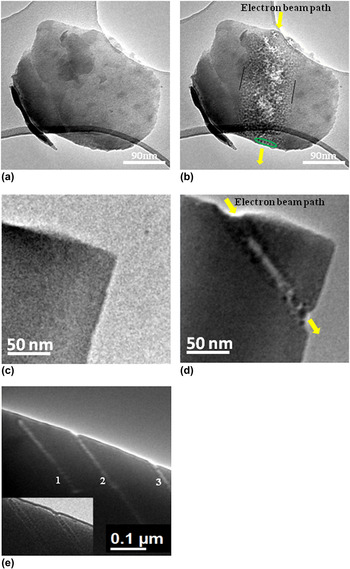
Line-scan patterning has been conducted in TEM mode by using manual movement of the electron beam. Probes of various diameters, as achievable for FEG and thermal gun TEM, have been applied. The probe diameter has been set up outside the glass fragment before moving the beam into the glass-material to minimize changes prior to the irradiation. Figure 6 summarizes line scans for ZBS-A.
Line-scan irradiation of ZBS-A using a LaB6 gun TEM in (a, b) and a FEG TEM in (c, d). (e) A pattern of three parallel lines made by a sub-10 nm focused electron beam in the FEG-TEM.

In Figs. 6(a) and 6(b), a roundish glass fragment about 400 nm diameter has been traversed vertically by a thermal gun TEM beam of ∼90 nm diameter at 300 keV in 10 steps of 1–2 s exposure along a line indicated by the yellow arrows. The original glass is homogeneous except for some small attached glass fragments in different locations, see Fig. 6(a). After irradiation [Fig. 6(b)], a graded pattern of particles can be seen with particle size reducing the further the lateral distance from the beam path. There is no evidence that particles are formed without irradiation, and it is believed that the size distribution follows the Gaussian shape of the beam. Particles formed are generally round and at the center of the line, possible glass ablation is found indicated by bright patches, although no ablation is seen at the fragment edges. Where the glass matrix is thinnest, e.g., at the bottom edge, another example of a chain-like periodic order arrangement of neighboring particles is seen (highlighted by the green contour). In the thicker regions, such order is hidden due to random 3D projection effects. The outside border line where the finest precipitates neighbor undisturbed glass matrix is rather sharp indicating beam intensity drop-off rather than temperature distribution as the key-effect.
A finer electron beam can be obtained more readily in FEG TEM than in LaB6 gun TEM. Figures 6(c) and 6(d) show ZBS-A prior to and after line-scan irradiation using a sub-10 nm focused electron beam. The electron beam was manually scanned with the step-length being smaller than the beam diameter to generate a continuous line. The imprint suggests a diameter of <10 nm. Each irradiation point in the scan is being held for about 10 s with the intermittent time for moving the beam negligible. This was sufficient for partial glass ablation in the center of the line. Precipitates are, for the most part of the scan, found at either side of the center, such forming two dark lines of small nanoparticles [Fig. 6(d)]. A few larger particles with sizes of about 14 nm, however, formed at the center of the track, near the exit edge. Figure 6(e) shows a pattern of three parallel lines indicated by 1, 2, and 3 with a distance of 127.5 nm from 1 to 2 and 202 nm from 2 to 3, recorded at two defocus values to enhance the visibility of details.
C. Secondary irradiation effects
While the main aim of the research was to examine patterning opportunities, the above experiments also showed details worth reporting in the field of general irradiation physics of oxide glasses.
1. Particle ordering
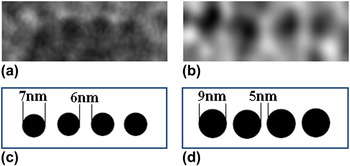
Occurrence of particle chains or sequences of precipitates with ordered spacing has been mentioned briefly. Inducing order into a precipitation process in glass has been achieved in the past by external patterning, either via laser gratings Reference Nishiyama, Miyamoto, Matsumoto, Saito, Fukumi, Kintaka and Nishii25 or ion implantation masks; Reference Guan, Ross, Bhatta, Ghatak, Peng, Inkson and Möbus13 however, in our experiment, only self-organization may apply (as reported by Mohr et al. Reference Mohr, Dubiel and Hofmeister26 ). It is well known that following a nucleation event during phase separation and precipitation phenomena (with and without spinodal decomposition), the glass matrix will be locally altered [depleted in the separated element(s)], and therefore, the statistically most probable random next nucleation event will occur at a minimum distance from the first one, related to the diffusion length. At a thin glass edge, where no overlap in imaging direction occurs, one could expect particles to occur with a mean periodic distance from each other and a characteristic gap between each other. In Fig. 6(b), this seems to be the case, and more examples are shown in Fig. 7. The chains of Fig. 5, however, contradict this theory of formation. First, the particles only coagulate after prolonged irradiation, while they pre-exist without chain-order for shorter irradiation times. Second, the 1D chain in Fig. 5 is not due to edge-geometry but adopted during coagulation. This observation could point to a liquid-like intermediate stage of the Zn particles, but no necking or merging is happening, which would support this idea, rather some small gaps separating the nanoparticles persist and prevent an atomic-level attachment-chain.
(a, b) Nanoparticle ordering. (c, d) Schematic diagram of (a, b) showing the particle size and the distance between the particles.

2. Carbon film decoration
One experiment, see Fig. 2(c), revealed formation of small nanoparticles about 1–2 nm in diameter on the C-film next to the irradiated area of the low-ZBS-B. This is similar to other reports of nanoparticle synthesis by in situ TEM via migration of ablated atoms into a circular zone around the irradiated material on the carbon film where, after sufficient “cooling” outside the e-beam, the nuclei stop and ripen into nanoparticles. Although previously reported for noble-metal particles and halide salts, Reference Ghatak, Guan and Möbus18,Reference Gnanavel and Möbus27 this phenomenon is not known from oxide glasses. However, as our images reveal Zn particles aligned on the surface of the glass fragment under irradiation, it is possible that the migrated Zn stems from preprecipitated particles. Alternatively, electron beam-induced electric fields inside the irradiated insulating glass region Reference Cazaux28 might be followed by ejection of charged clusters or by a combination of charged atomic ablation followed by surface diffusion.
3. Radiation induced fluidity (RIF)
During the above precipitation experiments, the shape and surface details of the glass fragment irradiated have sometimes been significantly altered. This phenomenon has so far been reported for more conventional alkali-borosilicate type glasses but not for zinc-glasses. “RIF” or “quasi-melting” is the expressions that have been used to characterize findings, which neither involve melting, Reference Mayr, Ashkenazy, Albe and Averback3,Reference Ajayan and Marks29,Reference Möbus, Ojovan, Cook, Tsai and Yang30 phase separation, or glass-ablation, but which manifest as a smoothing of rough surfaces, rounding-off of overall shape (up to perfect ball formation from a rugged fragment), and filling of cavities or shrinking/rounding-off of holes governed by surface tension forces and minimization of surface energy. Bulk and (predominantly) surface diffusion are enhanced as a result of continuing bond-breaking, radiolysis-style atom displacement, increased vacancy generation, and consequently enhanced diffusion constants. Good examples of surface rounding are seen in Fig. 2 [yellow arrows 2(a) versus 2(b)] and Fig. 5.
Round Zn particles are also found (Fig. 8). On one occasion, a precipitated Zn particle appears to approach a full spherical shape of “molten-like zinc” with a diameter of about 8 nm, situated at the edge of a glass fragment indicated by the arrow in Fig. 5(f) and a higher magnification image of this particle shown in Fig. 8(b). The visibility of lattice fringes, see Fig. 8(a), indicates that roundness is not coincident with a molten state, although a short term intermediate amorphous state cannot be excluded. Reference Ghatak, Guan and Möbus18
(a) HRTEM image and (b) molten-like shape of zinc nanoparticles in low-ZBS-B. JEM 2010F TEM at 200 keV.

4. Cation migration
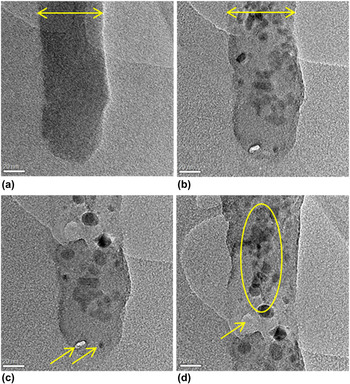
During a further FEG-TEM experiment (Fig. 9), irradiation has been focused on a thin and long glass-rod fragment. These occur by chance as a result of the grinding process in addition to more common rough particles. Focusing the beam to a diameter identical to the rod diameter leads to Zn particles aligning right in the center of the rod avoiding surface-near regions [Fig. 9(d), encircled]. In some rod-irradiation experiments under these moderately focused conditions, a diameter-widening of the rod has been observed [Fig. 9(a) versus 9(b)], pointing to possible “un-densification”, porosity, or flattening of the cylindrical rod as intermediate stage. This process is, however, in competition with ongoing glass ablation. Focusing the beam to diameters smaller than the rod leads to accelerated brightening (loss of Zn mass thickness contrast) due to migration of Zn, expelled from the tip-region at the bottom of the rod, Fig. 9(c), except for one particle (arrowed). Ultimately, for one experiment with beam diameter ∼2 nm, complete glass ablation occurs (hole drilling, Fig. 9(c), other arrow).
High-ZBS-A rod (a) before, (b) and (c) after 3 and 13 min of electron beam irradiation, respectively. (d) An extended vertical region of the glass rod in (c) (JEM 2010F TEM at 200 keV, total current of 4.2 nA, see the Discussion section for details). Arrows in (a, b) indicate rod-widening, arrows in (c) indicate hole drilling and an isolated Zn particle, respectively, arrow in (d) indicates local glass ablation, while the circle indicates central Zn migration.

IV. DISCUSSION
Earlier research (see Refs. Reference Weber, Ewing, Angell, Arnold, Cormack, Delaye, Griscom, Hobbs, Navrotsky, Price, Stoneham and Weinberg2 and Reference Jiang, Qiu and Silcox10 and citations therein) on electron irradiation of alkali, alkaline-earth, and Zn borosilicate glasses has developed a comprehensive theory of irradiation mechanisms involved, emphasizing the relatively low importance for knock-on damage and thermal effects, Reference Möbus, Ojovan, Cook, Tsai and Yang30,Reference Hobbs31 while the key-process was postulated to be the bond-breaking of Zn–O ionic bonds along with change of ionic valence, mainly involving nonbridging oxygens. This is followed by rapid migration of the liberated cations driven by electrostatic fields from local charging due to loss of secondary and Auger electrons. Our research is compatible with these findings; however, as we use TEM with a large variety of irradiation diameters instead of STEM, we find some further complementary evidence: (i) beam diameters larger than a few tens of nm no longer trigger cation migration out of the illuminated area but rather enhance diffusivity to facilitate growth of already nucleated precipitates. For more focused FEG-TEM beams [Figs. 6(c) and 6(d), 9(c) and 9(d)], there is, however, evidence that metal migrates away from the center of irradiation, and therefore, two metal-lines are generated at either side of one beam line-scan; (ii) the second major result from our work is the simultaneous appearance of precipitation and glass-matrix ablation, while no evidence of oxygen vacancy clusters or bubbles was found. As these aspects are highly dependent on chosen irradiation levels, we, therefore, provide estimated exposure of our samples underlying above figures as follows, based on rough phosphor-screen readings (due to lack of accurate intensity measurement devices on the TEMs), with both TEMs operating with largest condenser aperture and spot size 1: For the LaB6 TEM (JEM 3010) readings of ∼105 ± 15 pA/cm2 (main screen) indicate ∼28.5 nA being focused on an imprint on the specimen fragment as shown in Figs. 1 and 2, giving 0.4 pA/nm2 current density. Multiplied by the irradiation time given in the figure captions, a total dose could be derived. For our FEG-TEM (JEM 2010F) experiments, less accurate estimates are available (TEM mode only), given here for the conditions of acquisition in Fig. 9. With the total current of 4.2 nA being expectedly below the LaB6 TEM, the resulting current density focused on the specimen exceeds the one from the LaB6 TEM due to the >100-times finer focusing capability and equals, e.g., to about 103 pA/nm2 for 2 nm hole drilling in Fig. 9(c) (arrow), and 1.3 pA/nm2 for the beam diameter matching the rod diameter in Figs. 9(b)–9(d).
The glass ablation must involve liberation of B and Si atoms, all of much lower atomic number than Zn. While radiolysis is equally efficient to remove surface atoms, the low surface displacement energies in comparison to our 200–300 keV electrons would also allow knock-on displacements to contribute. Unlike in radiolysis, where metal cations are the most vulnerable atoms for displacement, in knock-on effects, Zn becomes the most stable due its high atomic number.
The calculated values of maximum transferred energies at 200 kV for B, O, Si, and Zn are found to be equal to 48.05, 32.47, 18.49, and 7.94 (in eV), respectively, which increase to 77.98, 52.69, 30.01, and 12.89 (in eV), respectively for 300 kV. In comparison with displacement energies, we expect that for metallic Zn, at any voltage of 100–300 kV, the displacement energy E d for Zn of 16 eV Reference Bradley and Zaluzec32 is not reached, although at 300 kV, it is close. On the other hand, for silica glass, the energy transfer at 200–300 kV for B, O (and closely for Si) exceeds the threshold for knock-on displacements, even more so for surface displacements, explaining some preferential ablation observed around and avoiding Zn particles, while radiolysis remains the main damage mechanism. In addition, energy transfer to Zn could happen indirectly via B recoil processes, liberating Zn at any of the two accelerating voltages.
The competition between precipitation and ablation has an essential influence on the question of where Zn metal particles form: most of our cases [Figs. 1, 5, 6(b), and 9] find all particles clearly subsurface at least 5 nm away from the projected glass fragment edge. This is further enhanced by time series observation of particle growth, where bigger particles never touch any surfaces. Only at more focused electron irradiation (e.g., Fig. 3), does the glass ablation rate exceed the rate of internal Zn particle growth, with Zn particles being found decorating the surface due to their longer resistance to ablation. The choice of Zn location via electron intensity could allow specific engineering of desirable optical surface properties, especially for nanoplasmonic applications.
A further noticeable effect, next to precipitation and glass ablation, is the surface smoothening observed in both our ZBS glasses, as reported before Reference Möbus, Ojovan, Cook, Tsai and Yang30 for alkali-borosilicate glasses. This involves RIF which causes sharp corners to become rounded due to surface tension, originated via high defect generation rates during radiolysis, high vacancy concentrations, and high diffusivities, even more so surface diffusivity. Parallel Zn-metal formation and ZBS matrix smoothing mean that the temperature must be lower than T m for Zn-metal adjusted for nanoscale particles and, therefore, provide evidence for “quasi-melting” type behavior.
The success of sub-100 nm patterning with a thermal gun electron beam [Fig. 6(b)] proves that the precipitation is irradiation-triggered and less of an indirect heating-annealing process as would apply for laser-irradiation. Temperature increases would be expected to spread across an entire sub-500 nm fragment during the several minutes of the experiment and blur the pattern. However, the FEG-TEM patterning experiments [Fig. 6(d)] on the other hand prove that the electron beam size is not a suitable estimate for patterning resolution, as Zn is found either side of the ablation-trace of the track (which itself can be larger than the pure beam) thereby blurring line-width by at least a factor two. Nonlocality of damage patterns with respect to a sub-nm beam size is also discussed in Ref. Reference Jiang1.
Comparison of the two glass compositions was meant to indicate the influence of the very different nature of glass network (especially silica content) and presence of extra alkali-modifiers (which increase formation of non-bridging oxygen). Since Zn is generally believed to act as network former intermixing as ZnO4 units with SiO4 (e.g., Ref. 5), extra Na included in glass B could have been expected to facilitate or accelerate irradiation response. However, the mainly noticeable effect was opposite, that is, the speed and amount of Zn precipitation go with the Zn content, and therefore, glass A decomposed much faster than glass B. This in turn lead to glass B being advantageous when precise beam-control matters, as it is easier to avoid unwanted preprecipitation during focusing before deliberate patterning starts.
V. CONCLUSION
In this work, Zn nanoparticle formation in Zn-borosilicate glasses via electron beam irradiation has been analyzed, and key-findings comprise: via EELS fine structure (mainly Zn plasmon) and HRTEM, we find that at least the majority of precipitated particles are metallic Zn rather than ZnO. For stationary irradiation, a circular pattern of particle sizes decreasing with distance from the beam-maximum is found. Time series exposure further confirms a nucleation and growth process with larger particles consolidating smaller ones, while the overall Zn volume fraction seems to saturate early. The low-Zn glass is found to precipitate slower, as aimed for, but does not show higher Z-contrast indicating perhaps that in both glasses, little Zn is left in the matrix. Preliminary findings indicate that patterning is possible, although delocalization of precipitation and irradiation will limit resolutions of patterns achievable. Generally, the response to irradiation (apart from rates and times) was surprisingly similar for both glasses examined.
ACKNOWLEDGMENTS
The authors thank the Iraqi Kurdistan Regional Government/Ministry of Higher Education and Scientific Research for the funding of the project as a part of Human Capacity Development Program (HCDP). We also thank Dr Ian Ross for helpful contribution.