I. INTRODUCTION
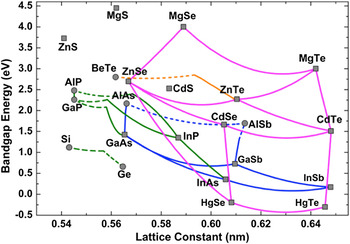
Optoelectronic semiconductors have evolved rapidly over the past half-century, with widespread applications emerging in many areas including emitters, detectors, communications, power generation, and solar cells used for displays. Existing devices are most often based on materials from the same isovalent and isostructural chemical family, such as Groups II–VI/II–VI (CdTe/HgTe), Groups III–V/III–V (InN/GaN, GaAs/AlAs, GaAs/InAs), or Groups IV/IV (Si/Ge). However, the wide diversity of substrates in common usage for these diverse applications makes it challenging to achieve monolithic device integration. Moreover, mismatch of lattice parameters invariably means that structural defects that occur during epitaxial growth can become a serious obstacle when attempting to optimize materials quality, while electron traps associated with these defects are likely to have a negative impact on electronic properties. One possible solution that could alleviate lattice-mismatch issues is to combine Group II–VI/Group III–V compound semiconductors. Reference Zhang, Wu, Ding, Yu and Johnson1 As illustrated in Fig. 1, a wide range of band-gap energies could be achieved by growing binary, ternary, or even quaternary Group II–VI alloys that are closely lattice-matched to common Group III–V substrates such as GaSb, GaAs, or InSb. Coverage of the wave length spectrum from far-infrared to near-ultraviolet would be possible. In addition, it should be appreciated that this alternative II–VI/III–V materials platform offers further potential benefits because of the occurrence of valence-mismatched or heterovalent interfaces, which provide an intriguing array of novel properties that arise directly from the absence of any common atom at the II–VI/III–V interface. Examples include: (i) mixtures of chemical bonding across the interface (II–V or III–VI bonds); (ii) novel transport properties, with high interfacial sheet charge; (iii) range of band offsets associated with local interfacial dipoles; and (iv) possible topological insulators. Very little has so far been done to exploit any of these opportunities, in particular to realize the potentially wide range of innovative device applications. The major reason for the lack of progress has been the inherent difficulty of growing these different II–VI and III–V materials together without suffering detrimental effects caused by cross-contamination. Very few growth facilities are currently available anywhere in the world that can satisfy this basic requirement, which should ideally involve transferring samples between different epitaxial growth chambers, preferably via a separate load-lock system.
Plot showing values of band-gap energy and lattice constant for many common semiconductors.

A detailed knowledge of sample morphology, especially defect microstructure, and its relationship to growth conditions, is essential when attempting to optimize crystal quality. The electron microscope provides imaging, diffraction, and analytical information that is indispensable to this feedback process. Recent advances in hardware for aberration correction in the electron microscope have enabled information limits well beyond the 1-Å barrier to be routinely obtained. Reference Haider, Uhlemann, Schwan, Rose, Kabius and Urban2–Reference Smith4 Thus, it has become straightforward to resolve projections of individual atomic columns, commonly termed “dumbbells”, in elemental and compound semiconductors, Reference Smith, Aoki, Mardinly, Zhou and McCartney5 making it possible, at least in principle, to determine detailed atomic arrangements at structural defects and interfaces. This paper presents a brief overview of our recent observations of compound semiconductors and heterovalent interfaces using the technique of aberration-corrected scanning transmission electron microscopy (AC-STEM). The advantages of using large-angle bright-field (LABF) imaging compared with high-angle annular-dark-field (HAADF) imaging for studying these materials are also emphasized.
II. EXPERIMENTAL DETAILS
All of the heterostructures described here were grown with 〈001〉-oriented commercial substrates using molecular beam epitaxy (MBE), which is widely recognized as the ideal technique for growing epitaxial layers of well-controlled stoichiometry and excellent crystallinity. The samples were prepared for electron-microscope observation in the cross-section geometry using standard mechanical polishing and dimpling, followed by argon-ion-milling, typically starting at ∼2.5 keV and finishing at ∼2.0 keV. The samples were kept at liquid-nitrogen temperature throughout the ion-milling process to minimize any milling-induced artifacts. Reference Wang, Smith, Tobin, Parodos, Zhao, Chang and Sivananthan6 The AC-STEM images were recorded with a JEOL ARM-200F (JEOL Ltd., Akishima, Japan), which has a guaranteed HAADF image resolution of 0.82 Å when operated in the probe-corrected imaging mode at an accelerating voltage of 200 kV. The beam convergence angle was set at ∼22 mrad, while the collection angles were usually set at 0–22 mrad for (incoherent) LABF imaging, and 90–150 mrad for HAADF imaging. The electron-beam direction used for observation was [110] for all samples.
III. RESULTS
A. Probe-corrected scanning transmission electron microscopy (STEM) imaging
The spherical aberration of magnetic lenses was for many years regarded as an insurmountable limit to the resolution achievable in the electron microscope. Reference Scherzer7 Successful aberration correction was first achieved off-line using focal-series reconstruction, Reference Coene, Janssen, Op De Beeck and van Dyck8 and also with off-axis electron holography. Reference Orchowski, Rau and Lichte9 Hardware incorporating multipole elements that is suitable for direct, online correction was later developed, both for the conventional transmission electron microscope, Reference Haider, Uhlemann, Schwan, Rose, Kabius and Urban2 and for the scanning transmission electron microscope. Reference Krivanek, Dellby and Lupini3 In addition, these corrector elements enable compensation of other common imaging defects, such as second- and third-order objective-lens astigmatism, as well as misalignment coma. Thus, the quality of more routine microscopy studies should be greatly improved when aberration correction is available.
The probe-corrected STEM allows further flexibility for imaging since several different postspecimen detector geometries are easily achieved.
Reference Smith, Aoki, Mardinly, Zhou and McCartney5
The most commonly used is the incoherent HAADF imaging mode, which offers strong atomic-number sensitivity. As an example, Fig. 2 shows a HAADF image of a one-monolayer-thick InN/GaN multiple quantum well sample, recorded in the
 $\left[ {11\underline 2 0} \right]$
projection, with a detector collection angle of ∼90–150 mrad. The In monolayer is well resolved and clearly visible in the image as a line of brighter contrast. The line profile shown at right confirms that the Ga and In atomic columns have different intensity levels, and also demonstrates an important result of this particular study, which was related to understanding the behavior of devices based on these materials, that the In is indeed confined to a single layer.
Reference Zhou, Dimakis, Hathwar, Aoki, Smith, Moustakas, Goodnick and McCartney10
(a) Probe-corrected HAADF STEM image of GaN/InN multiple-quantum well structure imaged in
 $\left[ {11\underline 2 0} \right]$
projection; (b) intensity line profile from area marked in (a) confirming single monolayer thickness of InN quantum well.
Reference Zhou, Dimakis, Hathwar, Aoki, Smith, Moustakas, Goodnick and McCartney10

B. LABF imaging
The bright-field (BF) geometry has rarely been used for high-resolution phase-contrast imaging with the STEM. The primary reason is the very poor image contrast resulting from the limited current available when using small detector collection angles. Spatial coherence (beam divergence) has been shown to limit resolution much less in a probe-corrected STEM instrument compared with an uncorrected STEM, so that the collection angle can be increased to several milliradians to give better signal-to-noise ratio without compromising performance. Reference Pennycook, Chisholm, Lupini, Varela, van Benthem, Oxley, Luo and Pantelides11 However, reversals in image contrast as a function of defocus can still limit intuitive image interpretation, which is similar to the situation with phase-contrast imaging in the conventional transmission electron microscope (TEM).
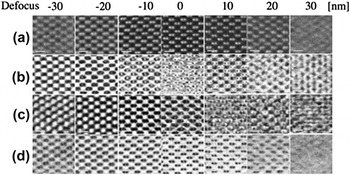
Recent bright-field AC-STEM imaging using an annular detector placed within the incident illumination cone has shown the possibility of distinguishing between light and heavy atoms. Reference Findlay, Shibata, Sawada, Okunishi, Kondo, Yamamoto and Ikuhara12 Our studies Reference Aoki, Lu, McCartney and Smith13 also indicate that there are several advantages accruing from simply using very large collection angles, comparable in size to the probe convergence angle, for bright-field imaging. These benefits are illustrated in Fig. 3, which compares experimental HAADF and BF images of a [110]-oriented GaAs specimen, which has an estimated thickness of 29 ± 3 nm. The top row, labeled (a), shows a series of HAADF images taken with 10-nm focal steps. The bright spots correspond to individual Ga and As atomic columns, which are well resolved, and the focus for optimum image contrast is clearly apparent. For comparison, the rows labeled (b), (c), and (d) show three series of BF images. Each series was taken with 10-nm focal steps and the collection angles were: (b) 0–7 mrad; (c) 0–12 mrad; and (d) 0–22 mrad, respectively. For series (b) and series (c), the image appearance changes rapidly with defocus, whereas the images in series (d), which were taken with the largest collection angle, are free of contrast reversals. The black spots in these latter images match exactly with the white spots in row (a) and correspond to the positions of atomic columns. Image features lose contrast and become blurred out upon shifting away from the zero defocus condition, which indicates that the optimum defocus is distinctive and easily recognized when using LABF imaging.
Experimental focal series of AC-STEM images for [110]-oriented GaAs specimen under different imaging conditions: (a) HAADF (collection angle: 90–150 mrad); (b) bright-field STEM (collection angle: 0–7.3 mrad); (c) bright-field STEM (collection angle: 0–12 mrad); (d) bright-field STEM (collection angle: 0–22 mrad).

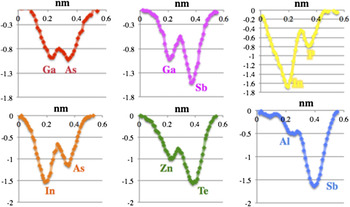
Six different compound semiconductors, all with zincblende cubic structure, have recently been studied using this incoherent LABF imaging mode, Reference Aoki, Lu, McCartney and Smith13 ranging from GaAs (ΔZ = 2) to AlSb (ΔZ = 38). Figure 4 shows intensity profiles from each of these materials, averaged over 10 dumbbells to improve signal-to-noise, and with intensity normalization relative to Zn to enable meaningful comparisons between the elements. The relative intensities are confirmed to be Z-dependent, but the Z-dependence is found to be less pronounced than with HAADF imaging. Reference Aoki, Lu, McCartney and Smith13 Moreover, the individual atomic columns are still visible and well resolved even for materials having low-Z elements or with large Z differences. Thus, the projected crystal polarity of these compound semiconductors can be readily determined using this LABF imaging mode, which could prove to be useful when attempting to determine atomic arrangements across interfaces.
Dumbbell intensity profiles for six different compound semiconductors averaged over 10 dumbbells and then normalized to Zn column intensity.

C. Ga-free InAs/InAs1−x Sb x type-II superlattices (T2SLs)
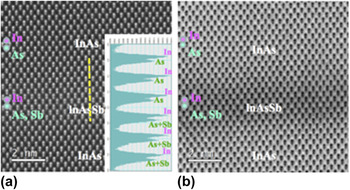
There is much current interest in using Ga-free InAs/InAs1−x Sb x T2SLs as alternative detector materials for mid-infrared and longer wavelengths, where control over SL period and/or Sb composition allows the desired band-gap engineering to be accomplished. Reference Steenbergen, Huang, Ryou, Ouyang, Li, Smith, Dupuis and Zhang14 The possibility of interfacial chemical diffusion linked with Sb segregation has been investigated, and has also triggered interest in using aberration-corrected electron microscopy as an investigative tool for studying these materials. Reference Lu, Luna, Aoki, Steenbergen, Zhang and Smith15 For example, Fig. 5 shows: (a) HAADF, and (b) LABF, AC-STEM images from an InAs/InAs1−x Sb x T2SL sample, showing separate InAs and InAs1−x Sb x layers at high magnification. The line profile superimposed on Fig. 5(a) clearly shows the difference in peak intensity levels corresponding to the individual In and As atomic columns. Moreover, the locations of the mixed As–Sb atomic columns can also be recognized by the changes in relative peak heights, as indicated.
HAADF (with intensity profile) and LABF pair of AC-STEM images showing InAs/lnAsSb (001) T2SL. (a) HAADF (collection angle: 90–170 mrad). Note difference between As versus As–Sb intensity profiles; (b) BF (collection angle: 0–22 mrad).

D. CdTe/InSb
There has been longstanding interest in the growth of epitaxial CdTe thin films, in particular because of potential solar-cell applications arising from the CdTe band gap of 1.51 eV at room temperature. InSb is an obvious candidate to serve as a substrate for CdTe growth because the two materials are almost lattice-matched (Δa/a ≤ 0.05%), and they have similar thermal expansion coefficients. Early attempts to fabricate CdTe/InSb heterostructures using MBE were hindered by the growth of defective interfacial III–VI compounds, Reference Williams, Whitehouse, Cullis, Chew and Blackmore16 but our more recent study has shown that material of exceptional structural quality can be obtained once the growth conditions have been optimized. Reference Lu, DiNezza, Zhao, Liu, Zhang, Kovacs, Dunin-Borkowski and Smith17 Moreover, aberration-corrected HAADF and LABF STEM images reveal highly coherent, defect-free CdTe/InSb (001) interfaces. Examination of the interface region using the technique of geometric phase analysis reveals that the in-plane strain (i.e., within the (001) growth plane) is negligible, as would be expected for these two closely lattice-matched materials. Interestingly, however, the out-of-plane strain map showed a sharp tensile spike located right at the interface, which would normally be interpreted in terms of a rigid-body displacement. This finding seemingly contradicts with the absence of microscopy evidence for any interfacial defect.
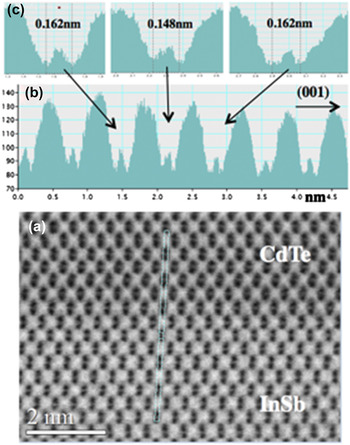
This intriguing result has provoked closer examination of the interface region, which must inevitably contain mixed II–V and/or III–V bonds due to the valence mismatch between the two materials. Figure 6 shows a representative LABF STEM image of the CdTe/InSb (001) interface taken at very high magnification. Measurement of the dumbbell intensities allows separate atomic columns to be identified on both sides of the interface. Measurement of dumbbell spacings across the interface reveals the subtle but highly reproducible result that there is a single pair of atomic columns with a contracted dumbbell separation of ∼0.15 nm, which is different from the ‘normal’ separation of 0.162 nm for the materials on either side. Since the CdTe growth had been initiated under Cd-rich conditions, this atomically thin layer has been tentatively identified as corresponding to some as-yet-unknown II–V compound. However, the close atomic numbers of the four elements Cd (Z = 48), In (Z = 49), Sb (Z = 51), and Te (Z = 52) make it too difficult in the presence of signal noise and some likely atomic mixing to reliably identify all atomic columns on the basis of image intensity alone in either HAADF or LABF images. Similarly, spectroscopic analysis using either electron-energy-loss spectroscopy or energy-dispersive x-ray spectroscopy is proving to be equally challenging because of overlap of spectral features, again arising from the very close Z of these constituents.
(a) LABF STEM image of CdTe/InSb (001) interface; (b) intensity line profile taken from (a); (c) enlargement showing contraction of dumbbell spacing at interfacial plane.

E. ZnTe/InP
The band gap of ZnTe at room temperature is 2.27 eV, corresponding to a peak emission wave length of 545 nm, which makes it an attractive material for many optoelectronic applications, including multijunction solar-cell devices. Thus, the epitaxial growth of ZnTe on low-cost III-V substrates has received considerable attention, as summarized for example in Ref. Reference Ouyang, Fan, Wang, Lu, Zhang, Liu, Furdyna and Smith18. Materials such as GaSb (lattice mismatch of ∼0.13%) and InAs (lattice mismatch of ∼0.74%) are obvious preferred choices for ZnTe growth given the small differences in lattice parameter values relative to ZnTe. However, it is both interesting and also important to understand how the lattice misfit is accommodated for other materials when there are larger differences in lattice parameters, and interfacial misfit dislocations are normally expected as a strain-relief mechanism. In the specific case of InP, the lattice mismatch with ZnTe is −3.85%, which would mean an average separation between dislocations of 10.8 nm at a fully relaxed ZnTe/InP interface.
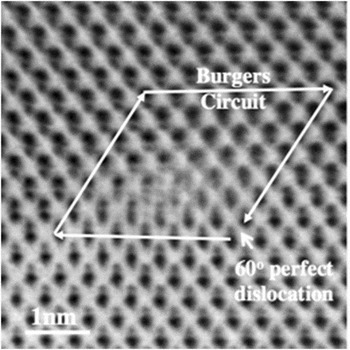
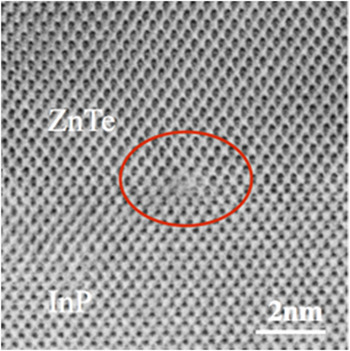
In a recent study of ZnTe epilayers grown on various Group III–V substrates, Reference Ouyang, Fan, Wang, Lu, Zhang, Liu, Furdyna and Smith18 we found that the most common interfacial defects were perfect Lomer edge dislocations with Burgers' vectors of (1/2)a 〈110〉 directed along the interfaces, and perfect 60° dislocations having Burgers' vectors of the same length but inclined at an angle at 45° to the interface. Figure 7 is an LABF STEM image showing an example of this latter type of defect at the ZnTe/InP (001) interface, together with the corresponding Burgers' circuit used to determine the nature of the defect. The various atomic columns in the region surrounding the defect can be readily identified on the basis of their relative intensities but the detailed atomic arrangements at the dislocation core seem ambiguous, which is attributed to possible disorder (or dissociation) along the beam direction. Figure 8 is an LABF STEM image showing a perfect Lomer edge dislocation located at the ZnTe/InP interface. The individual atomic columns are clearly well resolved except at the very core of the defect, which again makes it very difficult to pin down the precise atomic structure at the dislocation core.
LABF STEM image showing ZnTe/InP (001) interface with 60° perfect dislocation identified by Burgers' circuit.

LABF STEM image showing Lomer edge dislocation at ZnTe/InP (001) interface.

F. ZnTe/GaAs
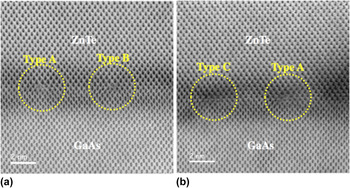
The ZnTe/GaAs (001) heterostructure has a lattice-spacing mismatch across the interface of ∼7.38%, which would correspond to an average defect separation along the interface of only 5.42 nm. High-resolution lattice-fringe imaging revealed that the large majority of the interfacial defects were perfect Lomer edge dislocations, as determined by Burgers' circuit analysis, which were spaced at roughly periodic intervals along the ZnTe/GaAs interface. Reference Lu, DiNezza, Zhao, Liu, Zhang, Kovacs, Dunin-Borkowski and Smith17 Two LABF STEM images of the ZnTe/GaAs interface region are shown in Fig. 9, with circles drawn around each Lomer dislocation. Careful inspection and interpretation of the image features for these and other similar edge dislocations reveal that there appears to be three principal structures (labeled here as A, B, and C), which have distinctly different image appearances. It is still not yet settled whether these differences are genuine or whether they are artifacts due to sample preparation or possibly even caused by electron-beam irradiation. Another possibility is that these defects could be (close to) intersecting other similar linear defects that are lying in the plane of the sample and aligned along the orthogonal direction.
Pair of LABF STEM images showing Lomer edge dislocations with three slightly different structures at ZnTe/GaAs (001) interface.

IV. CONCLUDING REMARKS
These initial studies of compound semiconductors with heterovalent interfaces using probe-corrected STEM have provided useful insights into the type of information that can be expected by applying this technique. However, further microscopy studies still seem to be needed to improve the accuracy with which the atomic locations are located. Moreover, concurrent spectroscopy studies, most likely at lower beam energy due to the likelihood of beam-induced sample damage, are needed to unambiguously identify atomic arrangements and chemical identities in the immediate vicinity of dislocation cores as well as to determine interfacial profiles.
Significant materials issues still remain to be resolved, such as controlled doping of the II–VI semiconductors and avoiding interdiffusion across II–VI/III–V interfaces, before these heterovalent combinations of materials can be adopted for different electronic and optoelectronic purposes. Feedback about specimen morphology should allow an improved understanding of the underlying physics of growth of these novel combinations of materials to be obtained, and also eventually enable optimization of the growth conditions.
ACKNOWLEDGMENTS
We thank Jacek Furdyna, Xinyu Liu, Ted Moustakas, Lin Zhou and Lu Ouyang whose collaboration and support made this research possible, and we gratefully acknowledge the use of facilities in the John M. Cowley Center for High Resolution Electron Microscopy at Arizona State University.