Implications
Lactoferrin (LTF) is a glycoprotein naturally present in milk with known favorable associations with the immune system. The quantification of this molecule directly in milk could be useful in the development of animal breeding programs to improve mastitis resistance of dairy cows and to improve the nutritional quality of bovine milk. To achieve these objectives an inexpensive, fast and robust method to quantify LTF directly from bovine milk is required. The results of this study show the potential of mid-infrared (MIR) spectrometry to predict LTF. MIR spectrometry is the method of choice worldwide to routinely predict milk components. Thus, the equation developed could potentially be exploited at low cost in the short term. Moreover, this study showed also that the use of predicted LTF and somatic cell score (SCS) slightly improved the possibility to detect the presence of clinical mastitis in dairy cows over and above using SCS alone.
Introduction
Lactoferrin (LTF) is an iron-binding glycoprotein naturally present in milk and secreted mainly by the mammary epithelial cells. Its concentration is higher during the later lactation stages (0.25 to 0.40 g/l) compared with early lactation stages (Hagiwara et al., Reference Hagiwara, Kawai, Anri and Nagahata2003; Baumrucker et al., Reference Baumrucker, Schanbacher, Shang and Green2005; Pugovel et al., Reference Pugovel, Baumrucker, Sauerwein, Rühl, Ontsouka, Hammon and Blum2005). LTF can also be released by polymorphonuclear neutrophils during inflammation (Kutila et al., Reference Kutila, Suojala, Lehtolainen, Saloniemi, Kaartinen, Tähti, Seppälä and Pyörälä2004).
LTF belongs to the transferrin gene family (Mead and Tweedie, Reference Mead and Tweedie1990; Ward et al., Reference Ward, Paz and Conneely2005) and has reverse iron-binding properties mainly explaining the different roles allotted to LTF in the regulation of the immune system (Mead and Tweedie, Reference Mead and Tweedie1990; Baker and Baker, Reference Baker and Baker2004). LTF seems to act as a general antibacterial and antifungal molecule (Baker, Reference Baker2005; Farnaud and Evans, Reference Farnaud and Evans2003), to be involved in host defence mechanisms (Baveye et al., Reference Baveye, Elass, Mazurier, Spik and Legrand1999; Baumrucker, Reference Baumrucker2000; Ward et al., Reference Ward, Paz and Conneely2005), and to modulate the inflammatory process (Farnaud and Evans, Reference Farnaud and Evans2003). Therefore, the content of LTF in bovine milk may have potential as an indicator of the presence of mastitis and could be used in an animal breeding program to augment the accuracy of selection for mastitis resistance in dairy cows. Indeed, high LTF concentration in milk (2.3 g/l of milk) compared with the expected normal level (0.1 to 0.4 g/l of milk) produced by a specific cow may indicate clinical or subclinical mastitis (Kutila et al., Reference Kutila, Suojala, Lehtolainen, Saloniemi, Kaartinen, Tähti, Seppälä and Pyörälä2004). Moreover, naturally increasing the content of LTF in milk through genetic selection could also have beneficial effects on human health (Tsuda et al., Reference Tsuda, Sekine, Ushida, Kuhara, Takasuka, Iigo, Seok Han and Moore2000).
For practical reasons (i.e. analysis time, skilled staff, analysis cost), the current methods used to quantify the LTF content in milk such as enzyme-linked immunosorbent assay (ELISA) or the immunodiffusion method are not feasible for a large number of samples as is necessary for accurate estimation of breeding values. Therefore, an alternative method that is rapid and low cost is required.
Recent research has shown the potential of mid-infrared (MIR) spectrometry to predict components in milk, for example, milk fat composition, in addition to the routine predictions of milk fat, protein, lactose and urea undertaken globally (Rutten et al., Reference Soyeurt, Dardenne, Lognay, Veselko, Mayeres and Gengler2006; Soyeurt et al. Reference Soyeurt, Dardenne, Lognay, Veselko, Mayeres and Gengler2006 and Reference Soyeurt, Dehareng, Gengler, McParland, Wall, Berry and Coffey2011). Similarly, MIR indicators of protein fractions such as casein and lactoglobulin (Barbano and Dellavalle, Reference Barbano and Dellavalle1987; Sorensen et al., Reference Sorensen, Lund and Juul2003) have been obtained. As it is possible to determine the total content of protein and some specific milk proteins, it could be possible to predict the LTF content of milk using MIR as LTF is a natural milk glycoprotein. This hypothesis was tested by Soyeurt et al. (Reference Soyeurt, Colinet, Arnould, Dardenne, Bertozzi, Renaville, Portetelle and Gengler2007) who suggested the possibility of quantification of an indicator of LTF in bovine milk using MIR spectrometry with a cross-validation coefficient of determination (R 2CV) of 0.75. However, the study of Soyeurt et al. (Reference Soyeurt, Colinet, Arnould, Dardenne, Bertozzi, Renaville, Portetelle and Gengler2007) had several limitations; only 69 samples collected in the Walloon region of Belgium were used to develop the equation through a partial least squares regression (PLS). Recent studies to predict other components in milk have shown a benefit in the accuracy of calibration equations with (1) more complex calibration procedures, (2) a larger number of samples from a wider range of production systems and (3) greater animal diversity (Dal Zotto et al., Reference Dal Zotto, De Marchi, Cecchinato, Penasa, Cdro, Carnier, Gallo and Bittante2008; Soyeurt et al., Reference Soyeurt, Dehareng, Gengler, McParland, Wall, Berry and Coffey2011).
The first aim of the current study was to develop a calibration equation to quantify the LTF content in milk using a large number of samples collected in Belgium, Ireland and Scotland from cows of different breeds and from different production systems. Pre-treatments applied to the spectral data were tested to improve the robustness of the MIR prediction of LTF content. The second aim was to quantify the usefulness of this LTF prediction to identify the presence of clinical mastitis.
Material and methods
Spectral and LTF data used in the calibration set
Milk samples (40 ml each in Ireland and Scotland and 2 × 60 ml each in Belgium (i.e. one for the MIR analysis and one for the LTF quantification)) were collected between April 2005 and April 2006 in Belgium, between April 2009 and August 2009 in Ireland and in August 2009 in Scotland. All samples were analyzed using MilkoScan FT6000 spectrometers (Foss, Hillerod, Denmark) that outputs one spectrum of 1060 data points in the IR range from 900/cm to 5000/cm for each milk sample analyzed. Belgian milk samples were analyzed by MIR in the milk laboratory ‘Comité du lait’ (Battice, Belgium) and the remaining samples were analyzed at Teagasc Moorepark (Fermoy, Co. Cork, Ireland).
Samples were preserved with bronopol and the LTF concentration in whole milk samples was measured at least in duplicate with a commercial ELISA kit (Bovine Lactoferrin ELISA Quantification Kit, Bethyl Laboratories Inc., Montgomery, TX, USA). The procedure was carried out according to the manufacturer's instructions. The samples were diluted 1 : 1000; 1 : 2000; 1 : 4000; 1 : 6000; 1 : 8000 or 1 : 10 000 in sample buffer. The LTF concentrations used for the calibration were the average of at least two measures taken on the same milk sample. Only samples with a coefficient of variation between two repeated measurements of LTF quantification of <5% were used to develop the calibration equation. For Irish and Scottish samples, ELISA analysis was undertaken by Enfer Laboratories (Naas Co. Kildare, Ireland). Belgian milk samples were analyzed by Gembloux Agro-Bio Tech – University of Liège (Gembloux, Belgium).
A principal component analysis was undertaken across all spectral data included in the calibration set and the standardized Mahalanobis distance was calculated. As described by Williams (Reference Williams2007), a spectral outlier is a spectrum which differs from the mean of the population by 3 or more standardized Mahalanobis distance. Using this threshold, 60 samples were deemed to be outliers and were discarded. Therefore, the final calibration dataset included 110 Walloon samples and 1658 Irish and 731 Scottish samples.
The Walloon samples (i.e. 110 records) were selected to maximize the spectral variability from the 1609 samples collected in a previous study (Soyeurt et al., Reference Soyeurt, Colinet, Arnould, Dardenne, Bertozzi, Renaville, Portetelle and Gengler2007) from six different breeds (dual-purpose Belgian Blue, Holstein–Friesian, Jersey, Montbeliarde, Normande, non-Holstein Meuse-Rhine-Yssel type Red and White) across seven herds. All of these samples were obtained during the routine milk recording managed by the Walloon Breeding Association (AWE, Ciney, Belgium) and frozen at −26°C. More details are given by Soyeurt et al. (Reference Soyeurt, Colinet, Arnould, Dardenne, Bertozzi, Renaville, Portetelle and Gengler2007).
Irish and Scottish samples were analyzed fresh one day after collection. The cows sampled in the Irish research herds were fed predominantly grazed grass and included animals of different breeds (Holstein–Friesian, Holstein, Friesian, Jersey, crossbred Jersey and Holstein–Friesian, Montbeliarde, Normande, Norwegian Red, crossbred Norwegian Red and Holstein Friesian; Prendiville et al., Reference Prendiville, Lewis, Pierce and Buckley2010) and different strains of Holstein–Friesian (Coleman et al., Reference Coleman, Pierce, Berry, Brennan and Horan2009). Cows from Scotland were from two genetically divergent lines (divergent for milk solids) and were fed two different diets (Coffey et al., Reference Coffey, Simm, Oldham, Hill and Brotherstone2004). Approximately half were fed a predominantly forage only diet and the other half a diet consisting of ∼60% silage and 40% concentrate.
Calibration models
A PLS approach was undertaken to relate the ELISA LTF values to the spectral data using WINISI III software (http://www.winisi.com/; Foss, Hillerod, Denmark). This regression technique requires cross-validation to prevent over-fitting to the data. Cross-validation obtains validation errors by partitioning the calibration set into several groups (50 groups were used in this study). The calibration is performed on the dataset with one group excluded and the equations developed are applied to the excluded group; this is iterated with a different group excluded at each iteration. The residuals from the prediction for each sample were combined into a standard error of cross-validation (Sinnaeve et al., Reference Sinnaeve, Dardenne, Agneessens and Biston1994). In order to assess the efficiency of the calibration equation, different statistical parameters were estimated: mean LTF ELISA content, standard deviation of ELISA LTF content (s.d.), standard error of calibration (s.e.c.), calibration coefficient of determination (R 2C), standard error of cross-validation (SECV) and cross-validation coefficient of determination (R 2CV). The ratio of SECV to s.d. (ratio of s.e. prediction to s.d.; RPD) was also calculated (William and Norris, Reference William and Norris2001) in order to estimate the efficiency of calibration.
An equation developed for one spectrometer could provide results slightly biased on another instrument. To improve the accuracy of the MIR prediction across instruments, a ‘repeatability file’ was generated by recording the MIR spectrum of several milk samples provided by five different MilkoScan FT6000 spectrometers (Foss) and used in the calibration process based on a methodology proposed by Westerhaus (Reference Westerhaus1990). More details about the repeatability file were provided by Soyeurt et al. (Reference Soyeurt, Dehareng, Gengler, McParland, Wall, Berry and Coffey2011).
Generating the derivative of the spectral data permits a ‘sharpening’ of the absorption bands. First and second derivatives were obtained using the following formula:
 $$d{{x}_k}\,{\rm{ = }}\,{{x}_{k\,{\rm{ - }}\,\frac{{g\,{\rm{ - }}\,{\rm{1}}}}{{\rm{2}}}}}\,{\rm{ - }}\,{{x}_{k\,{\rm{ + }}\,\frac{{g\,{\rm{ - }}\,{\rm{1}}}}{{\rm{2}}}}}$$
where dxk is the value of the derivative for the spectral data point k; x is the absorbance; g is an odd integer strictly positive entitled ‘gap’ (i.e. five consecutive spectral data points in this study; Hruschka, Reference Hruschka1987). The second derivative used the absorbance obtained for the first derivative instead of the absorbance of spectra. Six different statistical approaches were evaluated to develop the prediction equations:
method 1: PLS and no pre-treatment on the spectral data;
method 2: PLS + the use of a repeatability file;
method 3: PLS + the use of a first derivative pre-treatment on the spectral data;
method 4: PLS + the use of a first derivative pre-treatment + repeatability file;
method 5: PLS + the use of a second derivative pre-treatment;
method 6: PLS + the use of a second derivative pre-treatment + repeatability file.
A T-outlier test was used to remove potential outliers from the reference ELISA data (Winisi software, Foss, Hillerod, Denmark). The critical T-outlier value was set to 2.5 (i.e. recommended default value). If the difference between the predicted and reference LTF values was >2.5 times the SEC, the sample was considered to be an outlier and deleted. This methodology was iterated twice.
External validation
An external validation was conducted using 274 samples collected from 14 Walloon herds in June and July 2009, and again during January and May 2011. Samples were collected from different breeds: dual-purpose Belgian Blue, Holstein–Friesian, Montbeliarde and non-Holstein Meuse-Rhine-Yssel type Red and White. The developed equations were applied to this dataset and the validation coefficient of determination was calculated (R 2v).
Prediction of clinical mastitis
To assess the usefulness of the LTF MIR prediction to detect mastitis, the LTF calibration equation was applied to the recorded spectral data from cows with associated mastitis information.
Calibration set
Mastitis records were collected from 18 farms located in the Walloon region of Belgium between January 2007 and the beginning of August 2011 (two farms from 2007, two farms from 2008, two farms from 2009, five farms from 2010 and seven farms from 2011). A total of 1750 mastitis events were recorded from 864 dairy cows. The average incidence of mastitis for these herds was 30.17% with an s.d. of 15.30%. The minimum mastitis incidence was 9.09% and the maximum was 78.38%. These farms were involved in the Walloon milk recording program; therefore, the composition of milk from all cows in lactation in the herds were analyzed every 4 to 6 weeks using a Foss MilkoScan FT6000 (Foss). Spectral data and somatic cell count (SCC) were recorded. LTF content was estimated by applying the LTF MIR equation developed in this study on the recorded spectra. The somatic cell score (SCS) was obtained by the following formula: SCS = (log 2(SCC/100 000)) + 3. SCS was calculated because its distribution is more normal compared with the distribution of SCC data. The mastitis events were merged with the MIR records based on the date of the mastitis event ±7 days. Only Holstein cows were considered in this study. Finally, 275 mastitis events had an associated SCS and MIR spectral records. Therefore, the final dataset contained 13 507 MIR records with 275 mastitis events from 1564 Holstein cows.
Logistic regression (PROC LOGISTIC in SAS; SAS Institute, 1999) was used to develop an equation to detect the presence of mastitis (1 = mastitis; 0 = no mastitis). Independent variables included in the model were SCS, predicted MIR LTF and their interaction. To avoid bias from correlated records among cows, the generalized estimating equations (PROC GENMOD in SAS; SAS Institute, 1999) were tested but the results were similar and sometimes worse that those observed for PROC LOGISTIC. This could be explained by the large number of cows used in this study. Therefore, only the PROC LOGISTIC results will be presented in this study.
There were a small number of mastitis cases relative to non-mastitis samples; thus, a second, more ‘balanced’ dataset was created: only test-day MIR records from all cows within ±60 days of the 275 mastitis cases were kept. This dataset contained 677 records.
Logistic regression models were built from this dataset. Comparisons were made based on different statistical parameters such as the deviance and Pearson's Goodness-of-Fit, the percent of concordant, discordant and tied samples, and the receiver operator curve (ROC) area. The significance of the different effects included in the model was assessed using the Wald test.
Internal validation
The internal validation of the equations (i.e. nearly all samples used for the validation were used for the calibration) was based on the P of the Hosmer and Lemeshow Goodness-of-Fit test executed by using PROC LOGISTIC in SAS with the LACKFIT option (SAS Institute, 1999). On the other hand, the coefficients of the logistic equation developed previously were applied to the entire available Walloon dataset (i.e. 13 507 MIR records related to 275 mastitis events) in order to predict the logit value, which is an estimation of the P of the presence of mastitis. The thresholds used were the following:
Predicted logit value = 0, then predicted mastitis event was coded as 0.
Predicted logit value >0, then predicted mastitis event was coded as 1.
Predicted logit value <0, then predicted mastitis event was coded as 0.
Then, the specificity (i.e. the ability of the model to predict the absence of mastitis) and the sensitivity (i.e. the ability of the model to predict the presence of mastitis) were calculated by the following formulas:
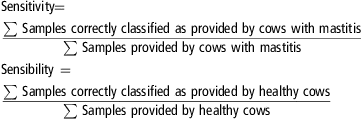 $$\displaylines{
{\rm{Sensitivity}}\,{\rm{ - }} & \frac{{\sum \,{\rm{Samples}}\,{\rm{correctly}}\,{\rm{classified}}\,{\rm{as}}\,{\rm{provided}}\,{\rm{by}}\,{\rm{cows}}\,{\rm{with}}\,{\rm{mastitis}}}}{{\sum \,{\rm{Samples}}\,{\rm{provided}}\,{\rm{by}}\,{\rm{cows}}\,{\rm{with}}\,{\rm{mastitis}}}} \cr
{\rm{Sensibility}}\, = & \frac{{\sum \,{\rm{Samples}}\,{\rm{correctly}}\,{\rm{classified}}\,{\rm{as}}\,{\rm{provided}}\,{\rm{by}}\,{\rm{healthy}}\,{\rm{cows}}}}{{\sum \,{\rm{Samples}}\,{\rm{provided}}\,{\rm{by}}\,{\rm{healthy}}\,{\rm{cows}}}} \cr}$$
External validation
A total of 5886 milk samples from 800 Holstein cows were collected in the research farm of the University of Wisconsin – Madison. All samples were analyzed by MIR spectrometry by the milk lab ‘AgSource Cooperative Service’ (Menomonie, WI, USA) using a MilkoScan FT6000 (Foss) between January 2009 and February 2011. The spectral data and SCC were recorded. SCS was calculated by using the formula shown previously. LTF content was estimated using the developed MIR calibration equation. Moreover, 540 mastitis events were recorded between January 2009 and December 2010. The mastitis incidence was 25.39% for 2009 and 32.32% for 2010. By using the same approach of data edits used in the Walloon dataset (i.e. date of mastitis event ±7 days), only 93 events had an associated MIR spectral record. The same methodology as the one explained for the internal validation using all Walloon dataset was used in order to calculate the P for the presence of mastitis in the external validation dataset and therefore, to evaluate the specificity and the sensitivity of the model.
Results and discussion
LTF calibration equations
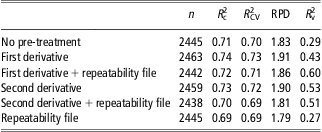
The calibration dataset used contained 2499 samples and had a mean and s.d. for the LTF content of 163.29 ± 103.40 mg/l of milk. The robustness of the six approaches to derive the equations is shown in Table 1. Because of the use of the T-outlier test, the number of samples actually used to develop the different equations differed. However, the maximum number of samples discarded by this test was 61 (i.e. 2499−2438 = 61), which represents <2.50% of the total amount of samples. Across the six different statistical approaches evaluated, the R 2CV ranged from 0.69 to 0.73. Clearly, the equation combining a first derivative pre-treatment and the use of the repeatability file gave the most accurate results (i.e. high R 2CV (0.72) and RPD (1.86); highest R 2v (0.60)). The SECV was 50.55 mg/l of milk. Soyeurt et al. (Reference Soyeurt, Dehareng, Gengler, McParland, Wall, Berry and Coffey2011) also concluded that the use of the first-derivative and the repeatability files resulted in the most accurate prediction of milk fatty acids.
Statistical parameters for the six methods used to develop the lactoferrin equation
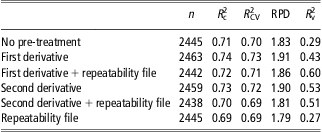
R 2c = calibration coefficient of determination; R 2cv = cross-validation coefficient of determination; RPD = ratio of s.d. of the reference enzyme-linked immunosorbent assay values to the standard error of cross-validation; R 2v = validation coefficient of determination estimated from 274 Walloon samples.
The increase in R 2CV and RPD in the method including both the first derivative and the repeatability file compared with the method including only a first derivative can be explained by the difference in the number of samples originating from Ireland and Scotland and those originating from Belgium. On one hand, the validation dataset contained only Walloon milk samples. In contrast, the calibration dataset contained a very low number of Walloon samples relative to Scottish and Irish samples. Therefore, because of the large number of Walloon samples in the repeatability file, the use of this file during the calibration process allowed us to better consider the spectral variability present in the Walloon region of Belgium (more details on the repeatability file in Soyeurt et al., Reference Soyeurt, Dehareng, Gengler, McParland, Wall, Berry and Coffey2011). In other words, the spectral variability of Walloon samples was not just based on 110 samples included in the calibration set but also from samples included in the repeatability file. In conclusion, the equation, which used the repeatability file, was more adapted for Walloon data as depicted by the validation results.
RPD for the prediction equation including both the first derivative and repeatability file was close to 2. If the RPD ratio is larger than 2, the calibration equation is considered good and can be used for practical purposes (Sinnaeve et al., Reference Sinnaeve, Dardenne, Agneessens and Biston1994).
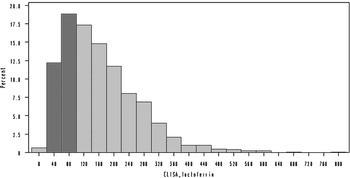
Without using any pre-treatment, the R 2CV was equal to 0.70 (Table 1). Soyeurt et al. (Reference Soyeurt, Colinet, Arnould, Dardenne, Bertozzi, Renaville, Portetelle and Gengler2007) observed a R 2CV of LTF of 0.75 using 69 milk samples. The slight difference compared with the present study can be explained by the difference in the number of samples included in the calibration set (2499 v. 69 samples) and the average content of LTF and the s.d. (163.29 ± 103.40 v. 253.72 ± 206.37 mg/l of milk). This variability of LTF can be explained by the introduction of samples originating from different countries. This means that the current calibration set has a larger proportion of samples with a low content of LTF, which have a different spectral pattern (Figure 1). Soyeurt et al. (Reference Soyeurt, Dardenne, Lognay, Veselko, Mayeres and Gengler2006) and Rutten et al. (Reference Rutten, Bovenhuis, Hettinga, Van Vanlenberg and Van Arendonck2009) showed both that R 2c and R 2CV are influenced by the content of the studied traits in milk. Therefore, the larger amount of milk samples with low LTF content in this study could negatively influence the obtained R2CV. However, the SECV obtained in this study was lower than the SECV reported by Soyeurt et al. (Reference Soyeurt, Colinet, Arnould, Dardenne, Bertozzi, Renaville, Portetelle and Gengler2007; 50.55 v. 103.93 mg/l of milk), suggesting a better accuracy of the LTF MIR prediction in this study.
Distribution of lactoferrin enzyme-linked immunosorbent assay (ELISA) values (mg/l of milk).

Even if the R 2CV and R 2v values were different (Table 1), SECV and standard error of prediction (SEP) obtained from the method including both first-derivative and repeatability files were relatively similar (50.55 and 58.98 mg/l of milk), suggesting the development of a robust equation. In the same way, SEC and SECV were also similar. SEC was 49.90 mg/l of milk showing also the robustness of the developed equation.
The calibration dataset contained samples from three different countries. Irish and Scottish samples were analyzed by the same spectrometer located at Teagasc Moorepark (Fermoy, Co. Cork, Ireland) and the same laboratory for LTF. Belgian samples were analyzed by the milk lab ‘Comité du Lait’ for MIR spectrometry and by Gembloux Agro-Bio Tech for the ELISA analysis. This potential source of variation for the spectral and reference ELISA data generates an interest to combine all of the available samples into one calibration dataset for testing. When the calibration dataset contained only the Walloon samples (i.e. 110 samples), the R 2CV was 0.62 with a SECV of 52.34 mg/l of milk. In the same way with the Irish and Scottish samples (i.e. 2389 samples; these samples were combined because they came from the same spectrometer and analyzed by ELISA in the same lab), the equation showed a R 2CV of 0.70 with SECV of 50.93 mg/l of milk. For these equations when the first derivative was analyzed and the repeatability file included, the R 2CV was lower and the SECV was greater. Therefore, the inclusion of samples coming from different country/region in one calibration dataset as undertaken in this study improved the robustness of the developed LTF calibration equation. This conclusion was substantiated by the results from the external validation. Indeed, when the Walloon validation samples were predicted using the equation developed from only Walloon samples (i.e 110 samples), the R 2v was 0.40 with a SEP of 77.26 mg/l of milk. When the LTF prediction of these same validation samples was computed using the equation including Irish and Scottish samples, the R 2v was 0.57 with a SEP of 59.15 mg/l of milk. The R 2v obtained from the equation combining all available samples with a repeatability of ELISA values ⩽5% was 0.60 (Table 1). Therefore, considering all data in the same calibration set improved the robustness of the LTF calibration equation.
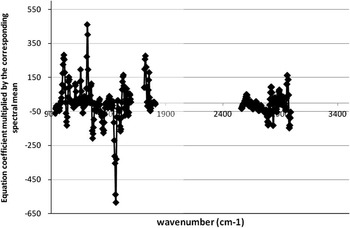
Figure 2 shows the coefficients of the LTF equation including the repeatability file and the first derivative pre-treatment. In order to compare the coefficients between them, each coefficient was multiplied by the mean value of the corresponding spectral data. This permits accounting for the differences in the absorption of IR rays between spectral data. The three MIR regions considered were relevant. The region surrounding 1200/cm was associated with LTF and this region is known to be related to C–O bonds (Sivakesava and Irudayaraj, Reference Sivakesava and Irudayaraj2002). The region located around 1300/cm and related to COOH was also useful in the prediction of LTF. A large negative peak was observed around 1450/cm and another interesting region was located between 1700/cm and 1800/cm. Sivakesava and Irudayaraj (Reference Sivakesava and Irudayaraj2002) mentioned that the region located between 1700 and 1500/cm is related to protein bands. The range 1450 to 1200 is assumed to denote carboxylic groups of protein. Finally, the MIR data between 2500/cm and 2800/cm were also associated with LTF and this region is known to be related to lipids because it is the region for the ester linkage and C–H stretch group (Sivakesava and Irudayaraj, Reference Sivakesava and Irudayaraj2002).
Coefficients of the lactoferrin mid-infrared equation multiplied by the mean of the corresponding spectral data.

Mastitis indicator
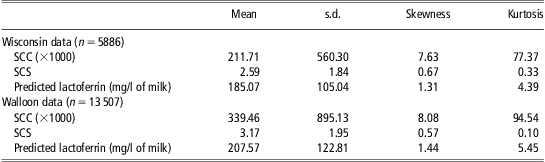
Descriptive statistics for the Walloon and Wisconsin data used to study the relationship between mastitis and predicted LTF are described in Table 2. On the basis of the skewness and kurtosis values, SCS as well as the predicted LTF approached a normal distribution. The correlation between these traits was 0.54 from the Wisconsin (i.e. 5886 MIR samples) and Walloon (i.e. 13 507 MIR records) data. As SCS is influenced by the presence of mastitis (Emanuelson et al., Reference Emanuelson, Danell and Philipsson1988; Harmon, Reference Harmon1994; Pösö and Mäntysaari, Reference Pösö and Mäntysaari1996; Hagiwara et al., Reference Hagiwara, Kawai, Anri and Nagahata2003), we can hypothesize that predicted LTF may also be related to the presence of mastitis. The relationship between clinical or subclinical mastitis and the milk LTF content was mentioned previously by Gaunt et al. (Reference Gaunt, Raffio, Kingsbury, Damon, Johnson and Mitchell1980), Hagiwara et al. (Reference Hagiwara, Kawai, Anri and Nagahata2003) and Kutila et al. (Reference Kutila, Suojala, Lehtolainen, Saloniemi, Kaartinen, Tähti, Seppälä and Pyörälä2004).
Descriptive statistics of the dataset used to develop and validate the logistic regressions
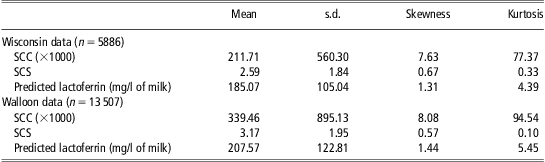
SCC = somatic cell count; SCS = somatic cell score.
The logistic regression including only MIR predicted LTF did not reveal the presence of mastitis (the P-value of the Wald test was of 0.17).
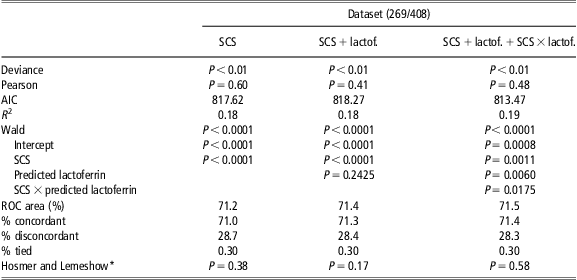
Table 3 presents the statistical parameters of the logistic regression models including either SCS alone; both SCS and MIR predicted LTF; or SCS, LTF and their interaction (SCS × LTF). The P-values for the deviance Goodness-of-Fit test were similar between the three studied regressions. However, the P-value for the Pearson Goodness-of-Fit was lower for the logistic regression including both SCS and LTF. Akaike's information criterion was also lower for the regression including SCS, LTF and their interaction. The inclusion of LTF with the interaction SCS × LTF in combination with SCS seemed to improve slightly the explanation of the observed variability for the mastitis information because the R 2 was higher for this regression (0.19). The inclusion of LTF and the interaction SCS × LTF in the model seems to be relevant because all of these fixed effects were significant based on the Wald test. The ability of the model to predict the presence of mastitis was better for the model including SCS, LTF and the interaction SCS × LTF. The ROC area and the percent of concordant samples were slightly higher for this third regression. In the same way, the percent of disconcordant samples was slightly lower.
Statistical parameters of the developed logistic regressions including SCS or SCS and lactoferrin
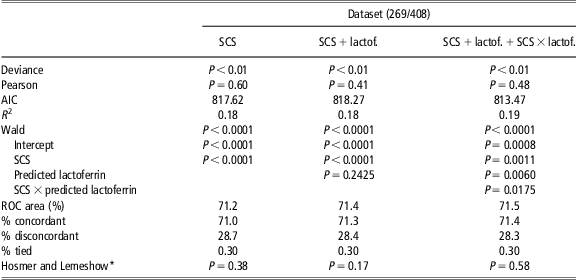
SCS = somatic cells score; lactof. = prediction lactoferrin content using the developed MIR equation; SCS × lactof. = interaction between SCS and lactof.; AIC = Akaike's information criterion; R 2 = coefficient of determination; ROC = receiver operator curve.
*P-value close to 1 is expected.
The P-value for the Hosmer and Lemeshow Goodness-of-Fit were higher for the model including SCS, LTF and their interaction, suggesting a better ability of this model to predict the presence of mastitis. This observation can be explained partly by a relationship between the LTF content and SCC and their different reactions to the pathogens affecting the udder. Lindmark-Mansson et al. (Reference Lindmark-Mansson, Bränning, Aldén and Paulsson2006) showed the link existing between LTF and SCC but also mentioned that the LTF content in milk begins to increase when the SCC is >5000 cells/ml. Hagiwara et al. (Reference Hagiwara, Kawai, Anri and Nagahata2003) demonstrated that the changes in the LTF content in milk are different following the pathogens involving the mastitis in the udder.
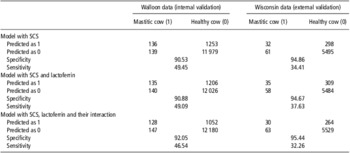
Table 4 shows the percentage of samples correctly and incorrectly classified as well as the specificity and the sensitivity of the developed logistic regressions based on the entire Walloon dataset (i.e. 13 507 records – internal validation because some samples were used to create the regressions) and the Wisconsin dataset (i.e. 13 507 records – external validation because samples were not used to build the logistic regressions). The validation results gave different conclusions compared with the results obtained from the calibration process (Table 3). No large differences appeared between regressions. However, a slightly better sensitivity was obtained for the equation including only SCS from the Walloon data, and the one including SCS and LTF from the Wisconsin data. However, from the Walloon dataset, the difference of the sensitivity value between the equation including only SCS and the one containing SCS and LTF was slight (49.45 v. 49.09). A better specificity was observed for the model including LTF, SCS and the interaction SCS × LTF. The difference between the calibration and the validation processes can be explained mainly by: (1) the difference in the proportion of mastitis and no-mastitis events in the calibration and validation datasets and (2) the higher uncertainty for the 0 score (i.e. no-mastitis event) because maybe the model was predicting subclinical mastitis. Therefore, on the basis of the Hosmer and Lemeshow test, the existing interaction between LTF and SCC mentioned in the literature, and the specificity results, the best models in this study should be the one including SCS, LTF and their interaction.
Internal and external validation of the developed logistic regressions

SCS = somatic cells score; Mastitis 1 = cow having observed mastitis; Mastitis 0 = healthy cow; Prediction = 1 means mastitis and 0 means healthy cow.
Even though a positive correlation was observed between SCS and LTF, predicted LTF alone was not associated with the presence of mastitis. However, the knowledge of both SCS and LTF seems to slightly improve the mastitis prediction. Moreover, the knowledge of LTF content in milk is also important to characterize the nutritional quality of milk (Tsuda et al., Reference Tsuda, Sekine, Ushida, Kuhara, Takasuka, Iigo, Seok Han and Moore2000). As many milk recording organizations begin to think about the possibility of retaining the spectral information, the prediction of LTF will be as easily available as the SCS data and could improve the detection of mastitis or the efficacy of breeding programs that aim to improve the mastitis resistance of dairy cows. On the basis of Hagiwara et al. (Reference Hagiwara, Kawai, Anri and Nagahata2003), a cow producing milk with <200 mg/l of LTF in milk could not inhibit the growth of Escherichia coli. A total of 52% of the cows studied by these authors produced milk with LTF content <200 mg/l. Therefore, the aim of a potential breeding program to improve mastitis resistance could ensure this limit of 200 μg of LTF/ml of milk. This would also be beneficial for human health and is possible because MIR LTF trait is heritable (Soyeurt et al., Reference Soyeurt, Colinet, Arnould, Dardenne, Bertozzi, Renaville, Portetelle and Gengler2007). However, before discussing the breeding objective, a lot of work is needed notably to study the relationship between MIR LTF and other common milk production traits (i.e. milk yield, fat, protein, etc.) and economic traits (i.e. fertility, longevity, etc.).
Conclusions
This study confirms the possible computation of an indicator of LTF content in milk by MIR spectrometry. On the basis of R 2CV, RPD and R 2v, the calibration equation combining a first derivative pre-treatment as well as the use of a repeatability file is the best option to measure the LTF content in bovine milk. The slight difference between SECV and SEP suggests that the developed LTF equation is robust. Even if this prediction used alone does not improve the detection of mastitis, its combination with SCS is promising. A larger external validation exercise based on a dataset containing new mastitis information is required to confirm the specificity and sensitivity of the developed model. In conclusion, based on the validation results, if a large additional cost for the measurement of LTF by MIR is imposed on the customers, the improvement of mastitis detection by adding LTF information may not be justified. However, as many milk recording organizations begin to retain the spectral information, the LTF prediction will be easily obtained at low cost, and therefore the combination of SCS and LTF to improve the detection of mastitis or the mastitis resistance by specific breeding programs will be interesting. The introduction of LTF in a breeding program could also facilitate the improvement in the nutritional quality of milk.
Acknowledgments
This research received a financial support from the European Commission, Directorate-General for Agriculture and Rural Development, under Grant Agreement 211708 and from the Commission of the European Communities, FP7, KBBE-2007-1. This paper does not necessarily reflect the view of these institutions and in no way anticipates the Commission's future policy in this area. Hélène Soyeurt, a Post-doctoral Researcher, Jérémie Vandenplas, a Research Fellow and Nicolas Gengler, a Senior Research Associate until December 31, 2011, acknowledge also the support of the National Fund for Scientific Research (Brussels, Belgium). The authors also acknowledge the support of the National Fund for Scientific Research for its grant FRFC 2.4604.11. The Ministry of Agriculture of the Walloon Region of Belgium [Service public de Wallonie, Direction générale de l'Agriculture, des Ressources naturelles et de l'Environnement, Direction de la Recherche] is acknowledged for their financial support through the project NovaUdderHealth (D31-1207). The authors acknowledge the technical support provided by the Walloon Breeding Association (Ciney, Belgium), the milk laboratory (Comité du Lait, Battice, Belgium) and Sylvie Herbage who realizes the LTF quantification of the Walloon samples used for the validation. Scottish Agricultural College receives funding from the Scottish Government and they are acknowledged for funding the long-term selection experiment producing milk samples used in this analysis. Joel Amdall at the AgSource Laboratory (Menomonie, WI, USA) is also acknowledged for providing MIR spectral data for cows in the UW–Madison herd. OSAM platform and LAECEA project (2972, Direction générale opérationnelle Agriculture – Resources naturelles environnement, Direction du developpement et de la vulgarization, Namur, Belgium) are also acknowledged for providing the Walloon mastitis data.