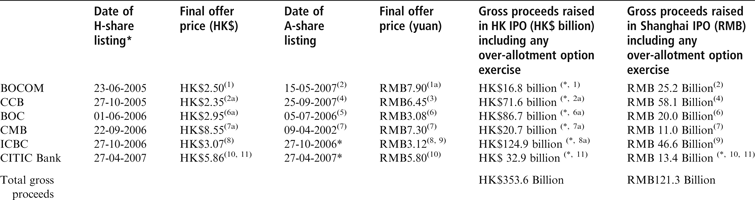
One of the most significant developments in the recent restructuring of China's economy has been the partial privatization and listing of its largest state-owned banks in both Hong Kong and Shanghai. To date, six of the country's top seven banks have attained listed status in the two venues. The size of such issues has been daunting. In particular, the Bank of China's June 2006 initial public offering (IPO) was larger than any IPO configured in London, New York or Tokyo during the six-year period prior to its listing.Footnote 1 The Industrial and Commercial Bank of China's IPO was even more spectacular, constituting the largest ever globally in terms of capital proceeds raised, generating gross funds of almost US$22 billion.Footnote 2 Most impressive of all, the total amount of gross proceeds amassed from the Hong Kong and Shanghai offerings for the six banks sums to approximately US$60 billion (see Table 1).
The Scale and Timing of the H-(Hong Kong) and A-(Shanghai) Share IPOs

Sources:
* BOCOM Prospectus (cover, p. i); CCB Prospectus (cover, p. i); BOC Prospectus (cover, pp.i, 329); CMB Prospectus (cover, pp. i, 107); ICBC Prospectus (cover, pp. i, 318); and CITIC Bank Prospectus (cover, pp. i, 266, 267).
(1) http://www.hkexnews.hk/listedco/listconews/sehk/20050704/LTN20050704133.pdf (announcement dated 5 July 2005, posted on HKEx's website for BOCOM).
(1a) http://www.hkexnews.hk/listedco/listconews/sehk/20070427/LTN20070427071.pdf (announcement dated 26 April 2007, posted on HKEx's website for BOCOM).
(2) http://www.hkexnews.hk/listedco/listconews/sehk/20070514/LTN20070514068.pdf (announcement dated 14 May 2007, posted on HKEx's website for BOCOM).
(2a) http://www.hkexnews.hk/listedco/listconews/sehk/20051110/LTN20051110023.pdf (announcement dated 10 November 2006, posted on HKEx's website for CCB).
(3) http://www.hkexnews.hk/listedco/listconews/sehk/20070918/LTN20070918317.pdf (announcement dated 18 September 2007, posted on HKEx's website for CCB).
(4) http://www.hkexnews.hk/listedco/listconews/sehk/20070921/LTN20070921424.pdf (announcement dated 21 September 2007, posted on HKEx's website for CCB).
(5) http://www.hkexnews.hk/listedco/listconews/sehk/20060704/LTN20060704058.pdf (announcement dated 3 July 2006, posted on HKEx's website for BOC).
(6) http://www.hkexnews.hk/listedco/listconews/sehk/20060622/LTN20060622070.pdf (announcement dated 21 June 2006, posted on HKEx's website for BOC).
(6a) http://www.hkexnews.hk/listedco/listconews/sehk/20060627/LTN20060627055.pdf (announcement dated 27 June 2006, posted on HKEx's website for BOC).
(7) IPO Reporter (April 2002), C. M. O'Connor, ‘Bank of China IPO on Again, off Again’, 22 April 2002.
(7a) http://www.hkexnews.hk/listedco/listconews/sehk/20060927/LTN20060927213.pdf (announcement dated 27 September 2006, posted on HKEx's website for CMB).
(8) http://www.hkexnews.hk/listedco/listconews/sehk/20061023/LTN20061023020.pdf (announcement dated 23 October 2006, posted on HKEx's website for ICBC).
(8a) http://www.hkexnews.hk/listedco/listconews/sehk/20061106/LTN20061106174.pdf (announcement dated 6 November 2006, posted on HKEx's website for ICBC).
(9) http://www.hkexnews.hk/listedco/listconews/sehk/20061116/LTN20061116162.pdf (announcement dated 17 November 2006, posted on HKEx's website for ICBC).
(10) http://www.hkexnews.hk/listedco/listconews/sehk/20070423/LTN20070423099.pdf (announcement dated 23 April 2007, posted on HKEx's website for CITIC Bank)
(11) http://www.hkexnews.hk/listedco/listconews/sehk/20070502/LTN20070502035.pdf (announcement dated 2 May 2007, posted on HKEx's website for CITIC Bank).
The six banks also represent unique issuers. Not only were they plagued with non-performing loan (NPL) problems in the years ahead of IPO, but the markets in which they operated were just on the cusp of opening up to foreign competition as a result of China's accession to the World Trade Organization (WTO) in December 2001. Specifically, the Chinese authorities had made assurances that by the fifth anniversary of accession to the WTO its domestic banking market would become a contestable one accommodating foreign bank competition. This has happened to a large degree with a number of overseas banks now running Chinese-incorporated arms which ostensibly compete for RMB deposit business in major mainland cities.
We first assess the various ways in which the banks were re-organized. First, attention is directed to the pre-IPO or preparatory stage for listing. This involved the construction of a listing vehicle in which two strategic ploys appeared central: the aggressive sale of NPL assets to China's appointed asset-management companies; and the re-capitalization of the underlying bank entities' balance sheets by releasing new shares to both regulatory-based and private players in the period preceding IPO. In a second stage of analysis, we assess the structure and form of the IPO mechanisms employed. In a third stage, we explore the benefits of listing and assess how the partial privatization initiative and associated reforms may have helped in shaping managerial and business change in China's leading state-owned banks. This leads us to grapple with the central question in our analysis: have the state-owned banks been able to enhance their financial position post-listing? This is a timely question, since sufficient data are now available to address this issue. We highlight significant improvements in banks' profitability, loan book quality (and size), risk management and capital adequacy, up to the 2009 half-year end. While the unfurling global credit crunch could arrest further progress in these areas, we note that the once large return-on-assets gap between Hong Kong and Chinese banks has shrunk markedly.
In pursuing the objectives of this study, the next section sets out details of the banks' pre-IPO reorganizations. Detailed consideration is then given to the structure and pricing of the respective Hong Kong and Shanghai-based IPOs, followed by analysis of the six entities' post-listing performance.
Preparation for Listing: The Banks' Re-Capitalization and Sale of Non-Performing Loans
The first state-owned bank to list in Hong Kong was the Bank of Communications in June 2005. This presaged Hong Kong listings by the China Construction Bank (October 2005), the Bank of China (June 2006), the China Merchants Bank (September 2006), the Industrial and Commercial Bank of China (October 2006) and, most recently, the China CITIC Bank Corporation (April 2007). In the last two cases IPOs were organized simultaneously in Hong Kong and Shanghai, whereby separate blocks of stock (A-stock in Shanghai and H-stock in Hong Kong) were listed on the same day at the same exchange-adjusted offering price. For the other four, H-listing in Hong Kong occurred at a different time from the entities' corresponding Shanghai A-listing. For the Bank of Communications, the Bank of China and the China Construction Bank, H-share listing preceded the corresponding Shanghai A-share IPO. Only China Merchants Bank had an A-share listing in place ahead of its H-share IPO in Hong Kong. Listing dates and gross funds raised are reported in Table 1.
China Merchants Bank (CMB) was not the first state-owned bank to obtain an A-listing. As reported by Jia,Footnote 3 it was preceded by Shanghai listings of the Pudong Development Bank, China Minsheng Bank and Huaxia Bank, as well as the Shenzhen Development Bank on the Shenzhen Stock Exchange. All four rank behind CMB in asset size. Interestingly, China Minsheng Bank became the seventh PRC bank to establish concurrent A- and H-listings in late 2009. As of early 2005, the Industrial and Commercial Bank of China, Bank of China and China Construction Bank were ranked as first, second and third largest, with the Bank of Communications, CMB and China CITIC Bank occupying slots five to seven, respectively. The missing bank – which has still not listed in either Hong Kong or Shanghai – is the Agricultural Bank of China, which ranks as China's fourth largest state-owned bank.
We start by examining the first two H-share issues: the Bank of Communications (BOCOM) and the China Construction Bank (CCB) in 2005. Both, in some respects, served as “guinea pigs” in the state-owned bank partial privatization story. While some discussion of the two listings has featured in the academic literature, there has been scant coverage of the banks' pre-IPO reorganization.Footnote 4 This exercise entailed a major re-capitalization of the banks' balance sheets in tandem with an aggressive sale of NPLs to China's designated asset-management companies.
The determination of an NPL reflects principles established by China's central bank, the People's Bank of China (PBOC). As set out in BOCOM's IPO prospectusFootnote 5:
In December 2001, the PBOC promulgated the Loan Classification Principles. … all commercial banks in the PRC are required to classify their loans under a five-category system. … Under the Loan Classification Notice, all commercial banks in the PRC are required to report to the PBOC, within 20 working days after the end of each calendar quarter or 45 days after the end of each calendar year, the quality of their loans under the five category system (p. 61).
The five categories of loan quality, in descending order of quality, are “pass,” “special mention,” “substandard,” “doubtful” and “loss.” Loans classified in the final three tiers constitute what the PBOC, and these days the China Banking Regulatory Commission, know to be NPLs.
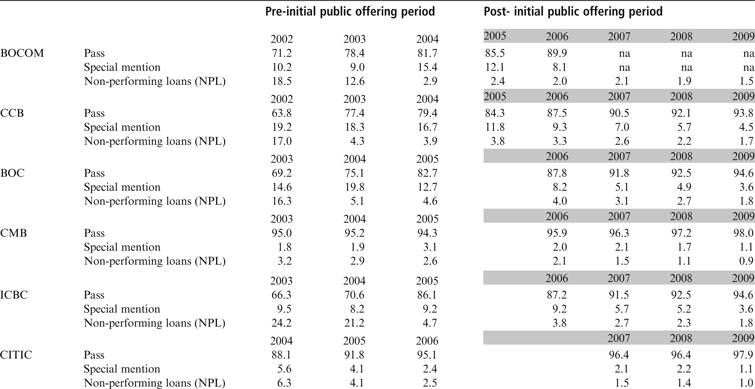
The BOCOM and CCB prospectus documents reveal that NPL rates were, only three years prior to IPO, 18.5 and 17.0 per cent of the aggregate value of loan book positions. These rates were pared back to 2.9 and 3.9 per cent just ahead of IPO (see Table 2). Much of the improvement in the NPL rate of BOCOM came about between June and August 2004 when the company excised loans with principal value exceeding 53 billion yuan by selling them to the China CINDA asset-management company (Zhongguo xinda zichan guanli gongsi 中國信達資產管理公司) for a near 60 per cent discount.Footnote 6 The exigency of a fast-track listing clearly bore heavily upon the sales price. Reference to the CCB prospectus reveals that, between the 2002 and 2003 accounting year-ends, CCB's NPL ratio was radically pared-back through loan sales to CINDA (at an approximate 50 per cent discount), generating revenue of approximately 65 billion yuan.Footnote 7
Comparison of Non-Performing Loan (NPL) Ratios for the Six (A-and H-Listed) State-Owned Commercial Banks (%)

Notes:
(1) NPL figures for the Bank of Communications were not directly stated for the 2007 and 2008 year ends and 2009 half-year. Instead reliance was placed on “impaired loans ratio” figures as stated in its Interim Report 2008, p. 3 and Interim Report 2009, p. 2.
(2) All figures are for year-ends except those for 2009 which relate to the half year-end.
Sources:
BOCOM Prospectus, p. 173, BOCOM Annual Report 2006, p. 76, 2008, p. 3, BOCOM Interim Report 2009, p. 2; CCB Prospectus, p. 181, CCB Annual Report 2006, p. 34, CCB Half-Year Report 2008, p. 28, 2009, p. 32; BOC Annual Report 2006, p. 68, BOC Interim Report 2008, p. 22, 2009, p. 25; CMB Prospectus, p. 229, CMB Annual Report 2007, p. 38, CMB Interim Report 2008, p. 23, 2009, p. 26; ICBC Prospectus, p. 210, ICBC Annual Report 2006, p. 78, ICBC Interim Report 2008, p. 56, 2009, p. 47; CITIC Bank Prospectus, p. 200, CITIC Interim Report 2008, p. 28, 2009, p. 52.
A similarly ambitious timetable for hiving-off NPLs is also revealed in Table 2 for BOC and ICBC. However, CMB and CITIC Bank appear as outliers in the process given their relatively low NPL rates in the years prior to IPO. This was particularly so for CMB with a rate of around 3.2 per cent more than three years ahead of its H-share IPO.Footnote 8 While NPL rates of 2 to 3 per cent appear high by international norms, the prevalence of state-owned enterprise borrowers in the overall Chinese economy means that loan delinquency rates are likely to be at non-trivial levels. What is significant about CMB, and to a lesser extent CITIC Bank,Footnote 9 is the establishment of an NPL rate well below that of its peers in the years prior to IPO restructuring. In marked contrast to other banks, CMB had established a strong commercial basis to its lending policies well ahead of its Hong Kong listing.Footnote 10
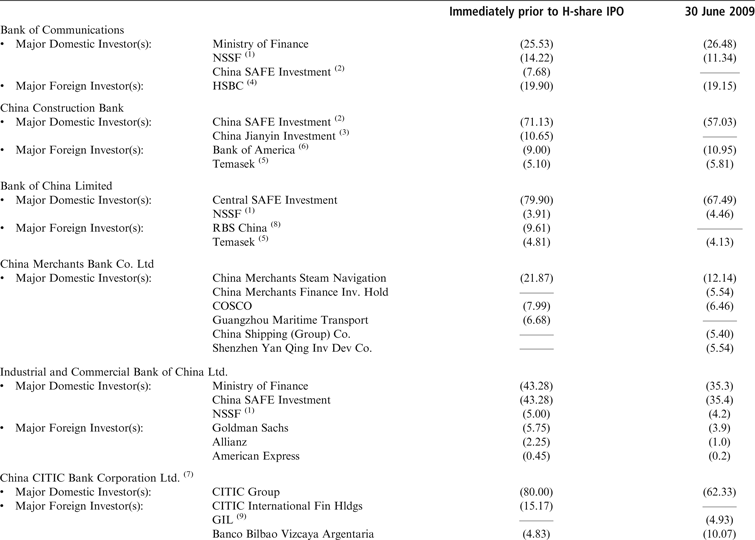
The identity of a state-owned bank's leading state investor is also important in signalling the extent to which the underlying entity's commercial interests might be mitigated by broader political or socio-economic concerns. As can be seen from Table 3, the dominant shareholder for each of ICBC, BOC, CCB and BOCOM hails from the regulatory sphere and, therefore, from within the core of the PRC state. China SAFE Investments (Zhongyang huijin touzi youxian zeren gongsi 中央汇金投资有限责任公司) plays a leading role, especially in relation to CCB and the BOC where pre-IPO stakes of well over 70 per cent were apparent. In respect of ICBC and BOCOM, the sizeable pre-IPO stake of China SAFE Investments of 43.28 and 7.68 per cent respectively were bolstered by holdings from the Ministry of Finance of 43.28 and 25.53 per cent.Footnote 11
The Pre-IPO and Post-IPO Ownership Structure of China's Leading Banks (%)

Notes:
(1) NSSF refers to the China National Social Security Fund.
(2) From inspection of various prospectus documents, China SAFE Investment Limited is also referred to as Huijin and also China Central SAFE Investment Limited.
(3) China Jianyin Investment is wholly-owned by China SAFE Investment Limited [see Anderlini,J. (2006), ‘Firm Hand Steers Vehicle of Financial Reform’, South China Morning Post, 6 February 2006, p. 2.
(4) For BOCOM there was a further ‘unlisted foreign share’ investor, holding 0.06 per cent of the issued shares pre-IPO (see BOCOM Prospectus, p. 199).
(5) For CCB and BOC, Temasek's holdings were housed under AFH (see CCB Prospectus, p. 84 and BOC Prospectus, p. 102).
(6) Bank of America's interest in CCB (see Half-Year Report, 2009, p. 51 & 53) only reflects its direct (and not indirect) ownership of shares.
(7) For the full names of the major foreign players, see CITIC Bank Corporation Prospectus (p. 18 and p.97).
(8) For Bank of China, the Royal Bank of Scotland held more than 51 per cent of the RBS China (Bank of China Prospectus, p. 213).
(9) “GIL is a wholly-owned subsidiary of CITIC Group” (CITIC Bank Interim Report, p. 67).
Sources:
BOCOM Prospectus, p. 197, and Interim Report, 2009, p. 40; CCB Prospectus, pp. 17, 84, 166, and Half-Year Report, 2009, pp. 51, 53; BOC Prospectus, pp. 19, 102, 213, and Interim Report, 2009, p. 36; CMB Prospectus, p. 209, and Interim Report, 2009, p. 67; ICBC Prospectus, pp. 15, 186, and Interim Report, 2009, p. 63; China CITIC Bank Corporation Prospectus, pp. 18, 97, 181, and Interim Report, 2009, p. 67.
State ownership of banks is also notable elsewhere. As reported in La Porta, Lopez-de-Silanes and Shleifer's study of 92 countries, government ownership stakes were, as recently as 1995, persistent and pervasive features of leading banks in several jurisdictions.Footnote 12 Moreover, the recent foray by governing bodies in the UK and US in their constituent bank markets will have increased average government ownership levels in these two jurisdictions.
The presence of significant state-based regulatory players in respect of ICBC, BOC, CCB and BOCOM offers both opportunity and challenge. Opportunity arises from the protection of market share; challenge from the responsibilities imposed by the core state-related stakeholders. Banks with such an ownership characteristic may serve to buttress the state's myriad of social and political objectives, many of which run counter to promoting banks' profitability. The Guangdong International Trust and Investment Corporation collapse during the late 1990s provides a salutary reminder of this, given BOC's appointed role in bailing-out the ailing giant.Footnote 13 While times have changed, and China's leading state-owned banks have become more commercially oriented and perhaps less politically motivated in their overall business mission, their proximity to the state by virtue of their ownership structure remains.
In contrast, both CITIC Bank and CMB are controlled by corporate-based players. These are the CITIC Group (80 per cent), in the CITIC Bank case, and three commercially oriented state-owned enterprise transportation/shipping companies in CMB's. We conjecture that, despite the controlling players' obvious connection to the state, their corporate status imbues them with a much greater commercial inclination, as is consonant with the two banks' more favourable NPL history.
We now turn to the role of international investors in re-capitalizing China's leading banks. This largely involved significant pre-IPO (private equity) injections as well as share allocations through the H-share IPO. As Table 3 shows, major strategic stakes were procured pre-IPO by international commercial banks like the Bank of America (in the China Construction Bank), HSBC (in the Bank of Communications), the Royal Bank of Scotland (in the Bank of China) and Banco Bilbao Vizcaya Argentaria (in the China CITIC Bank). A range of other international investors, including the Singaporean government's investment arm Temasek (in the China Construction Bank and the Bank of China) and Goldman Sachs, American Express and Allianz (in the ICBC) also amassed notable equity stakes prior to H-listing.
As China arguably houses the most important emerging financial services market in the world, first-mover advantage in acquiring strategic tie-ups with dominant incumbent players potentially offers lucrative long-term financial benefit.Footnote 14 We speculate that an “institution-based” perspectiveFootnote 15 is germane to an understanding of the actions of foreign strategic investors. Their ability to leverage country-specific customs and networks,Footnote 16 through direct equity participation, would appear to be paramount despite recent convergence in the regulatory banking treatment of domestic and foreign players.Footnote 17 However, we do not specifically tease-out the underlying motivations for such investments.
In terms of the pre-IPO re-capitalization of the various state-owned bank entities, attention again turns to BOCOM. As set out in its prospectus document, the People's Bank of China gave its assent to a radical capital injection programme. In addition to the Ministry of Finance and China SAFE Investments Limited, funds were also injected by the National Social Security Fund and an assortment of BOCOM's established shareholders. All told, the various sources contributed to a private equity injection of over 19 billion yuan. A substantial investment was also made by HSBC in the form of “unlisted foreign shares,” resulting in a 19.9 per cent stake.Footnote 18
With the notable exception of CMB, all the state-owned banks received substantial amounts of pre-IPO funding from foreign shareholders (see Table 3). As with HSBC's stake in BOCOM, these appear in the form of “unlisted foreign shares.”Footnote 19 CITIC Bank attracted the largest stake with a co-joined holding of around 20 per cent. This was closely followed by BOCOM (around 19.9 per cent), BOC (around 15 per cent), CCB (around 14 per cent) and ICBC (over 9 per cent). In all these cases, provision was made for all major unlisted foreign share holdings to be converted into H-form upon IPO completion. In the case of CCB it was also apparent that, upon listing, shares held by its pre-listing domestic stockholders – China SAFE Investment and China Jianyin Investment – would also be automatically converted into H-form. As noted by McGuinness, CCB is the only mainland PRC-incorporated issuer to have all its outstanding stock in H-share form.Footnote 20
IPO Structures and Pricing Forms
The aggregate dollar value of gross proceeds raised through Hong Kong IPO was around three times that raised through Shanghai IPO (see Table 1). This reflects the truly international status of Hong Kong, in which markets are free of capital and exchange control restrictions. In contrast, mainland China still adheres to a closed capital account regime; by connection, all Shanghai-based IPOs must be pitched at domestic mainland (institutional, corporate and retail) investors.
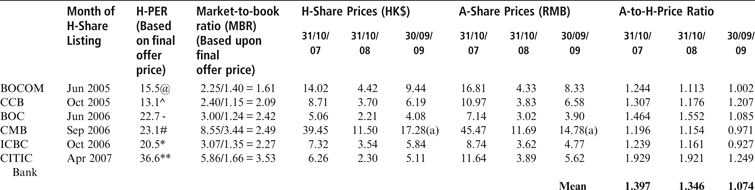
The capital control feature underlies the segmented equity structure of mainland-incorporated entities.Footnote 21 Specifically, shares offered through Shanghai A-IPO constitute a different block of stock from H-shares offered to international investors in Hong Kong. This often means that secondary pricing conditions are starkly different. As noted by McGuinness, the rather different supply and demand conditions give rise to marked pricing differences, with A-shares typically priced at a premium to the corresponding entity's listed H-shares. At the market peak in October 2007, the RMB A-share prices of all six state-owned commercial bank issuers were trading at sizeable premiums to the same entities' corresponding HK$ H-share prices (see Table 4). Sizeable A-share premiums were similarly in evidence in October 2008.
Comparison of Price-to-Earnings Ratios and Market-to-Book Ratios for the Six State-Owned Banks with H-Share Listing

Notes and Sources:
PERs are based upon maximum offer prices, the total number of shares outstanding upon listing and fully-diluted “pro forma” forecasts of earnings.
@ BOCOM Prospectus, p. 8, nn. 1, 3. The “adjusted net tangible asset value per share” used to compute the MBR reflects the ‘”mid-point of the estimated offer price range” (n. 5, p. 8) where such a price is HK$2.25.
^ CCB Prospectus, p. 12, nn. 1, 2. The MBR is based upon the maximum offer price and number of shares at point of initial listing (see n. 4, p. 12 for explanation).
˜ BOC Prospectus, p. 12, nn. 1, 2. The MBR is based upon the maximum offer price (see n. 4, p. 12).
# CMB Prospectus, p. 13, n. 2 under “profit forecast,” p. 11, n. 2 under “offer statistics.” The MBR is based upon the maximum offer price and number of shares at point of initial listing, but “assuming no conversion of our convertible bond subsequent to August 15, 2006” (see n. 4 under “offer statistics,” p. 11 for explanation).
* ICBC Prospectus, p. 11, n. 1. PER based on the number of shares from both H-and A-share issues as of the point of initial listing (see n. 3, p. 11 for explanation). The MBR is based upon the maximum offer price in both the H- and A-shares in issue after completion of both H- and A-share issues at point of initial listing (see n. 3, p. 11 for explanation).
** CITIC Bank Prospectus, p. 13, “offer statistics,” n. 1. The MBR is based upon the maximum offer price (see p. 13).
Actual closing stock prices for 31 October 2007, 31 October 2008 and 30 September 2009 were drawn from Datastream.
(a) Connotes that CMB's raw closing prices for 30 September 2009 reflect the situation after a 3 for 10 bonus issue made in the company in the first quarter of 2009 (for the other five stocks, unadjusted prices were equivalent to adjusted prices).
Exchange rates for 31 October 2007, 31 October 2008 and 30 September 2009, as sourced from Datastream, were RMB 1.00 = HK$ 1.0376, RMB 1.00 = HK$ 1.1357 and RMB 1.00 = HK$ 1.1353, respectively.
Such pricing differences are persistent and come about due to arbitrage restrictions. However, as Birtch and McGuinness attest, Footnote 22 some convergence in the A- to H-pricing premium has occurred in recent years because of an increasingly porous capital account, especially on the outward side. Much of this convergence took place between 2001 and 2005, and is therefore of little import to the six state-owned commercial bank issuers of interest, none of which had concurrent share listings during the 2001–05 period.
Despite the very different secondary market conditions in Hong Kong and Shanghai, in the two cases where A- and H-share IPOs were synchronized (the CITIC Bank and ICBC cases) final offering prices were fixed at the same exchange-adjusted level. To illustrate, and as reported in Table 1, CITIC Bank's A-share IPO in April 2007 was priced at 5.80 yuan and its corresponding H-share IPO at exactly the same exchange-adjusted level. This aroused some disquiet at the time given the vastly different conditions in the two secondary markets. Such concerns were quickly vindicated: on the first day of listing, A-share prices more than doubled in value while H-prices rose modestly by just over 15 per cent.Footnote 23
In terms of the IPO forms, only one of the six state-owned bank H-offerings contained a secondary offer component. This was the ICBC case, in which a quarter of the shares in the H-global offering emanated from controlling shareholders.Footnote 24 All IPO shares in the six state-owned bank A-share offerings were primary offer shares.
Initial pricing: the price-to-earnings and market-to-book ratios of the H-share issuers
Table 4 provides a summary of the initial pricing levels of each of the six state-owned bank issuers. Comparison is made in relation to the price-to-forecast-earnings ratio (PER) and the market-to-book ratio. In all cases, the key figures were gleaned from disclosures in relevant prospectus documents. Given that BOCOM and CCB were the first state-owned banks to list outside the Chinese mainland, it is not surprising to find that both were associated with lower PERs than BOC, CMB, ICBC and CITIC, which listed later in 2006 and 2007.
The widely appreciated NPL problem and a fear that such bank entities might not have developed the requisite commercial orientation for listing were factors that led issuers and their underwriters to discount offer prices. Clearly the inclusion of strategic foreign players, most notably HSBC in BOCOM and the Bank of America and Temasek in CCB, helped mitigate such concerns. The significant stakes amassed, and the lengthy lock-ups declared by such players (three years in the case of HSBC)Footnote 25 also served to reinforce the positive signals. Strategic investor agreements, which in the case of HSBC and BOCOM signalled an alliance to develop a special purpose credit-card vehicle in mainland China, were further reassurances.Footnote 26
The slightly lower PERs in BOCOM and CCB were also reflective of market sentiment at the time. Though such sentiment was generally improving during much of 2005, overall market pricing was substantially lower than in 2006 and 2007. The more ebullient market conditions of 2006 and 2007 therefore partially account for the higher PERs on BOC, CMB, ICBC and CITIC, which ranged from 20.5 to 36.6 times. The obvious outlier is CITIC Bank which was priced aggressively relative to its peers. Its market-to-book ratio stood at around 3.5 times, as compared to levels of 2.27, 2.42 and 2.49 for ICBC, BOC and CMB.
Though respectable, the secondary market price performance of CITIC Bank's stock has trailed that of its peers. The use of a common exchange-adjusted offering price across the synchronized A- and H-share IPOs may be one reason for this. In particular, the issuer and its advising agents may well have ratcheted up the offering price to reflect the higher PERs and the more ebullient market conditions prevalent in the Shanghai secondary market in April 2007. Use of a common offering price across A- and H-share offerings is clearly problematic given the two markets' segmented investor types. Moreover, mainland Chinese regulators' requirement that H-offering prices be set at levels at least equal to corresponding A-offering prices simply exacerbates the problem.Footnote 27
The Post-Listing Experience
The non-performing loan, loan book size and profitability picture
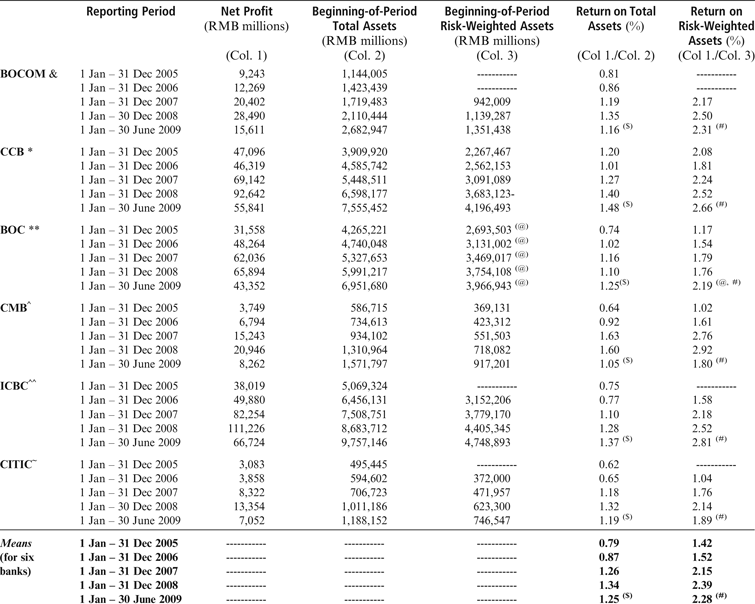
We find that post-IPO all six banks have been successful in raising profitability, expanding loan book size and, most importantly, further excising NPLs. Impressively, four of the six banks were able to more than triple their RMB net profit levels between 2005 and 2008. This is all the more notable given the opening of China's banking market to foreign competition over more or less the same period.
In terms of loan book quality, Table 2 succinctly summarizes the situation. At the 30 June 2009 half-year end, NPL rates ranged from 0.9 per cent (in the case of CMB) to 1.8 per cent (BOC). This compares very favourably to the six entities' NPL rates for the year-end prior to IPO (with rates ranging from 2.5 to 4.7 per cent) and is indicative of a further round of tightening. A few words of caution may nevertheless be warranted. First, as noted by Dobson and Kashyap, loans classified as “special mention” could well disintegrate in quality terms in an economic down-turn. CCB, BOC and ICBC still have 3.6 per cent or more of their loan books in this category and may therefore be more vulnerable than CMB and CITIC Bank, which each have “special mention” rates of 1.1 per cent. Second, real GDP growth in excess of 10 per cent per annum in recent years has made it easier to purge NPLs. A marked economic downturn would work against this goal. Further gains may be much harder to come by if 2009 and 2010 real GDP growth rates remain at levels similar to 2008 rates.Footnote 28
Impressively, the marked compression in NPL rates has all been achieved on the back of rising RMB loan balances. Reference to the banks' 2008 annual reports reveals growth in RMB loan balances and advances, as measured between the 2005 and 2008 financial year-ends, of approximately 38 per cent for ICBC, 47 per cent for BOC, 54 per cent for CCB, 73 per cent for BOCOM, 86 per cent for CMB and 80 per cent for CITIC.Footnote 29 The largest percentage increases in RMB loan asset values occurred in BOCOM, CMB and CITIC, the fifth, sixth and seventh ranked banks respectively. These three banks also have the lowest NPL rates among the six Hong Kong-listed state-owned banks. This is consistent with a significant amount of dilution brought about by new loans, which typically rank in the first quintile of asset quality during the incipient phase of their life.
In relation to profitability, there is good reason to be optimistic given Berger, Hasan and Zhou's analysis of state-owned banks perched just outside China's top-tier. For 38 Chinese banks over the ten-year period 1994–2003 they found the establishment of foreign equity stakes to be coincident with improved bank performance. By extrapolating beyond their sample, they conjecture that “minority foreign ownership of the Big Four will likely improve performance significantly.”Footnote 30 We provide evidence broadly consistent with this conjecture. Between the 2005 and 2008 financial year-ends, net profits rose by around 193 per cent in ICBC, 109 per cent in BOC, 97 per cent in CCB, 208 per cent in BOCOM, 459 per cent in CMB and 333 per cent in CITIC.Footnote 31 The largest increases in profitability are evident in CMB, CITIC and BOCOM which, as noted, also enjoy the lowest NPL rates. Of the three top-four banks with listed status (ICBC, BOC and CCB), CCB appears as the laggard. Nevertheless, it still managed nearly to double its net profits between 2005 and 2008.
Useful comparison can also be made with Dobson and Kashyap. They note, for the 2005 year end, that, collectively, BOCOM, CMB and CCB underperformed a comparable set of Hong Kong-listed banks in relation to net profit return on total assets (and “risk-weighted assets”). For “net profit as percentage of average assets,” they report a mean rate for the three banks of 0.8 as compared to 1.4 for Hong Kong banks.Footnote 32 Table 5A presents profitability measures for the four financial years 2005–08 and the 2008 half-year. Results for 2005 broadly mirror those cited in Dobson and Kashyap, given a mean ratio of net profits to beginning-of-period assets of 0.79 for the six banks. This profitability measure had nearly doubled (to 1.34 per cent) by the 2008 year end. Again, this highlights the recent surge in state-owned commercial bank profitability. Significantly, this has been sustained all the way through to the 2009 half-year end, and therefore through some of the more inclement phases of the global credit crunch.
Summary Details of Profitability, Asset Size and Return on Assets for the Six State-Owned Banks

Sources: For data items in Columns (1), (2) and (3),
& BOCOM annual reports (2006, p. 83), (2007, p. 134 & 216), (2008, p. 3, 138 & 327) and Interim Report 2009 (p. 2, 59 & 114);
* CCB annual reports (2005, p. 4 & p. 55), (2006, p. 33), (2007, p. 8 & 274), (2008, p. 8 & 42) and Half-Year Report 2009 (pp. 6–7 & 31);
** BOC Prospectus (pp. 5–6 & 307); annual reports (2006, ‘Financial Highlights’ & p. 338), (2007, ‘Financial Highlights’ & p. 263), (2008, ‘Financial Highlights’ & p.356) and Interim Report 2009 (p. 2 & 133);
^ CMB Prospectus (pp. 7–8 & 44), annual reports (2007, p. 6, 46 &132), (2008, p. 10, 54 & 163) and Interim Report 2009 (p. 5, 37 & 97);
^^ ICBC annual reports (2007, p. 4 & 59), (2008, p. 5 & 7); and Interim Report (2009, p. 5); and
~ CITIC Bank Prospectus (p. 9), annual reports (2007, p. 4, 30, 41 &144), (2008, p. 5, 40 & 145) and Interim Report (2009, p. 2, 24 & 85).
Notes: Net profit equates to ‘profit for the year’.
($) Determined by multiplying the net profit for the 1 January to 30 June 2009 by 2 and then by dividing through by beginning-of-period total assets;
(#) Determined by multiplying the net profit for the 1 January to 30 June 2009 by 2 and then by dividing through by beginning-of-period risk-weighted assets; and
(@) Referred to as a ‘Risk-weighted assets and market risk capital adjustment’ in relevant documents.
As an interesting reference point, we also consider Hong Kong's three largest non-mainland domiciled banks: the Hong Kong and Shanghai Banking Corporation, Standard Chartered PLC and Hang Seng Bank. At the 2005 year end, the three banks' mean return on beginning-of-period total assets (of 1.56, see Table 5B) was broadly comparable to that on “average assets” of 1.40 in Dobson and Kashyap. However, unlike the state-owned commercial banks which experienced a marked improvement in this return level from 1 January 2006 to 31 December 2008, the three major Hong Kong banks taken together experienced a contraction in profitability growth. In terms of the return on risk-weighted assets, the state-owned commercial banks again experienced greater growth than their Hong Kong bank counterparts. Indeed, as of the 2009 mid-year, mean return levels on beginning-of-period total asset and risk-weighted assets were higher for the six banks taken as a group. This is in marked contrast to 2005 and 2006, when a notable gap was evident, with major Hong Kong banks enjoying profitability levels almost twice those of their mainland counterparts.
Summary Details of Return on Assets for Hong Kong's Three Largest Non-Mainland PRC Domiciled Banks

Notes: (a) Risk weighted asset levels for Standard Chartered Bank PLC for the 2004–2006 year-ends were expressed in the relevant documents as "Total risk-weighted assets and contingents". For 2008 and 2007 year-ends, disclosures were expressed in Basel II form (Annual Report, p. 65).
(b) Risk-weighted levels for Hang Seng Bank were "adjusted for market risk", see annual reports (2005, p. 45); (2006, p. 52); and (2007, p. 207).
($) Determined by multiplying net profit for 1 January to 30 June 2009 by two and then dividing by beginning-of-period total assets.
(#) Determined by multiplying net profit for 1 January to 30 June 2009 by two and then dividing by beginning-of-period risk-weighted assets.
All mean return figures represent arithmetic averages across the three banks.
Source: Data items though not reported here (but available upon request) as relevant to Columns (1), (2) and (3) were extracted from,
HSBC's annual reports (2005, p. 1), (2006, p. 1 & 294), (2007, p. 1 & 337), (2008, p. 2, 4 & 333) and Interim Report (2009, p. 3);
Standard Chartered Plc's annual reports (2005, p. 37 & pp. 64–65); (2006, pp. 76–77 & p. 87); (2007, p. 61 & pp. 88–89), (2008, p. 65 & 96–97) and its Interim Report 2009 (p. 3, 43 & 45). The Interim
Report was available at http://investors.standradchartered.com/downloads.cfm); and
Hang Seng Bank's annual reports (2005, p. 45 & 62–63), (2006, p. 72 & pp. 69–70), (2007, p. 5, p. 83–84 & 207), (2008, p. 89–90 & 241) and its Interim Report 2009 (p. 22, 24 & 82).
Unusually buoyant economic conditions have undoubtedly played a part in the Chinese bank profit growth story. Regulatory issues may also be pertinent.Footnote 33 As an indicator, the spread between China's minimum one-year lending rate and the demand deposit rate widened markedly during 2006 and 2007. Between 1 January 2005 and 27 April 2006, a spread of 486 basis points was evident; by late 2007 this had risen to 675 basis points. Clearly, interventions by the PBOC helped to galvanize bank profitability during 2006 and 2007.Footnote 34 There were a number of rounds of tightening from mid-September 2008 onwards, culminating in a 495 basis point spread by the year end. The marked fall in the lending-borrowing spread, and the possibility of further contractions, perhaps signals a more challenging environment for Chinese state-owned commercial banks in 2010.
It is also likely that strategic foreign investors have wrought certain improvements in efficiency. Laurenceson and Qin, from a study of 66 Chinese banks between 2001 and 2006, provide tentative support for a positive link between foreign equity ownership and cost efficiency.Footnote 35 However, bank size and listed status appear to be much more important in explaining efficiency gains in their study. Perhaps the most important issue, which is not addressed, is the balance of foreign to domestic ownership. Notwithstanding this, any attempt to link foreign ownership to efficiency, and therefore profitably gains, is problematic due to an obvious endogeneity problem. In short, were foreign investors responsible for galvanizing banks into a more profit-orientated state or were they attracted because the banks had already made strides in this direction? The reality is likely to fall somewhere in between. We do not unequivocally attribute the turn-around in the banks' performance across the various dimensions to foreign participation per se. We conjecture that a cocktail of state sponsorship and foreign investor participation has been important in spurring bank profitability.
Certainly, post-listing earnings figures are consistent with banks adopting a more market-driven orientation. Evidence supporting this can be gleaned from careful examination of the banks' income statements. In particular, “net fee and commission income” now features as a far more important contributor to overall profit. To illustrate, BOC's ratio of “net interest”Footnote 36 to “net fee and commission income” fell from around 10.9 to 3.3 times between the 2005 year end and the 2009 half-year end. For ICBC and CCB a similar story unfurled with the ratio shifting over the same time frame from respective values of 14.6 and 13.8 to 4.2 and 4.4 times. Despite this, the banks are still vulnerable to state interference, especially during leaner economic times when broader socio-economic and political pressures may come to the fore. However, as China's state-owned commercial banks and the markets they operate in are more open than before, direct state interference in lending decisions may be somewhat constrained. However, this still leaves considerable scope for intervention through other means, principally the determination of funding and lending rates.
Risk management benefits: capital reserve and loan quality improvements
Media reports at the end of 2007 and the beginning of 2008 raised concerns about the exposure China's largest banks might have to loans originating in the US sub-prime sector. There were suggestions in particular that BOC might have non-trivial exposure to collateralized debt obligations. BOC's 2007 annual report provides some background detail on this issue. In particular, BOC reported for its year-end that:
The carrying value of US Alt-A mortgage backed securities was US$2.470 billion … representing 1.05 per cent of the investment securities of the Group, 98.21 per cent of which was AAA rated. The Group booked an impairment charge of US$0.285 billion … on US Alt-A and other US mortgage backed securities held as at 31 December 2007 (p. 39).
In general, such write-offs have been quite limited. Moreover, China's state-owned commercial banks, albeit with the clear backing of the central authorities, ably weathered the fall-out from Lehman Brothers' collapse in September 2008.
Risks are however apparent elsewhere. Leading Chinese banks still hold a considerable amount of their loan portfolio in non-secured form. As an example, BOC had, as of the 2008 year-end, over 29 per cent of the RMB value of its loan asset book in non-secured form.Footnote 37 Over 46 per cent of its loan book was supported by debtors' pledged assets (secured or collateralized loans) with the remainder (nearly 24 per cent) subject to guarantee. Similarly, ICBC had more than 29 per cent of its total loan book of 4,572 billion yuan in non-secured form.Footnote 38 Around 19 per cent of loan value was guaranteed with the remainder collateralized in various forms. This general picture points to considerable risk exposure. However, much of the non-secured loan book probably has its provenance in loans made to state-related parties and is therefore backed-up by implicit state guarantee. Nevertheless, the persistence of a relatively high proportion of assets in non-secured form offers a cautionary note against the banks' general improvement in loan book size and quality.
In terms of the total investment picture, it is pertinent again to focus on BOC and, in particular, the bank's consolidated balance sheet picture at the 2008 year end. Of its total assets in excess of 6,951 billion yuan, 45.9 per cent were “loans and advances” and 24.8 per cent financial assets (comprising “investment securities,” “financial assets at fair value through profit or loss” and “derivative financial instruments”).Footnote 39 The other major component consisted of “balances held with central banks,” equivalent to 17.4 per cent of its total assets as of the 2008 year end. A large component of this sum reflects “mandatory reserve funds placed with PBOC” which ran to 15.5 per cent of “eligible RMB deposits” as of the 2008 year end.Footnote 40 It is instructive to note that the banking authorities aggressively raised the reserve requirements of Chinese banks through much of 2007 and 2008. The ratio peaked in mid-2008 at 17.5 per cent of relevant bank deposits. A moderate retrenchment has occurred since.
Finally, in relation to the general issue of risk management, all six banks have been successful in maintaining capital adequacy ratios (CARs) well above the minimum threshold of 8 per cent of “risk-weighted” assets.Footnote 41 Annual reports for the 31 December 2008 year end reveal that, since 31 December 2005, five of the six state-owned commercial banks have been able to increase CAR levels. The respective CARs of BOC, ICBC, CITIC Bank, CMB and BOCOM increased from 10.42 to 13.43 per cent (p. 2), 9.89 to 13.06 per cent (p. 5; 2007 p. 6), 8.11 to 14.32 per cent (p. 5), 9.01 to 11.34 per cent (p. 10) and 11.20 to 13.47 per cent (p. 3). In contrast, CCB experienced a slight downward adjustment, from a rather high CAR level of 13.59 per cent at the 2005 year end to one of 12.16 per cent at 31 December 2008 (p. 9).Footnote 42
Post-listing share returns: A- and H-shares compared
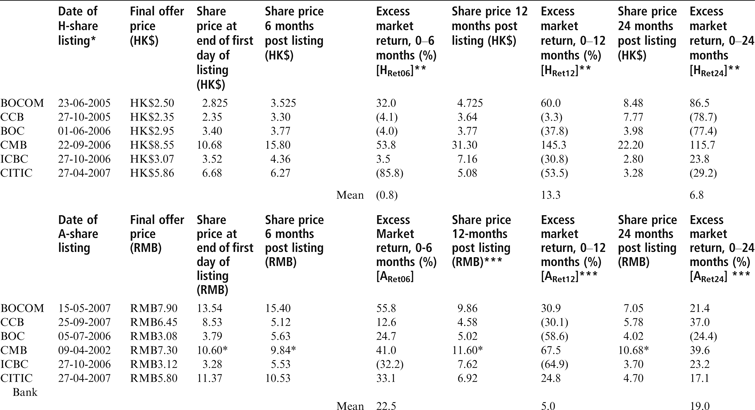
Share price returns have also been reflective of the six entities' underlying earnings performance. As shown in Table 6, the average return on such entities' H-shares, as measured from the final offer price and computed relative to the performance of the benchmark H-share index, was 13.3 per cent over the first 12 months of listing. Over the first two years, the relative mean return value was 6.8 per cent. While this suggests that the banks' H-shares have outperformed the general H-market, it is notable that the performance is quite mixed across the six bank stocks.
Comparison of the A- and H-Share Price Performance of the Six State-Owned Commercial Banks

Notes:
** HRet06, HRet12 and HRet24 are measured as excess market returns by taking the difference between raw returns and the corresponding return for the benchmark H-share index, the Hang Seng China Enterprises Index. Raw returns are measured relative to the final H-offering price while benchmark index returns are measured relative to the closing index value on the day of listing.
*** ARet06, ARet12 and ARet24 are measured as excess market returns by taking the difference between raw returns and the corresponding return for the benchmark Shanghai Stock Exchange A-share Index. Raw returns are measured relative to the final A-offering price while benchmark index returns are measured relative to the closing index value on the day of listing.
Sources:
See Table 1 (key) for details relating to the date of respective H- and A-share listings and the final offering prices relating to the each issue type. All post-IPO closing price share and index data were drawn from Datastream (except *, sourced from Yahoo finance).
After one year of listing, only CITIC Bank had a secondary H-price below its H-share offering price offer. As mentioned earlier, this is consistent with the rather aggressive PER set at IPO for this issuer. In stark contrast, and consonant with a rapid increase in earnings over the period, CMB cranked-up an (unadjusted) first year return of 266.1 per cent. Average price appreciation over the first 12 months of listing for the six banks' A-shares was also impressive. Measured from the A-share offering price, average returns, adjusted for contemporaneous movement in the Shanghai A-share index, stood at 5.0 per cent. After two years' listing, relative A-share returns fared even better with a mean of 19.0 per cent (Table 6).
It is also notable that the banks' A-share prices have typically exceeded H-levels. This largely reflects the same broad issue of old: large amounts of RMB savings, entrapped by capital control restrictions, chasing relatively few investment opportunities. For the six state-owned commercial banks, the average A-share premium at the October 2007 month end stood at around 39.7 per cent (see Table 4). This more or less coincided with the peak in global market valuations prior to the onset of the global credit crunch. One year later, in the aftermath of the Lehman Brothers collapse, A- and H-prices had plummeted. However, the A-share premium remained at more or less the same level. By the end of the third quarter of 2009 the six banks' average A-share premium had been eroded considerably; perhaps reflecting weaker overall sentiment in the A- as compared to H-share market environment.
Foreign investors' retention of strategic ownership stakes, procurement of board representation and joint-venture agreements with the six Chinese bank issuers
As noted above, five of the six banks gained substantial amounts of private equity investment from strategic foreign investors in the run-up to their H-share IPOs. Such injections have, in the main, been subject to strict and lengthy “lock-up” provisions. For example, the Bank of America, the holder of the larger of CCB's two pre-IPO equity injections from foreign parties, committed to retain its holding for a period of three years post-IPO.Footnote 43 Furthermore, a call option with expiry date 1 March 2011 was written by CCB's principal shareholder (Huajin) allowing the Bank of America to increase its holding in CCB post-IPO.Footnote 44 Indeed, the Bank of America exercised options in November 2008 to ratchet its interest up to over 19 per cent of CCB's outstanding stock.Footnote 45 Subsequent sales in the first half of 2009 saw this interest shaved to just below 11 per cent.Footnote 46
While most strategic foreign parties have retained their holdings more or less intact in the post “lock-up” period, a number of major stock disposals have taken place. The most obvious is the Royal Bank of Scotland's sale of its Bank of China holding in early 2009. Small-scale stock disposals have also been evident, notably Temasek's sale of shares in CCB and BOC in late 2007.Footnote 47 At the same time, parties like BBVA have significantly ratcheted-up their interest (in the case of the China CITIC Bank Corporation). Relative changes in the principal shareholder interests, from the period immediately prior IPO to the 2009 mid-year, are summarized in Table 3. One should also be aware that some of the slight percentage reductions tabulated reflect dilution occasioned by subsequent A-share IPO (relevant to BOCOM, CCB and BOC).
There have also been indications in the media that certain key strategic players may wish to enlarge existing equity stakes significantly. For example, HSBC, which has an interest in BOCOM just below the 20 per cent ceiling for foreign bank investment, may, according to media reports, be interested in increasing its interest should the China Banking Regulatory Commission relax current ownership limits.Footnote 48 A second ceiling, relating to aggregate foreign share participation of 25 per cent, is also pertinent. It is notable that this second ceiling has relevance to a number of state-owned banks outside the select group examined herein; specifically the Bank of Beijing and the Industrial Bank.Footnote 49
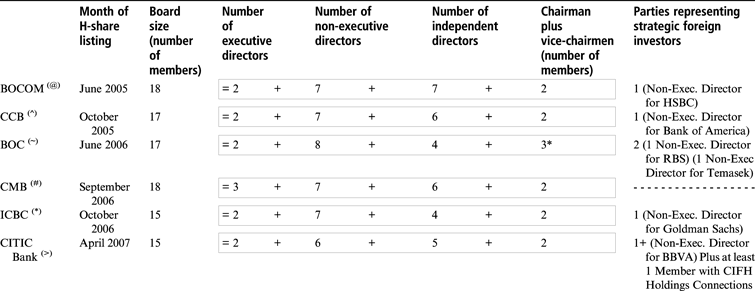
A number of representatives of significant foreign minority owners – normally those with a stake of 5 per cent or more of a bank issuer's outstanding stock – have also been able to enter constituent boards. As is apparent from Table 7, significant minority equity stakes established pre-IPO, and subsequently transformed at IPO into H-stock, have resulted in a number of strategic foreign investors securing non-executive directorships. Leaving aside CMB, which did not receive a “foreign-legal person” private-equity injection, BOCOM, CCB, BOC, ICBC and CITIC Bank all had at least one board member representing a significant foreign player at the 2007 financial year end. In the case of BOC, two of its eight non-executive directors hailed from such quarters, one from the Royal Bank of Scotland and another from Temasek. In the case of the CITIC Bank, its offshore affiliate CIFH is represented by at least one board member, given the close relationship between it and the CITIC Group, as well as one elected member for its other significant foreign investor, BBVA.
Summary Details of the Six State-Owned Commercial Banks' Board Composition at the 2007 Year End

Notes:
* Includes one honorary chairperson; chair and vice-chair also sometimes referred to as NEDs or EDs in annual reports, but not included in the respective figure for the number of non-executive directors or number of executive directors.
Sources:
@ Bank of Communications Company Limited Annual Report 2007, pp. 74–79.
^ China Construction Bank Annual Report 2007, pp. 110–19.
~ Bank of China Limited Annual Report 2007, pp. 95–100.
# China Merchants Bank Annual Report 2007, pp. 77–83.
* Industrial and Commercial Bank of China Limited Annual Report 2007, pp. 23–27.
> China CITIC Bank Corporation Limited Annual Report 2007, pp. 113–18.
Strategic investors' board representation, and the maintenance of substantial ownership stakes in the wake of IPO lock-up expiry, may point to such investors' confidence in underlying fundamentals. They may also be reflective of the difficulties foreign players have in penetrating the Chinese banking market, in the absence of co-operative agreements with leading state-related players. According to Howson and Ross,Footnote 50 such difficulties help explain why foreign minority stakes were established in earlier years across a range of medium to large Chinese state-owned banks. Leung and Chan also indicate that despite WTO liberalization, barriers remain in terms of inter-bank RMB borrowing ceilings and branch-level capitalization requirements.Footnote 51
The profusion of foreign equity stakes is also consistent with Luo's contention that multi-national corporations have turned volte-face in their China dealings, transforming themselves from competitors into strategic partners. Luo attributes this to a convergence in the regulation of domestic and foreign parties. Specifically,
China's overall regulatory framework is trying to head toward similar treatment of foreign and local firms … It seems to be the aim of central government to gradually eliminate discriminations against foreign companies in the area of operational rights as well as removing preferential taxation offered to those companies vis a vis local counterparts.Footnote 52
A key driver behind the procurement of strategic investment stakes is the advantage they offer in relation to joint venture possibilities. For example, HSBC's 19.9 per cent injection in BOCOM paved the way for a range of co-operative agreements, including the creation of a special purpose joint-venture credit card vehicle.Footnote 53 Given that foreign banks are proscribed from directly launching credit cards on the mainland.Footnote 54 HSBC's “credit cards co-operation agreement” with BOCOM (in which a stand alone “unit” within BOCOM was created for the purpose) makes abundant economic sense.
Reference to other strategic investor agreements, as disclosed in the various entities' prospectus documents, point to benefits relating to technical support, enhanced corporate governance and, where applicable, technology transfer.Footnote 55 One might surmise that an “institution-based” perspective is relevant, where market “frictions” inhibit active foreign participation.Footnote 56 This applies most readily to business networks, where informal channels may be critical for market penetration and therefore business success, as well as to specific regulatory barriers.Footnote 57 The credit-card market provides one salient example of the latter. Diversification into other financial services areas may also result from the political goodwill engendered by a significant equity stake.
We would posit that elements of both co-operation and competition are inherent parts of the strategic investment process. As argued by Leung and Chan,Footnote 58 foreign investors in Chinese banks utilize “market niching,” “market challenging” and “strategic alliance” strategies to varying degrees to win market share. The increasing internationalization and hence commercialization of China's leading banks may also allow them to engage more decisively with the principal contributor to the Chinese economic growth story: the country's dynamic private sector.Footnote 59
In addition, recent moves by Chinese state-owned commercial banks into overseas markets resonate with Child and Tse's key proposition that increased domestic competition empowers China's leading state-related players to compete more effectively offshore.Footnote 60 Recent evidence suggesting Chinese banks' growing overseas participation – through the establishment of offshore branch outlets and acquisition attempts – provides compelling support for this view. China's huge foreign exchange reserves of more than US$2 trillion allied to falling global asset prices during much of 2008/09 provided further reasons for overseas investment.
Concluding Remarks
The recent listing of China's largest state-owned banks in Hong Kong and Shanghai represents a major step forward in the reform and recapitalization of the country's financial sector. The speed of change has been marked, and represents a shift from the iterative/incremental reform process of earlier years.Footnote 61 We examine the scope and effectiveness of the bank reform programme through careful case analysis of China's leading banks. Detailed analysis shows that two initiatives have been paramount in the banks' overall reorganization: an aggressive policy to remove NPLs from the banks' balance sheets and, decisively, a massive re-capitalization of the entities' balance sheets.
The second important issue addressed is the extent to which the banks' desire to reform and commercialize has been successfully implemented post-IPO. With all the positive intent in the world, such banks are beholden to policy change reflecting a myriad of political and socio-economic issues. Such policy change can potentially militate against planned reform. Against this background, we show that China's leading banks have been able to enhance profitability, loan book size, loan quality and capital protection. Notable risks remain, however. Specifically, it is still too early to assess the overall impact of the global credit crunch on the banks' bottom lines. While relatively little exposure to collateralized sub-prime securities is evident, other risk factors still loom large. Relatively large amounts of non-secured loan assets and the potential pressures exerted by dominant state-related owners could both serve to constrain future profit growth. What has also been clear is the central authorities' desire for state-owned banks to increase lending rates. As indicated by the Economist Intelligence Unit, the massive surge in Chinese bank lending in 2008 may eventually lead to an upswing in non-performing loan rates.Footnote 62 At the same time, the state's readiness to intervene, by perhaps recapitalizing state-owned banks, is seen by many as an important potential safeguard. Increased activity by China's asset-management companies may also be needed if NPL rates are to dip further.
By and large, foreign investors have retained sizeable holdings and now wield some influence on the banks' day-to-day activities. This is principally achieved through board participation and the creation and expansion of joint ventures. Moreover, the newly contestable Chinese banking market provides a potentially massive engine-for-growth for international financial institutions able to develop sound strategies for effective participation. Despite convergence in the regulatory treatment of foreign and domestic parties, idiosyncrasies in the Chinese business environment remain. As such, an “institution-based” view of foreign investment seems most appropriate, where international players leverage the networks and political goodwill of key state-related controlling shareholders.Footnote 63
As a corollary of the above, we also note that foreign banks remain as fringe players in the domestic Chinese marketFootnote 64. As suggested in Leung and Chan, it will take many years before leading foreign banks are able develop physical branch and distribution networks to compete effectively with dominant domestic concerns. We conjecture that the recent success of China's leading state-owned commercial banks reflects their growing commercial orientation (especially for the fifth, sixth and seventh ranked banks) and, through the fusion of interest of incumbent state-based and foreign strategic players, a clearly defined strategy to consolidate market share. The Bank of Communications' strategic tie-up with HSBC, as well as its proximity to the PRC state, provides apt demonstration of this in relation to China's fledgling credit-card market.Footnote 65
Finally, further reform and commercialization of China's leading banks appears likely, for no other reason than forestalling potential loss of domestic market share to foreign banks. Such moves also resonate with Child and Tse's proposition that “the development of competitive domestic markets equips strong Chinese firms to internationalize their operations.”Footnote 66 Chinese banks' recent foray into overseas markets is consistent with this premise.