





%20--%3e%3c!DOCTYPE%20svg%20PUBLIC%20'-//W3C//DTD%20SVG%201.0//EN'%20'http://www.w3.org/TR/2001/REC-SVG-20010904/DTD/svg10.dtd'%3e%3csvg%20version='1.0'%20id='Layer_1'%20xmlns='http://www.w3.org/2000/svg'%20xmlns:xlink='http://www.w3.org/1999/xlink'%20x='0px'%20y='0px'%20width='64px'%20height='64px'%20viewBox='5.5%20-3.5%2064%2064'%20enable-background='new%205.5%20-3.5%2064%2064'%20xml:space='preserve'%3e%3cg%3e%3ccircle%20fill='%23FFFFFF'%20fill-opacity='0'%20cx='37.785'%20cy='28.501'%20r='28.836'/%3e%3cpath%20fill='%23595959'%20d='M37.441-3.5c8.951,0,16.572,3.125,22.857,9.372c3.008,3.009,5.295,6.448,6.857,10.314%20c1.561,3.867,2.344,7.971,2.344,12.314c0,4.381-0.773,8.486-2.314,12.313c-1.543,3.828-3.82,7.21-6.828,10.143%20c-3.123,3.085-6.666,5.448-10.629,7.086c-3.961,1.638-8.057,2.457-12.285,2.457s-8.276-0.808-12.143-2.429%20c-3.866-1.618-7.333-3.961-10.4-7.027c-3.067-3.066-5.4-6.524-7-10.372S5.5,32.767,5.5,28.5c0-4.229,0.809-8.295,2.428-12.2%20c1.619-3.905,3.972-7.4,7.057-10.486C21.08-0.394,28.565-3.5,37.441-3.5z%20M37.557,2.272c-7.314,0-13.467,2.553-18.458,7.657%20c-2.515,2.553-4.448,5.419-5.8,8.6c-1.354,3.181-2.029,6.505-2.029,9.972c0,3.429,0.675,6.734,2.029,9.913%20c1.353,3.183,3.285,6.021,5.8,8.516c2.514,2.496,5.351,4.399,8.515,5.715c3.161,1.314,6.476,1.971,9.943,1.971%20c3.428,0,6.75-0.665,9.973-1.999c3.219-1.335,6.121-3.257,8.713-5.771c4.99-4.876,7.484-10.99,7.484-18.344%20c0-3.543-0.648-6.895-1.943-10.057c-1.293-3.162-3.18-5.98-5.654-8.458C50.984,4.844,44.795,2.272,37.557,2.272z%20M37.156,23.187%20l-4.287,2.229c-0.458-0.951-1.019-1.619-1.685-2c-0.667-0.38-1.286-0.571-1.858-0.571c-2.856,0-4.286,1.885-4.286,5.657%20c0,1.714,0.362,3.084,1.085,4.113c0.724,1.029,1.791,1.544,3.201,1.544c1.867,0,3.181-0.915,3.944-2.743l3.942,2%20c-0.838,1.563-2,2.791-3.486,3.686c-1.484,0.896-3.123,1.343-4.914,1.343c-2.857,0-5.163-0.875-6.915-2.629%20c-1.752-1.752-2.628-4.19-2.628-7.313c0-3.048,0.886-5.466,2.657-7.257c1.771-1.79,4.009-2.686,6.715-2.686%20C32.604,18.558,35.441,20.101,37.156,23.187z%20M55.613,23.187l-4.229,2.229c-0.457-0.951-1.02-1.619-1.686-2%20c-0.668-0.38-1.307-0.571-1.914-0.571c-2.857,0-4.287,1.885-4.287,5.657c0,1.714,0.363,3.084,1.086,4.113%20c0.723,1.029,1.789,1.544,3.201,1.544c1.865,0,3.18-0.915,3.941-2.743l4,2c-0.875,1.563-2.057,2.791-3.541,3.686%20c-1.486,0.896-3.105,1.343-4.857,1.343c-2.896,0-5.209-0.875-6.941-2.629c-1.736-1.752-2.602-4.19-2.602-7.313%20c0-3.048,0.885-5.466,2.658-7.257c1.77-1.79,4.008-2.686,6.713-2.686C51.117,18.558,53.938,20.101,55.613,23.187z'/%3e%3c/g%3e%3c/svg%3e)
%20--%3e%3c!DOCTYPE%20svg%20PUBLIC%20'-//W3C//DTD%20SVG%201.0//EN'%20'http://www.w3.org/TR/2001/REC-SVG-20010904/DTD/svg10.dtd'%3e%3csvg%20version='1.0'%20id='Layer_1'%20xmlns='http://www.w3.org/2000/svg'%20xmlns:xlink='http://www.w3.org/1999/xlink'%20x='0px'%20y='0px'%20width='64px'%20height='64px'%20viewBox='5.5%20-3.5%2064%2064'%20enable-background='new%205.5%20-3.5%2064%2064'%20xml:space='preserve'%3e%3cg%3e%3ccircle%20fill='%23FFFFFF'%20fill-opacity='0'%20cx='37.637'%20cy='28.806'%20r='28.276'/%3e%3cg%3e%3cpath%20fill='%23595959'%20d='M37.443-3.5c8.988,0,16.57,3.085,22.742,9.257C66.393,11.967,69.5,19.548,69.5,28.5c0,8.991-3.049,16.476-9.145,22.456%20C53.879,57.319,46.242,60.5,37.443,60.5c-8.649,0-16.153-3.144-22.514-9.43C8.644,44.784,5.5,37.262,5.5,28.5%20c0-8.761,3.144-16.342,9.429-22.742C21.101-0.415,28.604-3.5,37.443-3.5z%20M37.557,2.272c-7.276,0-13.428,2.553-18.457,7.657%20c-5.22,5.334-7.829,11.525-7.829,18.572c0,7.086,2.59,13.22,7.77,18.398c5.181,5.182,11.352,7.771,18.514,7.771%20c7.123,0,13.334-2.607,18.629-7.828c5.029-4.838,7.543-10.952,7.543-18.343c0-7.276-2.553-13.465-7.656-18.571%20C50.967,4.824,44.795,2.272,37.557,2.272z%20M46.129,20.557v13.085h-3.656v15.542h-9.944V33.643h-3.656V20.557%20c0-0.572,0.2-1.057,0.599-1.457c0.401-0.399,0.887-0.6,1.457-0.6h13.144c0.533,0,1.01,0.2,1.428,0.6%20C45.918,19.5,46.129,19.986,46.129,20.557z%20M33.042,12.329c0-3.008,1.485-4.514,4.458-4.514s4.457,1.504,4.457,4.514%20c0,2.971-1.486,4.457-4.457,4.457S33.042,15.3,33.042,12.329z'/%3e%3c/g%3e%3c/g%3e%3c/svg%3e)
1. Introduction
Heat transport by turbulent convection remains a pertinent area of research in both astrophysical and geophysical fluid dynamics. While boundary-forced thermal convection has been studied extensively, convection driven by internal heating has been relatively overlooked (Doering Reference Doering2020). Nevertheless, internally heated convection (IHC) plays a significant role within planetary bodies, such as in the Earth's mantle and core, where the radioactive decay of isotopes and secular cooling drive fluid motion (Schubert, Turcotte & Olson Reference Schubert, Turcotte and Olson2001; Schubert Reference Schubert2015). Similarly, for stars, convective zones are driven by radiation from nuclear fusion (Schumacher & Sreenivasan Reference Schumacher and Sreenivasan2020) and supernovae are modelled as fluids heated internally by neutrinos (Herant et al. Reference Herant, Benz, Hix, Fryer and Colgate1994; Radice et al. Reference Radice, Ott, Abdikamalov, Couch, Haas and Schnetter2016). Moreover, stars and planets are rotating bodies where the Coriolis force affects the flow dynamics significantly (Greenspan Reference Greenspan1968).
Studying rotating turbulent convection is challenging because experiments and numerical simulations cannot reach parameter values of interest (Glatzmaier Reference Glatzmaier2013). For example, in planetary mantles, the Prandtl number,  $Pr$, the non-dimensional number quantifying the ratio of the viscous and thermal diffusivity, reaches values of
 $10^{23}$, while the Rayleigh number,
 $R$, quantifying the ratio of thermal forcing to diffusion is at least
 $10^6$ (Mulyukova & Bercovici Reference Mulyukova and Bercovici2020). In planetary cores, the Rayleigh number could be as high as
 $10^{26}$ (Schubert Reference Schubert2015). Furthermore, the Ekman number,
 $E$, representing the viscous to rotational forces, is estimated to be
 $10^{-15}$ in the Earth's core (Jones & Schubert Reference Jones and Schubert2015).
An alternative route for inquiry is a mathematically rigorous study of the equations describing rotating convection. Of interest is the regime where the solutions of the governing equations are turbulent, and a key question is on the long-time behaviour of the mean quantities of the flow as a function of the control parameters ( $Pr, R, E$). In this study, we employ the background field method (Doering & Constantin Reference Doering and Constantin1992, Reference Doering and Constantin1994; Constantin & Doering Reference Constantin and Doering1995; Doering & Constantin Reference Doering and Constantin1996) to study the mean heat transport in IHC subject to rotation between parallel plates with isothermal and no-slip boundary conditions (figure 1). Unlike turbulent convection driven by boundary heating, i.e. Rayleigh–Bénard convection (RBC), there are no known rigorous results for turbulent IHC subject to rotation.
A non-dimensional schematic diagram for rotating uniform IHC. The upper and lower plates are at the same temperature, and the domain is periodic in the  $x$ and
 $y$ directions and rotates about the
 $z$ axis. Here
 ${\mathcal {F}}_B$ and
 ${\mathcal {F}}_T$ are the mean heat fluxes out the bottom and top plates,
 $\overline {{\langle {T} \rangle }}$ is the mean temperature and
 $g$ is the acceleration due to gravity.

The influence of rotation alters turbulent convection and introduces new flow regimes and physics (see Ecke & Shishkina Reference Ecke and Shishkina2023 for a recent review). The flow features of rotating convection in a plane layer driven by boundary heating are well documented (Veronis Reference Veronis1959; Chandrasekhar Reference Chandrasekhar1961; Rossby Reference Rossby1969; Julien et al. Reference Julien, Legg, McWilliams and Werne1996; Knobloch Reference Knobloch1998; Vorobieff & Ecke Reference Vorobieff and Ecke2002; Boubnov & Golitsyn Reference Boubnov and Golitsyn2012; Stevens et al. Reference Stevens, van der Poel, Grossmann and Lohse2013), and some insight exists for non-uniform IHC (Barker, Dempsey & Lithwick Reference Barker, Dempsey and Lithwick2014; Currie et al. Reference Currie, Barker, Lithwick and Browning2020; Hadjerci et al. Reference Hadjerci, Bouillaut, Miquel and Gallet2024). However, no study has explored the flow in rotating uniform IHC. The preceding studies show that rotation inhibits the onset of convective motion and stabilises the fluid, creating a bias in motion parallel to the axis of rotation. Further, an Ekman boundary layer exists, enhancing the mean vertical heat transport by Ekman pumping (Greenspan Reference Greenspan1968). With sufficient thermal forcing, the  $E-R$ parameter space contains two extreme flow states: if
 $R$ is sufficiently larger than
 $E^{-1}$, then buoyancy dominates and rotation plays little effect on the dynamics, whereas if
 $E^{-1}$ is large relative to
 $R$, and the vertical velocity is nonzero, geostrophic turbulence occurs (Julien et al. Reference Julien, Legg, McWilliams and Werne1996; Sprague et al. Reference Sprague, Julien, Knobloch and Werne2006). A wide range of flow features occurs in rotating convection including, cellular flows, Taylor columns, large-scale vortices and plume-dominated convection (Grooms et al. Reference Grooms, Julien, Weiss and Knobloch2010; Julien et al. Reference Julien, Rubio, Grooms and Knobloch2012; Stellmach et al. Reference Stellmach, Lischper, Julien, Vasil, Cheng, Ribeiro, King and Aurnou2014; Aurnou, Horn & Julien Reference Aurnou, Horn and Julien2020; Guzmán et al. Reference Guzmán, Madonia, Cheng, Ostilla-Mónico, Clercx and Kunnen2020; Kunnen Reference Kunnen2021; Song, Shishkina & Zhu Reference Song, Shishkina and Zhu2024).
In addition to experimental and numerical studies on rotating RBC, there exist proofs of bounds with the background field method, on the enhancement of heat transport due to convection, quantified with the Nusselt number,  $Nu$ (Constantin, Hallstrom & Putkaradze Reference Constantin, Hallstrom and Putkaradze1999; Constantin, Hallstrom & Poutkaradze Reference Constantin, Hallstrom and Poutkaradze2001; Doering & Constantin Reference Doering and Constantin2001; Yan Reference Yan2004; Grooms & Whitehead Reference Grooms and Whitehead2014; Pachev et al. Reference Pachev, Whitehead, Fantuzzi and Grooms2020). First introduced in the 1990s, the background field method provides a tool for proving bounds on the long-time averages of turbulence (Fantuzzi, Arslan & Wynn Reference Fantuzzi, Arslan and Wynn2022). In its original formulation, the idea involves decomposing the flow variables into a fluctuating and background component satisfying the boundary conditions to construct a variational problem for bounding the turbulent dissipation. A bound is proven by solving the variational problem by choosing an appropriate background field and using elementary integral estimates. The method has been used successfully for many fluid flows, none more so than turbulent convection (Nobili Reference Nobili2023). Recent insight has shown that the background field method fits within the framework of the auxiliary functional method (Chernyshenko et al. Reference Chernyshenko, Goulart, Huang and Papachristodoulou2014; Chernyshenko Reference Chernyshenko2022), which can yield sharp bounds for well-posed ordinary differential equations (ODEs) and partial differential equation (PDEs) under technical conditions (Tobasco, Goluskin & Doering Reference Tobasco, Goluskin and Doering2018; Rosa & Temam Reference Rosa and Temam2022).
A fundamental feature of the background field method is to work with energy balances from the governing equations. However, energy identities fail to capture the effects of rotation, apart from in the case of a fluid driven by rotating boundaries, like in Taylor–Couette flow (Constantin Reference Constantin1994; Ding & Marensi Reference Ding and Marensi2019; Kumar Reference Kumar2022). For convection subject to the Coriolis force, standard applications of the background field method do not give a bound on  $Nu$ that depends on
 $E$. One path for progress is in the limit of infinite
 $Pr$, where the momentum equation simplifies to a forced Stokes flow, leading to a diagnostic equation between the velocity and temperature, facilitating better estimates. Notably, without rotation (
 $E=\infty$), using the background field method, it was proven, up to constants and logarithms, that
 $Nu\leq Ra^{1/3}$ (Doering, Otto & Reznikoff Reference Doering, Otto and Reznikoff2006), where
 $Ra$ is the Rayleigh number based upon the temperature difference between the boundaries, improving on the bound of
 $Nu\leq Ra^{1/2}$ valid at arbitrary
 $Pr$ (Doering & Constantin Reference Doering and Constantin1996). Under rotation (
 $E<\infty$) at
 $Pr=\infty$, established results for RBC are illustrated in figure 2.
Illustration of the upper bounds with blue lines on the Nusselt number,  $Nu$, in terms of the Rayleigh,
 $Ra$, and Ekman numbers,
 $E$, for infinite Prandtl number rotating RBC, between no-slip boundaries. All bounds hold up to constants that determine the exact sizes of the regions and where applicable red text shows the stress-free result in the same region. The bounds in
 $A$ are due to Constantin et al. (Reference Constantin, Hallstrom and Putkaradze1999). The green dashed line crossing
 $A$ and
 $B$ shows the upper bound obtained from the non-hydrostatic quasigeostrophic approximation (Grooms & Whitehead Reference Grooms and Whitehead2014; Pachev et al. Reference Pachev, Whitehead, Fantuzzi and Grooms2020). In
 $B$, the crossover from the bound
 $Ra^{2/5}$ (Doering & Constantin Reference Doering and Constantin2001) to
 $Ra^{4/11}(E^{-1}+1)^{4/11}$ (Yan Reference Yan2004) is shown by a blue circle. Similarly in region
 $C$ the crossover from
 $Ra^{4/11}$ (Yan Reference Yan2004) to
 $E^{-4/5} Ra^{1/5}$ (Constantin et al. Reference Constantin, Hallstrom and Poutkaradze2001) is shown by a blue square. Region
 $D$ shows the bounds for buoyancy-driven convection (Otto & Seis Reference Otto and Seis2011; Whitehead & Doering Reference Whitehead and Doering2011b). The transition from
 $C$ to
 $D$ is continuous up to logarithmic corrections (Constantin et al. Reference Constantin, Hallstrom and Putkaradze1999).

High  $Pr$ restricts the parameter space when modelling fluid flows. However, proving bounds in the limit of
 $Pr=\infty$ can be viewed as a first step towards establishing bounds valid for all
 $Pr$. Recent studies suggest that for any bound proven at infinite
 $Pr$ in rotating RBC, a semi-analytic bound for finite
 $Pr$ can be obtained under specific conditions (Tilgner Reference Tilgner2022). The results in Tilgner (Reference Tilgner2022) indicate that the bounds for finite
 $Pr$ are, to highest order, equivalent to the infinite
 $Pr$ results of figure 2, with
 $Ra, Pr$ and
 $E$ corrections. The result is unsurprising since bounds at infinite
 $Pr$ generally improve those obtained for finite
 $Pr$. At the level of the dynamical system, this can be understood as a consequence of the relative ease with which information is extracted from the turbulent attractor of infinite
 $Pr$ system by bounding methods (Wang Reference Wang2007).
When rotation dominates over buoyancy, heuristic arguments for RBC suggest that  $Nu \sim E^{3/2} Ra^2$, at arbitrary
 $Pr$ (King, Stellmach & Buffett Reference King, Stellmach and Buffett2013; Plumley & Julien Reference Plumley and Julien2019; Aurnou et al. Reference Aurnou, Horn and Julien2020). Bounds that scale similarly to the physical arguments in the rapidly rotating regime can be proven when working with an asymptotic approximation of the governing equations known as the non-hydrostatic quasigeostrophic (nhQG) equations (Julien et al. Reference Julien, Legg, McWilliams and Werne1996, Reference Julien, Aurnou, Calkins, Knobloch, Marti, Stellmach and Vasil2016). Scaling the horizontal length scales by
 $E^{1/3}$ and adjusting the time variable yields the nhQG equations that model the limit of rapidly rotating convection in a plane layer. Applying the background field method to the nhQG equations gives the green bounds in figure 2 of, up to constants,
 $Nu\leq E^2 Ra^2$, for no-slip conditions (Pachev et al. Reference Pachev, Whitehead, Fantuzzi and Grooms2020) and
 $Nu \leq E^4 Ra^3$ for stress-free boundaries (Grooms & Whitehead Reference Grooms and Whitehead2014).
IHC remains less studied in part due to significant differences in the physics between RBC. Notably, in uniform IHC between isothermal boundaries, the mean conductive heat flux is zero, rendering the standard definition of the Nusselt number inapplicable (Goluskin Reference Goluskin2015). In previous works with zero rotation (Goluskin Reference Goluskin2015), an alternative measure of the turbulent convection is the non-dimensionalised mean temperature,  $\overline {{\langle {T} \rangle }}$, where angled brackets
 $\langle {\cdot } \rangle$ denote a volume and overbars denote a long-time average. As the flow becomes increasingly turbulent, the temperature within the domain becomes homogenised, quantified in a lower value of
 $\overline {{\langle {T} \rangle }}$ and a higher proxy Nusselt number defined as
 $Nu_p = 1/\overline {{\langle {T} \rangle }}$. An additional measure of turbulence is
 $\overline {{\langle {wT} \rangle }}$, quantifying the portion of heat leaving through each boundary,
 ${\mathcal {F}}_T$ and
 ${\mathcal {F}}_B$, due to convection (Goluskin & Spiegel Reference Goluskin and Spiegel2012). For a stationary fluid, the heat supplied leaves the domain symmetrically out of both boundaries to ensure the statistical stationarity of the solutions. As the thermal forcing increases, convection carries heat upwards, causing a higher portion of the heat to leave through the top relative to the bottom boundary (Goluskin & van der Poel Reference Goluskin and van der Poel2016).
In line with previous works on uniform IHC (Goluskin Reference Goluskin2015; Arslan et al. Reference Arslan, Fantuzzi, Craske and Wynn2021a,Reference Arslan, Fantuzzi, Craske and Wynnb; Kumar et al. Reference Kumar, Arslan, Fantuzzi, Craske and Wynn2022; Arslan et al. Reference Arslan, Fantuzzi, Craske and Wynn2023; Arslan & Rojas Reference Arslan and Rojas2024), the non-dimensional heat flux out of the top and bottom boundaries is given by
 \begin{equation} {\mathcal{F}}_T :={-}\overline{{\langle {\partial_zT} \rangle}}_h\vert_{z=1} = \tfrac12 + \overline{{\langle {wT} \rangle}}, \end{equation}
and
 \begin{equation} {\mathcal{F}}_B := \overline{{\langle {\partial_z T} \rangle}}_h\vert_{z=0} = \tfrac12 - \overline{{\langle {wT} \rangle}}. \end{equation}
The non-dimensionalisation sets the limits of  $\overline {{\langle {wT} \rangle }}$ as
 $0$ and
 $\tfrac 12$, with each limit corresponding to no convection and infinitely effective convection, respectively. We seek bounds of the form
 ${\mathcal {F}}_B \geq f_1(R,E)$ and
 $\overline {{\langle {T} \rangle }}\geq f_2(R,E)$ in different regions of
 $E$–
 $R$ space, where
 $f_1$ and
 $f_2$ are functions of only
 $R$ and
 $E$. In previous applications of the background field method to IHC, bounds for
 $\overline {{\langle {T} \rangle }}$ are proven with minor adaptation from the background field method as applied to RBC (Lu, Doering & Busse Reference Lu, Doering and Busse2004; Whitehead & Doering Reference Whitehead and Doering2011a, Reference Whitehead and Doering2012). However, in the case of obtaining bounds on
 $\overline {{\langle {wT} \rangle }}$ and consequently
 ${\mathcal {F}}_B$, it has been established that the variational problem requires a minimum principle on
 $T$, which states that temperature in the domain is greater than or equal to zero (Arslan et al. Reference Arslan, Fantuzzi, Craske and Wynn2021b). The minimum principle is necessary to obtain lower bounds on
 ${\mathcal {F}}_B$ that remain positive as
 $R$ increases. In the case of no rotation at
 $Pr=\infty$, the best-known lower bound on the mean temperature, up to constants, are
 $\overline {{\langle {T} \rangle }}\geq (R\ln {R})^{-1/4}$ (Whitehead & Doering Reference Whitehead and Doering2011a) and
 $\overline {{\langle {T} \rangle }} \geq R^{-5/17}$ (Whitehead & Doering Reference Whitehead and Doering2012) for no-slip and stress-free boundaries. Conversely, the best-known lower bounds on the heat flux out of the domain are
 ${\mathcal {F}}_B \geq R^{-2/3} + R^{-1/2}|\ln {(1-R^{-1/3})}|$ and
 ${\mathcal {F}}_B \geq R^{-40/29} + R^{-35/29} |\ln {(1-R^{-10/29})}|$ (Arslan & Rojas Reference Arslan and Rojas2024) for the two different kinematic boundary conditions.
In this paper, the bounds we prove for uniform IHC subject to rotation at an infinite Prandtl number are summarised in table 1.
Summary of the lower bounds on  ${\mathcal {F}}_B$ and
 $\overline {{\langle {T} \rangle }}$ proven in this work. The constants in the bounds are collated in Appendix A for brevity, while
 $E_0 = 5.4927$,
 $E_1=8$ and
 $E_m = 41.4487$. Region I corresponds to buoyancy-dominated convection, region II corresponds to solid body rotation, region III corresponds to buoyancy or rotation-dominated convection and region IV corresponds to rotation-dominated convection provided
 $R>R_L(E)$ where
 $R_L$ is the value of
 $R$ above which the system is linearly unstable.

For notation,  $\lVert\;f \rVert _p^p = \int ^{1}_0 f^p \,\textrm {d}z$, for
 $p<\infty$ and
 $\lVert f \rVert _\infty = \operatorname {ess\,sup}_{z\in [0,1]} f$ for
 $p=\infty$, represents the standard
 $L^p$ norms of
 $f:[0,1] \rightarrow \mathbb {R}$. The use of
 $\lesssim$ or
 $\gtrsim$ indicates equality up to an independent constant. This paper is structured as follows. In § 2, we describe the problem set-up before discussing the onset of convection in § 3. Then Appendix B proposes heuristic scaling arguments for rotating IHC before we prove bounds on
 ${\mathcal {F}}_B$ in § 4 and on
 $\overline {{\langle {T} \rangle }}$ in § 5. Finally, § 6 offers a brief discussion and concluding remarks.
2. Set-up
We consider a layer of fluid in a rotating frame of reference between two horizontal plates separated by a distance  $d$ and periodic in the horizontal (
 $x$ and
 $y$) directions with periods
 $L_x d$ and
 $L_y d$. The fluid has kinematic viscosity
 $\nu$, thermal diffusivity
 $\kappa$, density
 $\rho$, specific heat capacity
 $c_p$ and thermal expansion coefficient
 $\alpha$. Gravity acts in the negative vertical direction with strength
 $g$, the fluid rotates at rate
 $\varOmega$ and is uniformly heated internally at a volumetric rate
 $H$.
To non-dimensionalise the problem, we use  $d$ as the characteristic length scale,
 $d^2/\kappa$ as the time scale and
 $d^2 H/\kappa \rho c_p$ as the temperature scale (Roberts Reference Roberts1967). The velocity of the fluid
 $\boldsymbol {u}(\boldsymbol {x},t) =u(\boldsymbol {x},t)\boldsymbol {e}_1 + v(\boldsymbol {x},t)\boldsymbol {e}_2 + w(\boldsymbol {x},t)\boldsymbol {e}_3$ and temperature
 $T(\boldsymbol {x},t)$ in the non-dimensional domain
 $V = [0,L_x]\times [0,L_y]\times [0,1]$ are governed by the infinite Prandtl number Boussinesq equations,
 $$\begin{gather} \boldsymbol{\nabla} \boldsymbol{\cdot} \boldsymbol{u} = 0, \end{gather}$$
 $$\begin{gather}\boldsymbol{\nabla} p + E^{{-}1} \boldsymbol{e}_3 \times \boldsymbol{u} = \nabla^2 \boldsymbol{u} + RT \boldsymbol{e}_3, \end{gather}$$
 $$\begin{gather}\partial_t T + \boldsymbol{u}\boldsymbol{\cdot} \boldsymbol{\nabla} T = \nabla^2 T + 1. \end{gather}$$
The non-dimensional numbers are the Ekman and Rayleigh numbers, defined as
 \begin{equation} E = \frac{\nu}{2\varOmega d^2} \quad\text{and}\quad R = \frac{g \alpha H d^5 }{\rho c_p \nu \kappa^2 }. \end{equation}
The boundary conditions are of no-slip and isothermal temperature, respectively:
 $$\begin{gather} \boldsymbol{u}|_{z=\{0,1\}} = 0, \end{gather}$$
 $$\begin{gather}T|_{z=\{0,1\}} = 0. \end{gather}$$
Figure 1 provides a schematic for the system under consideration. The vertical component of the curl and double curl of (2.1b) gives a diagnostic equation involving the vertical velocity  $w$, the vertical vorticity
 $\zeta$ and temperature
 $T$:
 $$\begin{gather} \nabla^4 w = E^{{-}1} \partial_z \zeta -R \varDelta_h T, \end{gather}$$
 $$\begin{gather}\nabla^2 \zeta ={-} E^{{-}1} \partial_z w, \end{gather}$$
where  $\varDelta _h=\partial ^2_x + \partial ^2_y$ is the horizontal Laplacian.
The final ingredients are results from Yan (Reference Yan2004) and Constantin et al. (Reference Constantin, Hallstrom and Putkaradze1999) and a minimum principle on  $T$. We state the results as separate lemmas.
Lemma 2.1 (Minimum principle)
Suppose  $T(\boldsymbol {x},t)$ solves (2.1c) subject to (2.3b) where
 $\boldsymbol {u}$ satisfies
 $\boldsymbol {\nabla }\boldsymbol {\cdot } \boldsymbol {u}=0$ and (2.3a). Let the negative parts of
 $T(\boldsymbol {x},t)$ be
 \begin{equation} T_-(\boldsymbol{x},t) := \max\{{-}T(\boldsymbol{x},t),0\}. \end{equation}
Then
 \begin{equation} \langle |T_-(\boldsymbol{x},t)|^2 \rangle \leq \langle |T_{-}(\boldsymbol{x},0)|^2 \rangle \exp{(-\mu t)}, \end{equation}
for some  $\mu > 0$. In particular, if
 $T(\boldsymbol {x},0) > 0$, then
 $T_{-}(\boldsymbol {x},0)=0$ and
 $T(\boldsymbol {x},t)\geq 0 \enspace \forall t$.
See Appendix A of Arslan et al. (Reference Arslan, Fantuzzi, Craske and Wynn2021b) for a proof.
Lemma 2.2 (Yan (Reference Yan2004))
Let  $w_{\boldsymbol {k}},T_{\boldsymbol {k}}:(0,1) \rightarrow \mathbb {R}$, be the Fourier transforms of the vertical velocity
 $w$ and temperature
 $T$ with wavenumber
 $\boldsymbol {k} = (k_x, k_y)$ satisfying (2.4) and
 $\boldsymbol {\nabla } \boldsymbol {\cdot } \boldsymbol {u}=0$, subject to the velocity boundary conditions (2.3a). Then we have the following.
• For
 $|\boldsymbol {k}|\leq 1$
(2.7)where\begin{equation} \lVert w''_{\boldsymbol{k}} \rVert_\infty \leq c_1 R (1+ \tfrac14 E^{{-}2})^{1/4} \lVert T_{\boldsymbol{k}} \rVert_2, \end{equation}$c_1 = 6^{1/4}$.
• For
$|\boldsymbol {k}| \geq 1$
(2.8)where\begin{equation} \lVert w''_{\boldsymbol{k}} \rVert_\infty \leq c_2 R \sqrt{\boldsymbol{k}} \lVert T_{\boldsymbol{k}} \rVert_2 + c_2 R E^{{-}1} \lVert T_{\boldsymbol{k}} \rVert_2, \end{equation}$c_2 = 1 + ({(e^2 + 1)}/{(e^2 - 1)})({(4\cosh {1} + 2\sinh {1})}/{(-1 +\sinh {1})}) \sim 64.8734$.


Lemma 2.3 (Constantin et al. (Reference Constantin, Hallstrom and Putkaradze1999))
Let  $w,T: V \rightarrow \mathbb {R}$ be horizontally periodic functions such that they solve (2.4) subject to
 $\boldsymbol {\nabla } \boldsymbol {\cdot } \boldsymbol {u}=0$ and the boundary conditions (2.3a), then
 \begin{equation} \langle |\nabla^2 w|^2 \rangle + 2 \langle |\boldsymbol{\nabla} \zeta|^2 \rangle \leq R^2 \langle |T|^2 \rangle. \end{equation}
3. Onset of convection
Before proving bounds on the emergent properties of the turbulence ( ${\mathcal {F}}_B$ and
 $\overline {{\langle {T} \rangle }}$), we briefly discuss the onset of convection for (2.1). The trivial solution of (2.1) is found by taking
 $\boldsymbol {u}=0$ and considering a steady state where the temperature is independent of time. The conductive temperature profile,
 \begin{equation} T_c = \tfrac12 z(1-z), \end{equation}
represents the transport of heat by conduction alone. In the case where there is no rotation ( $E=\infty$) for the boundary conditions in (2.3), the system becomes linearly unstable for all
 $R> 37\,325.2$ (Goluskin Reference Goluskin2015). However, unlike RBC when considering (2.1) in the form
 \begin{equation} \frac{\textrm{d}\boldsymbol{s}}{\textrm{d}t} + {\mathcal{L}} \boldsymbol{s} + {\mathcal{N}}(\boldsymbol{s},\boldsymbol{s}) + {\mathcal{P}}p = 0, \end{equation}
where  ${\mathcal {L}}$ and
 ${\mathcal {P}}$ are linear operators,
 ${\mathcal {N}}$ is a bilinear operator and
 $\boldsymbol {s} = (\boldsymbol {u},T)$ is the state vector, the linear operator
 ${\mathcal {L}}$ of (2.1) has a non-zero skew-symmetric component and nonlinear instability can occur at
 $R = 26\,926.6$, implying that subcritical convection can occur for IHC (Straughan Reference Straughan2013; Goluskin Reference Goluskin2015). For
 $E < \infty$, rotation stabilises the system to vertical motion and inhibits the onset of convection. For the case of RBC, the effect of rotation on the onset of convection is well quantified (Chandrasekhar Reference Chandrasekhar1961). In this section, we demonstrate a result for the effect of rotation on the Rayleigh number for linear instability,
 $R_L$, in IHC.
3.1. Linear stability
The Rayleigh number up to which the flow is linearly stable is identified by analysing the evolution of perturbations from the linearised system of (2.1). In the non-rotating case, for selected thermal boundary conditions, the marginally stable states are stationary (Davis Reference Davis1969; Herron Reference Herron2003). When the flow is subject to rotation, the condition for steady rolls, as opposed to oscillatory-in-time rolls, at the onset of convection is unknown. For comparison, in the case of RBC, the onset modes are steady provided  $Pr \geq 0.68$, such that assuming a sufficiently large
 $Pr$ fluid removes the question of oscillatory motion in the analysis we carry out here. The precise structure of the motion at the onset should not affect the asymptotic behaviour of
 $R_L$ for a small Ekman number. It is noteworthy that in the case of the rotating internally heated fluid sphere, the first convective modes are always unsteady (Roberts Reference Roberts1968; Busse Reference Busse1970; Jones, Soward & Mussa Reference Jones, Soward and Mussa2000) and recent evidence from numerical simulations confirms the existence subcritical convection (Guervilly & Cardin Reference Guervilly and Cardin2016; Kaplan et al. Reference Kaplan, Schaeffer, Vidal and Cardin2017).
Taking the set-up as described in § 2, we start by decomposing the temperature field into perturbations from the conductive profile  $T_c(z)$,
 \begin{equation} T(\boldsymbol{x},t) = \vartheta(\boldsymbol{x},t) + T_c(z), \end{equation}
to obtain the temperature perturbation,  $\vartheta$ equation from (2.1c) and boundary conditions of
 $$\begin{gather} \partial_t \vartheta + \boldsymbol{u}\boldsymbol{\cdot}\boldsymbol{\nabla} \vartheta = \nabla^2 \vartheta + T_c' w, \end{gather}$$
 $$\begin{gather}\vartheta|_{z=\{0,1\}} = 0, \end{gather}$$
where primes denote derivative with respect to  $z$. Then, we look at the marginally stable stationary states of the linearised system of (2.1) by considering the
 $z$ component of the double curl of the momentum equation and the vertical component of the vorticity equation; we thus have
 $$\begin{gather} \nabla^4 w = E^{{-}1}\partial_z \zeta - R \nabla_H^2 \vartheta , \end{gather}$$
 $$\begin{gather}\nabla^2 \zeta ={-} E^{{-}1} \partial_z w, \end{gather}$$
 $$\begin{gather}\nabla^2 \vartheta = T_c' w. \end{gather}$$
Given horizontal periodicity, we take a Fourier series expansion in the horizontal ( $x$ and
 $y$) directions of the form,
 \begin{equation} \begin{bmatrix} \vartheta(x,y,z)\\ \boldsymbol{u}(x,y,z) \\ \zeta(x,y,z) \end{bmatrix}= \sum_{\boldsymbol{k}} \begin{bmatrix} \vartheta_{\boldsymbol{k}}(z)\\ \boldsymbol{u}_{\boldsymbol{k}}(z) \\ \zeta_{\boldsymbol{k}}(z) \end{bmatrix} \textrm{e}^{{\rm i}(k_x x + k_y y)}, \end{equation}
where the sum is over wavevectors  $\boldsymbol {k} = (k_x,k_y)$ with magnitude
 $k = \sqrt {k_x^2 + k_y^2}$ and variables with subscripts
 $\boldsymbol {k}$ are functions of
 $z$ only. Then, substituting (3.6) into (3.5) gives
 $$\begin{gather} (D^2 - k^2)^2 w_{\boldsymbol{k}} = E^{{-}1} \zeta'_{\boldsymbol{k}} + R k^2 \vartheta_{\boldsymbol{k}} , \end{gather}$$
 $$\begin{gather}(D^2 - k^2) \zeta_{\boldsymbol{k}} ={-} E^{{-}1} w'_{\boldsymbol{k}}, \end{gather}$$
 $$\begin{gather}(D^2 - k^2) \vartheta_{\boldsymbol{k}} = T_c' w_{\boldsymbol{k}}, \end{gather}$$
where  $D^2 = {\textrm {d}^2}/{\textrm {d}z^2}$. For no-slip or stress-free boundary conditions,
 $\zeta _{\boldsymbol {k}}$ and
 $\vartheta _{\boldsymbol {k}}$ can be eliminated from (3.7) to give
 \begin{equation} (D^2 - k^2)^3 w_{\boldsymbol{k}} + E^{{-}2} w''_{\boldsymbol{k}} = Rk^2 T_c' w_{\boldsymbol{k}}. \end{equation}
Here, (3.8) is an eigenvalue problem and can be solved numerically by fixing  $E$ and finding the
 $R$ at which the first eigenvalue changes sign. The equivalent problem for RBC is well documented (Chandrasekhar Reference Chandrasekhar1961), however unlike RBC, the ODE in (3.8) admits solutions which are hypergeometric functions because
 $T_c$ in (3.1) is a non-constant function. As such, even in the case of stress-free boundary conditions where
 $w_{\boldsymbol {k}} = w''_{\boldsymbol {k}} = w''''_{\boldsymbol {k}} = 0$ at both boundaries, (3.8) becomes complicated to solve. Instead, we consider the asymptotic regime of small
 $E$ where a simplified form of (3.8) gives the desired asymptotic relation between
 $R_L$ and
 $E$. Following the argument first presented in Chandrasekhar (Reference Chandrasekhar1961), we posit that for
 $R$ close to
 $R_L$, the wavenumber
 $k$ tends to infinity so that we retain only terms in
 $E$,
 $R$ and the highest power in
 $k$ and (3.8) becomes
 \begin{equation} E^{{-}2} w''_{\boldsymbol{k}} = k^2(R(\tfrac12 - z ) + k^4) w_{\boldsymbol{k}}. \end{equation}
Since (3.9) is of second order, we require only two boundary conditions. However, in the simplest set of boundary conditions of stress-free boundaries where  $w_{\boldsymbol {k}}$ and
 $w_{\boldsymbol {k}}''$ are zero, the problem is over-determined with four boundary conditions. It suffices to take
 $w_{\boldsymbol {k}}(0)=w''_{\boldsymbol {k}}(0) = 0$, such that we can make the ansätz that
 \begin{equation} w_{\boldsymbol{k}} = Ai(n -mz) - \frac{Ai(n)}{Bi(n)} Bi(n - m z), \end{equation}
where  $Ai(z)$ and
 $Bi(z)$ are the Airy functions of the first and second kind. Substituting (3.10) back into (3.9) gives
 \begin{equation} E^{{-}2}m^2(n-m z) = \tfrac12 k^2 R + k^6 - k^2 R z, \end{equation}
from which we require the choice that  $m = (k^2 R E^2)^{1/3}$. Substituting for
 $m$ and rearranging, we obtain
 \begin{equation} -\tfrac12 E^{2/3} k^{2/3} R + n R^{2/3} -E^{2/3} k^{ 14/3 } = 0. \end{equation}
Given that (3.12) is a cubic equation in  $R^{1/3}$, by application of the cubic formula, we find the real root to be
 \begin{align} R_L^{1/3} &= \frac{2 n}{3
E^{ 2/3 } k^{2/3}} + \frac{1}{3E^{2/3} k^{2/3}}
\left({-}8n^3 + 27 E^2 k^6 + 27 E^2 k^3 \sqrt{k^{6} -
\frac{16n^3}{27 E^2}}\, \right)^{1/3} \nonumber\\ &\quad +
\frac{4n^2}{3 E^{2/3} k^{2/3} } \left({-}8n^3 + 27 E^2 k^6
+ 27 E^2 k^3 \sqrt{k^{6} - \frac{16n^3}{27 E^2}}\,
\right)^{{-}1/3}. \end{align}
Then, we want to find the smallest possible  $R_L$ in (3.13) by finding the minimising
 $k$ by solving
 $\partial _k R_L^{1/3} = 0$ and substituting back into (3.13) to obtain
 $R_L$ as a function of only
 $E$. In figure 3 we plot
 $R_L$ from (3.13) against
 $k$ for a wide range of
 $E$ (
 $10^{-37}$ to
 $10^{-13}$), highlighting the minimum in
 $k$ found. The inset in figure 3 demonstrates that the
 $k_m$ varies as
 $E^{-1/3}$. Given figure 3, and noting that in the asymptotic limit of small
 $E$ we assume large wavenumbers
 $k$, it is natural in (3.13) to take the minimising wavenumber to be
 \begin{equation} k_m^6 = \frac{16n^3}{27E^2}, \end{equation}
such that the terms in the cube roots are real and positive. Then, substituting  $k_m$ back into (3.13) and the minimal
 $R_L(n,E)$ is achieved with
 $n=1$, such that (3.13) simplifies to
 \begin{equation} R_L = \frac{(1+2^{2/3}+2^{4/3})^3}{9\cdot 2^{1/3}} E^{{-}4/3} \sim E^{{-}4/3}. \end{equation}
The asymptotic scaling is equivalent to rotating RBC, unsurprising given the equivalence of the momentum equations, albeit with different prefactors, and highlights the inhibiting effect of rotation on the Rayleigh number for the system to become linearly unstable. In the rest of the paper, we use (3.15) to arrive at heuristic scaling arguments and later contextualise the bounds proven.
Plot of  $R_L$ against
 $k$ as given by (3.13) for Ekman numbers ranging from
 $10^{-37}$ (red) to
 $10^{-13}$ (yellow). The blue dots represent the minimum
 $R_L$ in
 $k$, and the inset demonstrates that the minimum wavenumber
 $k_m$ varies as
 $E^{-1/3}$ with a compensated plot.

4. Bounds on the heat flux out of the domain
In this section, we present proofs of the bounds in (1) on  ${\mathcal {F}}_B$ as defined by (1.1). To obtain a lower bound on
 ${\mathcal {F}}_B$, we prove upper bounds on
 $\overline {{\langle {wT} \rangle }}$ by the background field method in the framework of auxiliary functionals (Arslan et al. Reference Arslan, Fantuzzi, Craske and Wynn2023). First, in § 4.1, we derive the variational problem for finding
 $U$ where
 $\overline {{\langle {wT} \rangle }}\leq U$. In § 4.2, we outline the preliminary choices that are made for the proofs and in § 4.3, estimate the upper bound on
 $\overline {{\langle {wT} \rangle }}$. Then, we first prove a bound on
 $\overline {{\langle {wT} \rangle }}$ valid for large Ekman numbers
 $E$ in § 4.4 by the use of Lemma 2.2, followed by a proof valid for small
 $E$ in § 4.5 by using Lemma 2.3. To provide an overview, figure 4 illustrates the lower bounds on
 ${\mathcal {F}}_B$, omitting the logarithmic corrections for brevity.
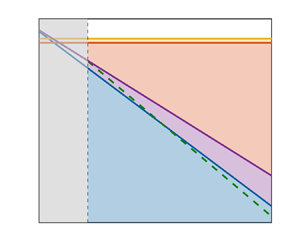
Illustrations of the lower bounds on the flux out of the bottom boundary,  ${\mathcal {F}}_B$, between no-slip and isothermal boundary conditions at infinite
 $Pr$, the logarithmic corrections in the bounds, table 1, are suppressed for brevity. The blue plot is the bound derived in § 4.4, valid up to
 $E =E_m\sim 41.4487$ and
 $E_0 = 4.1688$. The bound derived in § 4.5 is shown with a green dashed line. The dashed horizontal line denotes when all heat transport is by conduction and
 ${\mathcal {F}}_B=\frac 12$. In
 $D$, we show the bounds for stress-free (top, red) and no-slip (bottom, blue) at zero rotation (Arslan & Rojas Reference Arslan and Rojas2024).

4.1. The auxiliary functional method
Here, we outline the main steps in constructing the variational problem to obtain an upper bound on  $\overline {{\langle {wT} \rangle }}$. See previous works for a detailed derivation (Arslan et al. Reference Arslan, Fantuzzi, Craske and Wynn2021b, Reference Arslan, Fantuzzi, Craske and Wynn2023). To prove an upper bound on
 $\smash {\overline {{\langle {wT} \rangle }}}$, we employ the auxiliary function method (Chernyshenko et al. Reference Chernyshenko, Goulart, Huang and Papachristodoulou2014; Fantuzzi et al. Reference Fantuzzi, Arslan and Wynn2022). The method relies on the observation that the time derivative of any bounded and differentiable functional
 ${\mathcal {V}}\{T(t)\}$ along solutions of the Boussinesq equations (2.1) averages to zero over infinite time, so that
 \begin{equation} \overline{{\langle {wT} \rangle}} = \overline{\langle wT \rangle + \frac{\rm d}{ {\rm d} t}{\mathcal{V}}\{T(t)\} }. \end{equation}
Two key simplifications follow. The first is that we can estimate (4.1) by the pointwise-in-time maximum along the solutions of the governing equations, and this value is estimated by the maximum it can take over all velocity and temperature fields that are periodic in  $x$ and
 $y$, satisfying incompressibility (2.1a), the boundary conditions (2.3) and the maximum principle Lemma 2.1.
We restrict our attention to quadratic functionals taking the form
 \begin{equation} {\mathcal{V}}\{T\}: = \left\langle \frac{\beta}{2} |T|^2 - [\tau(z)+z-1] T \right\rangle, \end{equation}
that are parametrised by a positive constant  $\beta > 0$, referred to as the balance parameter and a piecewise-differentiable function
 $\tau :[0,1] \to \mathbb {R}$ with a square-integrable derivative that we call the background temperature field. Here
 $\tau (z)$ satisfies
 \begin{equation} \tau(0)=1, \quad \tau(1)=0. \end{equation}
Introducing a constant,  $U$, and rearranging, (4.1) can be written as
 \begin{equation} \overline{{\langle {wT} \rangle}} \leq U - U + \langle wT \rangle + \frac{\textrm{d}}{\textrm{d}t}{\mathcal{V}}\{T\} \leq U, \end{equation}
where the final inequality holds given that,  $U - \langle wT \rangle - ({\textrm {d}}/{\textrm {d}t}){\mathcal {V}}\{T\} \geq 0$, where we can substitute for the Lie derivative of
 ${\mathcal {V}}\{T\}$ by using (2.1c). However, the minimum principle, Lemma 2.1, is necessary to obtain an
 $R$-dependent bound on
 $\overline {{\langle {wT} \rangle }}$ that approaches
 $\tfrac 12$ from below as
 $R$ increases. The condition is enforced with a Lagrange multiplier,
 $\lambda (z)$, so that the problem statement after computations as outlined in previous work (Arslan et al. Reference Arslan, Fantuzzi, Craske and Wynn2021b, Reference Arslan, Fantuzzi, Craske and Wynn2023) becomes
 \begin{equation} \overline{{\langle {wT} \rangle}} \leq \inf_{U,\beta,\tau(z),\lambda(z)} \{U \,|\, {\mathcal{S}}\{\boldsymbol{u},T\} \geq 0 \enspace \forall(\boldsymbol{u},T) \in {\mathcal{H}}_+ \}, \end{equation}
where
 \begin{equation} {\mathcal{H}}_+= \{(\boldsymbol{u},T)\,| \,\text{horizontally periodic},\boldsymbol{\nabla} \boldsymbol{\cdot} \boldsymbol{u}=0, (2.3a), (2.4a), T(\boldsymbol{x})\geq 0\ \text{a.e.}\ \boldsymbol{x}\in V \}, \end{equation}
provided  $\lambda (z)$ is a non-decreasing function, and
 \begin{equation} {\mathcal{S}}\{\boldsymbol{u},T\} := \langle \beta|\boldsymbol{\nabla} T|^2 + \tau'(z) wT + (\beta z - \tau'(z) + \lambda(z))\partial_z T + \tau(z)+ U \rangle - \tfrac12. \end{equation}
Ensuring the positivity of the quadratic terms in (4.7) is referred to as the spectral constraint and is defined as
 \begin{equation} \langle \beta|\boldsymbol{\nabla} T|^2 + \tau'(z) wT \rangle \geq 0, \end{equation}
where  $w$ and
 $T$ are related by (2.4) and subject to the boundary conditions (2.3). As has been established previously (Arslan et al. Reference Arslan, Fantuzzi, Craske and Wynn2023), provided the spectral constraint is satisfied, then the non-negativity of
 ${\mathcal {S}}\{\boldsymbol {u},T\}$ is ensured when
 $U$ is given by
 \begin{equation} \overline{{\langle {wT} \rangle}} \leq U :=\frac12 + \inf_{\substack{ \lambda \in L^{2}(0,1)\\ \lambda\ \mbox{non-decreasing} \\ \langle \lambda \rangle={-}1}} \left\langle \frac{1}{4\beta} \left|\beta\left(z-\frac12\right) - \tau'(z)+\lambda(z) \right|^2 - \tau(z) \right\rangle. \end{equation}
4.2. Preliminaries
To establish a bound on  $\overline {{\langle {wT} \rangle }}$, we state the main choices used in the proof that minimise
 $U(\beta,\tau,\lambda )$ as defined in (4.9). We make the following choice of background temperature field,
 \begin{equation} \tau(z):=\begin{cases} 1- \dfrac{1-a}{\delta}z, & 0 \leq z \leq \delta, \\ a, & \delta \leq z \leq 1- \varepsilon, \\ \dfrac{a(1-\varepsilon)}{\varepsilon} \left(\dfrac{1-z}{z}\right), & 1-\varepsilon \leq z \leq 1, \end{cases} \end{equation}
and set  $\lambda (z)$ to be
 \begin{equation} \lambda(z):=\begin{cases} -\dfrac{1-a}{\delta}, & 0 \leq z \leq \delta, \\ -\dfrac{a}{1-\delta}, & \delta \leq z \leq 1. \end{cases} \end{equation}
The piecewise functions  $\tau (z)$ and
 $\lambda (z)$ are quantified by the boundary layer widths
 $\delta \in (0,\tfrac 13)$ and
 $\varepsilon \in (0,\tfrac 13)$, where
 $\delta \leq \varepsilon$, and parameter
 $a>0$ that determines the value of
 $\tau (z)$ in the bulk. See figure 5 for a sketch of the functions.


We further fix
 \begin{equation} a = \tfrac12 \delta \varepsilon^{1/2}, \end{equation}
and
 \begin{equation} \beta = \frac{\langle |\tau'(z)-\lambda(z)|^2 \rangle^{1/2}}{\langle |z-\tfrac12|^2 \rangle^{1/2}}. \end{equation}
In the following subsections, we prove bounds for different regimes of the Ekman number. We achieve this by using different estimates on the spectral constraint (4.8). However, the expression for the upper bound on  $\overline {{\langle {wT} \rangle }}$ in (4.9) remains the same. Therefore, first, we use our choices of
 $\tau (z)$ in (4.10) and
 $\lambda (z)$ in (4.11) to estimate (4.9).
4.3. Estimating the upper bound
Starting with (4.9) an application of the triangle inequality and the choice of  $\beta$ in (4.13) gives
 \begin{equation} U \leq \frac12 + \frac{1}{\sqrt{12}} \langle |\tau'(z) - \lambda(z)|^2 \rangle^{1/2} - \langle \tau \rangle. \end{equation}
Then, evaluating the sign positive integral with  $\tau (z)$ from (4.10) and
 $\lambda (z)$ in (4.11), gives
 \begin{align} \langle |\tau'(z)-\lambda(z) |^2 \rangle &= \int^{1}_\delta |\tau'(z)-\lambda(z)|^2\, \textrm{d}z\nonumber\\ & = \frac{a^2}{(1-\delta)^2}(1-\varepsilon-\delta) + \frac{a^2}{\varepsilon^2} \int^{1}_{1-\varepsilon} \left(\frac{1-\varepsilon}{z^{2}} - \frac{\varepsilon}{1-\delta}\right)^2 \, \textrm{d}z. \end{align}
We will require an upper and lower bound on (4.15). Starting with a lower bound, given that  $\varepsilon \leq \frac 13$ and
 $\delta \leq \frac 13$, with
 $z$ in the range
 $(1-\varepsilon,1)$, we make the suboptimal but simple estimate that
 \begin{equation} \left(\frac{1-\varepsilon}{z^{2}} - \frac{\varepsilon}{1-\delta}\right)^2 \geq \frac19, \end{equation}
such that we get
 \begin{equation} \langle |\tau'(z)-\lambda(z)|^2 \rangle \geq \frac{a^2}{\varepsilon^2} \int^{1}_{1-\varepsilon} \left(\frac{1-\varepsilon}{z^{2}} - \frac{\varepsilon}{1-\delta}\right)^2 \textrm{d}z\geq \frac{a^2}{9\varepsilon}. \end{equation}
For an upper bound on (4.15), given that  $\varepsilon$ and
 $\delta$ are positive, bounded above by
 $\frac 13$ and that
 $\delta \leq \varepsilon$, we use the estimate
 $(1-\varepsilon -\delta )(1-\delta )^{-2}\leq \frac 34 \varepsilon ^{-1}$ and
 $z^{-2}\leq (1-\varepsilon )^{-2}$, to obtain
 \begin{align} \langle |\tau'(z) - \lambda(z)|^2 \rangle & \leq \frac{3a^2}{4\varepsilon} + \frac{a^2}{\varepsilon^2} \int^{1}_{1-\varepsilon} \left(\frac{1-\varepsilon}{z^{2}} - \frac{\varepsilon}{1-\delta}\right)^2 \textrm{d}z \nonumber\\ &\leq \frac{3a^2}{4\varepsilon} + \frac{a^2}{\varepsilon^2} \int^{1}_{1-\varepsilon} \frac{1}{(1-\varepsilon)^2} + \frac{\varepsilon^2}{(1-\delta)^2} \,\textrm{d}z \nonumber\\ &\leq \frac{3a^2}{4\varepsilon} + \frac{a^2}{\varepsilon} \frac{1+\varepsilon^2}{(1-\varepsilon)^2} \leq \frac{4a^2}{\varepsilon}. \end{align}
Moving on to the integral of  $\tau (z)$ in (4.9), we have that
 \begin{equation} \int^{1}_0 \tau(z)\, \textrm{d}z = \frac12 \delta(1-a) - \frac{a}{\varepsilon}(1-\varepsilon)\ln(1-\varepsilon). \end{equation}
Substituting (4.19) and (4.18) back into (4.14), taking  $a$ as given by (4.12) and
 $\varepsilon,\delta \leq \frac 13$ such that
 $\delta ^2\varepsilon ^{1/2} \leq \frac {\sqrt {3}}{9} \delta$, gives
 \begin{equation} U \leq \tfrac12 - n \delta - \tfrac{1}{3} \delta \varepsilon^{{-}1/2} |\ln{(1-\varepsilon)}| , \end{equation}
where  $n = {(18-7\sqrt {3})}/{36}$.
4.4. Large Ekman numbers
To obtain bounds for large  $E$ in this subsection, we use Lemma 2.2. The estimates in Lemma 2.2 are pointwise estimates of the vertical velocity in Fourier space. Therefore, we exploit the horizontal periodicity of
 $\boldsymbol {u}$ and
 $T$ and take a Fourier decomposition of
 $w$ and
 $T$ in the spectral constraint (4.8). Taking that
 \begin{equation} \begin{bmatrix} T(x,y,z)\\ \boldsymbol{u}(x,y,z) \end{bmatrix}= \sum_{\boldsymbol{k}} \begin{bmatrix} T_{\boldsymbol{k}}(z)\\ \boldsymbol{u}_{\boldsymbol{k}}(z) \end{bmatrix} \textrm{e}^{{\rm i}(k_x x + k_y y)}, \end{equation}
where the sum is over non-zero wavevectors  $\boldsymbol {k}=(k_x,k_y)$ for the horizontal periods
 $L_x$ and
 $L_y$ and magnitude of each wavevector is
 $k = \sqrt {k_{\smash {x}}^2 + k_{\smash {y}}^2}$. Inserting the Fourier expansions (4.21) into (4.8) gives
 \begin{equation} \int^{1}_0 \beta |{T}'_{\boldsymbol{k}} |^2 + \beta k^2 |{T}_{\boldsymbol{k}} |^2 + \tau'(z) |{w}_{\boldsymbol{k}} {T}_{\boldsymbol{k}}| \,\textrm{d}z \geq 0, \end{equation}
where the complex conjugate relations of  ${w}_{\boldsymbol {k}} = {w}^{*}_{\boldsymbol {k}}$ holds, and
 $w_{\boldsymbol {k}}$ and
 $T_{\boldsymbol {k}}$ are subject to the boundary conditions
 $$\begin{gather} {w}_{\boldsymbol{k}}(0) = {w}_{\boldsymbol{k}}(1) = {w}'_{\boldsymbol{k}}(0) = {w}'_{\boldsymbol{k}}(1) =0, \end{gather}$$
 $$\begin{gather}{T}_{\boldsymbol{k}}(0) = {T}_{\boldsymbol{k}}(1) = 0. \end{gather}$$
Based on the boundary conditions, we infer the following two estimates. Given (4.23a) applying the fundamental theorem of calculus and Hölders inequality gives
 \begin{equation} |{w}_{\boldsymbol{k}}| = \int^{z}_{0} \int^{\sigma}_{0} |\partial^2_\eta {w}_{\boldsymbol{k}}(\eta)| \,\textrm{d}\eta \,\textrm{d}\sigma \leq \frac12 z^2 \lVert {w}''_{\boldsymbol{k}} \rVert_{\infty}, \end{equation}
and for  ${T}_{\boldsymbol {k}}$, the fundamental theorem of calculus and the Cauchy–Schwarz inequality gives
 \begin{equation} |{T}_{\boldsymbol{k}}| = \int^{z}_{0} |\partial_\eta {T}_{\boldsymbol{k}}(\eta)|\, \textrm{d}\eta \leq \sqrt{z} \lVert {T}'_{\boldsymbol{k}} \rVert_{2}. \end{equation}
Next, we substitute (4.10) into the sign indefinite term in (4.22) to obtain
 \begin{equation} \int^{1}_0 \tau'(z) |{w}_{\boldsymbol{k}} {T}_{\boldsymbol{k}}| \,\textrm{d}z ={-}\frac{1-a}{\delta} \int^{\delta}_0 |{w}_{\boldsymbol{k}} {T}_{\boldsymbol{k}}| \,\textrm{d}z - \frac{a(1-\varepsilon)}{\varepsilon} \int^{1}_{1-\varepsilon} z^{{-}2} |{w}_{\boldsymbol{k}} {T}_{\boldsymbol{k}}| \,\textrm{d}z. \end{equation}
As Lemma 2.2 contains two estimates for different  $\boldsymbol {k}$, we will split the sign indefinite term in half. Then, given that
 $a\leq 1$, use of (4.24), the Cauchy–Schwarz inequality, (2.7) and (2.8) from Lemma 2.2 gives that
 \begin{align} \frac{1-a}{ \delta } \int^{\delta}_0 |{w}_{\boldsymbol{k}} {T}_{\boldsymbol{k}} |\, \textrm{d}z &\leq \frac{1}{2\delta} \int^{\delta}_0 z^{5/2} \,\textrm{d}z \lVert {T}'_{\boldsymbol{k}} \rVert_2 \lVert {w}''_{\boldsymbol{k}} \rVert_\infty \nonumber\\ &\leq \frac{ \delta^{5/2}}{14} \lVert {T}'_{\boldsymbol{k}} \rVert_2 \lVert {w}''_{\boldsymbol{k}} \rVert_\infty + \frac{\delta^{5/2}}{14} \lVert {T}'_{\boldsymbol{k}} \rVert_2 \lVert {w}''_{\boldsymbol{k}} \rVert_\infty \nonumber\\ &\leq \frac{c_1}{14} \delta^{5/2} R(1+ \tfrac14 E^{{-}2})^{1/4} \lVert {T}'_{\boldsymbol{k}} \rVert_2 \lVert {T}_{\boldsymbol{k}} \rVert_2 \nonumber\\ & \quad + \frac{ c_2}{14} \delta^{5/2} \lVert {T}'_{\boldsymbol{k}} \rVert_2 (R \sqrt{k} \lVert {T}_{\boldsymbol{k}} \rVert_2 + R E^{{-}1} \lVert {T}_{\boldsymbol{k}} \rVert_2 ). \end{align}
Taking the term of order  $\sqrt {k}$ in (4.27), we estimate further by noting that from (4.25) we have a standard Poincaré inequality of
 \begin{equation} \lVert {T}_{\boldsymbol{k}} \rVert_2 \leq \frac{1}{\sqrt{2}}\lVert {T}'_{\boldsymbol{k}} \rVert_2, \end{equation}
such that the use of Young's inequality twice gives
 \begin{align} \frac{1}{14} \delta^{5/2} R \sqrt{k} c_2 \lVert {T}'_{\boldsymbol{k}} \rVert_2 \lVert {T}_{\boldsymbol{k}} \rVert_2 &\leq \frac{\beta}{2} k \lVert {T}_{\boldsymbol{k}} \rVert_2 \lVert {T}'_{\boldsymbol{k}} \rVert_2 + \frac{c_2^2}{392 \beta} \delta^5 R^2 \lVert {T}_{\boldsymbol{k}} \rVert_2 \lVert {T}'_{\boldsymbol{k}} \rVert_2 \nonumber\\ &\leq \frac{\beta}{2}k^2 \lVert {T}_{\boldsymbol{k}} \rVert_2^2 + \frac{\beta}{8}\lVert {T}'_{\boldsymbol{k}} \rVert_2^2 + \frac{c_2^2 }{392\sqrt{2}\beta} \delta^5 R^2 \lVert {T}'_{\boldsymbol{k}} \rVert_2^2. \end{align}
Then, substituting (4.29) into (4.27), the integral at the lower boundary becomes
 \begin{align} &\frac{1-a}{\delta}\int^{\delta}_0|{w}_{\boldsymbol{k}}{T}_{\boldsymbol{k}} | \,\textrm{d}z \leq \frac{\beta}{2}k^2 \lVert {T}_{\boldsymbol{k}} \rVert_2^2 + \frac{\beta}{8}\lVert {T}'_{\boldsymbol{k}} \rVert_2^2 + \frac{ c_2^2 }{392 \sqrt{2}\beta}\delta^5 R^2 \lVert {T}'_{\boldsymbol{k}} \rVert_2^2 \nonumber\\ &\quad +\frac{ c_1}{14\sqrt{2}} \delta^{5/2} R (1+ \tfrac14 E^{{-}2})^{1/4} \lVert {T}'_{\boldsymbol{k}} \rVert_2^2 + \frac{ c_2}{14\sqrt{2}} \delta^{5/2} R E^{{-}1} \lVert {T}'_{\boldsymbol{k}} \rVert_2^2. \end{align}
We realise that for a sufficiently small Ekman number, the term of order  $E^{-1}$ is larger than
 $(1+E^{-2})^{1/4}$ such that if we make the estimate
 \begin{equation} c_1(1+\tfrac14 E^{{-}2})^{1/4} \leq c_2E^{{-}1}, \end{equation}
we get a quadratic form in terms of  $E^2$, that places an upper bound on
 $E$ of
 \begin{equation} E\leq E_m = \frac{1}{2\sqrt{2}}({-}1 + \sqrt{1 + 64 (c_2^4 / c_1^4) })^{1/2} = 41.4487. \end{equation}
Now, (4.30) becomes
 \begin{align} \frac{1-a}{\delta} \int^{\delta}_0|{w}_{\boldsymbol{k}} {T}_{\boldsymbol{k}} | \,\textrm{d}z &\leq \frac{\beta}{2}k^2 \lVert {T}_{\boldsymbol{k}} \rVert_2^2 + \frac{\beta}{8}\lVert {T}'_{\boldsymbol{k}} \rVert_2^2 + \frac{ c_2^2 }{392 \sqrt{2}\beta}\delta^5 R^2 \lVert {T}'_{\boldsymbol{k}} \rVert_2^2\nonumber\\ &\quad +\frac{c_2}{7\sqrt{2}} \delta^{5/2} R E^{{-}1} \lVert {T}'_{\boldsymbol{k}} \rVert_2^2. \end{align}
Returning to the integral at the upper boundary in (4.26), we apply the same procedure, where (4.24) and (4.25) are instead
 \begin{equation} |{w}_{\boldsymbol{k}}| \leq \tfrac12(1-z)^2 \lVert {w}''_{\boldsymbol{k}} \rVert_\infty, \quad |{T}_{\boldsymbol{k}}| \leq \sqrt{1-z} \lVert {T}'_{\boldsymbol{k}} \rVert_2. \end{equation}
Given  $\varepsilon \leq \frac 13$ we use that
 $z^{-2} \leq (1-\varepsilon )^{-2}$ to get
 \begin{equation} \frac{a(1-\varepsilon)}{\varepsilon}\int^{1}_{1-\varepsilon}z^{{-}2} |{w}_{\boldsymbol{k}}{T}_{\boldsymbol{k}} | \,\textrm{d}z \leq \frac{a}{\varepsilon(1-\varepsilon)}\int^{1}_{1-\varepsilon} |{w}_{\boldsymbol{k}}{T}_{\boldsymbol{k}} | \,\textrm{d}z \leq \frac{3a}{2\varepsilon}\int^{1}_{1-\varepsilon}|{w}_{\boldsymbol{k}}{T}_{\boldsymbol{k}} | \,\textrm{d}z. \end{equation}
By use of Lemma 2.2, along with (4.34), (4.28), Young's inequality and (4.31), we can estimate the integral at the upper boundary to obtain
 \begin{align} &\frac{a(1-\varepsilon)}{\varepsilon}\int^{1}_{1-\varepsilon}z^{{-}2} |{w}_{\boldsymbol{k}}{T}_{\boldsymbol{k}} | \,\textrm{d}z \leq \frac{3a}{2\varepsilon}\int^{1}_{1-\varepsilon}|{w}_{\boldsymbol{k}}{T}_{\boldsymbol{k}} | \,\textrm{d}z \leq \frac{\beta}{2}k^2 \lVert {T}_{\boldsymbol{k}} \rVert_2^2 + \frac{\beta}{8}\lVert {T}'_{\boldsymbol{k}} \rVert_2^2 \nonumber\\ &\quad + \frac{9c_2^2}{6272\sqrt{2} \beta} \delta^2 \varepsilon^6 R^2 \lVert {T}'_{\boldsymbol{k}} \rVert_2^2 + \frac{3}{28\sqrt{2}} c_2 \delta \varepsilon^3 R E^{{-}1} \lVert {T}'_{\boldsymbol{k}} \rVert_2^2. \end{align}
Substituting (4.33) and (4.36) back into the spectral constraint (4.22) gives
 \begin{align} \left(\frac{3\beta}{4} - \frac{c_2^2}{392\sqrt{2}} \frac{\delta^5 R^2}{\beta} - \frac{ c_2}{7\sqrt{2}} \delta^{5/2} R E^{{-}1} - \frac{3 c_2}{28\sqrt{2}} \delta \varepsilon^3 R E^{{-}1} -\frac{9 c_2^2}{6272\sqrt{2} } \frac{\delta^2 \varepsilon^6 R^2}{\beta } \right) \lVert T'_{\boldsymbol{k}} \rVert_2^2 \geq 0. \end{align}
The spectral condition is satisfied provided the term in the brackets of (4.37) is non-negative. Note that we have an explicit expression for  $\beta$ in (4.13), which in conjunction with the lower bound in (4.17) gives the following lower bound on
 $\beta$ of
 \begin{equation} \beta \geq \frac{\sqrt{3} }{3} \delta. \end{equation}
After estimating  $\beta$ from below with (4.38) and making the choice
 \begin{equation} \delta = (\tfrac{9}{16})^{1/3} \varepsilon^2, \end{equation}
the condition for the positivity of (4.37) becomes, after rearranging,
 \begin{equation} 1 - \frac{c_2^2}{49\sqrt{2}} \delta^3 R^2 - \frac{8 c_2}{7\sqrt{6}} \delta^{3/2} R E^{{-}1} \geq 0. \end{equation}
In (4.40), two possible choices of  $\delta =\delta (R,E)$ guarantee the non-negativity of the left-hand side. If the second negative term dominates the first, i.e.
 \begin{equation} \frac{c_2^2}{49\sqrt{2}} \delta^3 R^2 \leq \frac{8 \, c_2}{7\sqrt{6}} \delta^{3/2} R E^{{-}1}, \end{equation}
then (4.40) becomes
 \begin{equation} \delta \leq \left(\frac{7\sqrt{6}}{16c_2 }\right)^{2/3} R^{{-}2/3}E^{2/3}. \end{equation}
Taking  $\delta$ as large as possible in (4.42) and substituting back into (4.40) implies that
 $E\leq 8 (\sqrt {2}/3)^{1/2}$. In the opposite scenario, where
 \begin{equation} \frac{8 c_2}{7\sqrt{6}} \delta^{3/2} R E^{{-}1} \leq \frac{c_2^2}{49\sqrt{2}} \delta^3 R^2, \end{equation}
then (4.40) becomes
 \begin{equation} \delta \leq \left( \frac{49\sqrt{2}}{2c_2^2} \right)^{1/3} R^{{-}2/3}, \end{equation}
which holds for  $E\geq 8(\sqrt {2}/3)^{1/2}$. In summary, the spectral condition holds if the condition in (4.40) is satisfied and (4.40) is guaranteed when we take
 $\delta$ as large as possible in (4.42) and (4.44). As a result, we have that
 \begin{equation} \delta =\begin{cases}
\left(\dfrac{7\sqrt{6}}{16c_2}\right)^{2/3}
R^{{-}2/3}E^{2/3}, & E \leq 8(\sqrt{2}/3)^{1/2}, \\ \left(
\dfrac{49\sqrt{2}}{2c_2^2} \right)^{1/3} R^{{-}2/3}, & E
\geq 8(\sqrt{2}/3)^{1/2}, \end{cases}
\end{equation}
and, by (4.39), that
 \begin{equation} \varepsilon =\begin{cases} \left(\dfrac{7\sqrt{6}}{12c_2}\right)^{1/3} R^{{-}1/3}E^{1/3}, & E \leq 8(\sqrt{2}/3)^{1/2}, \\ \left( \dfrac{392\sqrt{2}}{9c_2^2} \right)^{1/6} R^{{-}1/3}, & E \geq 8(\sqrt{2}/3)^{1/2}. \end{cases} \end{equation}
Therefore, substituting (4.45) and (4.46) back into (4.20), along with the fact that  $\overline {{\langle {wT} \rangle }} \leq U$ and (1.1) to obtain
 \begin{align} {\mathcal{F}}_B \geq
\begin{cases} d_1 R^{{-}2/3}E^{2/3} + d_2 R^{{-}1/2}E^{1/2}
| \ln (1- d_3 R^{{-}1/3}E^{1/3})|, & E \leq
8(\sqrt{2}/3)^{1/2}, \\ d_4 R^{{-}2/3} + d_5 R^{{-}1/2} |
\ln(1-d_6 R^{{-}1/3})|, & 8(\sqrt{2}/3)^{1/2} \leq E \leq
E_m, \end{cases} \end{align}
where the constants  $d_1$ to
 $d_6$ are collated in Appendix A. Finally, in § 4.2 we chose that both boundary layer widths are in
 $(0,\frac 13)$, therefore given (4.45) and (4.46) the bound obtained in (4.47) holds for all
 $R \geq 0.4715$.
4.5. Small Ekman numbers
Next, we demonstrate a proof of the bound on  ${\mathcal {F}}_B$ valid for small
 $E$ in (1). Here, we use Lemma 2.3 to demonstrate the non-negativity of the spectral constraint (4.8). The estimates used in this subsection do not require estimates in Fourier space.
Starting with the spectral constraint in (4.8), we start by substituting for  $\tau (z)$ from (4.10) into the sign-indefinite term and using the estimate
 $z^{-2} \leq (1-\varepsilon )^{-2}$ at the upper boundary gives
 \begin{equation} \langle \tau'(z)wT \rangle \geq{-} \frac{1-a}{\delta} \left\langle\int^{\delta}_0 wT \,\textrm{d}z \right\rangle_h - \frac{a}{\varepsilon}(1-\varepsilon)^{{-}1} \Bigg\langle\int^{1}_{1-\varepsilon} wT \,\textrm{d}z \Bigg\rangle_h . \end{equation}
We first consider the integral in (4.48) near  $z=0$ and obtain an estimate on
 $wT$. Since we require a lower bound on the right-hand side of (4.48), we can rearrange the order of integration of the first term on the right-hand side of (4.48) and estimate the integral from above. Given the boundary conditions (2.3), use of the fundamental theorem of calculus, (2.4b) and integration by parts gives
 \begin{align} \langle |wT| \rangle_h &= \left\langle \left|\int^{z}_0 \partial_s (wT) \,\textrm{d}s\right| \right\rangle_h = \left\langle \left| \int^{z}_0 T\partial_s w + w \partial_s T \,\textrm{d}s \right| \right\rangle_h = \left\langle \left|\int^{z}_0 - E T \nabla^2 \zeta + w \partial_s T \,\textrm{d}s\right| \right\rangle_h \nonumber\\ &= E \langle |\zeta' T| \rangle_h + \left\langle \left|\int^{z}_0 E\boldsymbol{\nabla} \zeta \boldsymbol{\nabla} T + w \partial_s T \,\textrm{d}s \right| \right\rangle_h . \end{align}
Then, given the boundary condition on the velocity and temperature in (2.3), we have that
 \begin{equation} |w(\cdot,z)| \leq \frac23 z^{3/2}\Bigg(\int^{1}_0 |w''(\cdot,z)|^2 \,\textrm{d}z\Bigg)^{1/2}, \quad \langle T^2 \rangle_h^{1/2} \leq \sqrt{z} \langle |\boldsymbol{\nabla} T|^2 \rangle^{1/2}, \end{equation}
use of which, along with multiple applications of the Cauchy–Schwarz inequality in (4.49), and that for  $f\in L^2(0,1)$ we have
 $\langle |\,f'|^{2} \rangle _h \leq \langle |\boldsymbol {\nabla } f|^2 \rangle _h \leq \langle |\boldsymbol {\nabla } f|^2 \rangle$, gives
 \begin{align} \langle |wT| \rangle_h &\leq E \langle |\zeta'|^2 \rangle_h^{1/2} \langle |T|^2 \rangle_h^{1/2} + E \langle |\boldsymbol{\nabla}\zeta|^2 \rangle^{1/2}\langle |\boldsymbol{\nabla} T|^2 \rangle^{1/2} +\frac{z^2}{3} \left\langle\int^{z}_0 |\partial_s T|^2 \,\textrm{d}s\right\rangle^{1/2}_h\langle |w''|^2 \rangle^{1/2} \nonumber\\ &\leq \left( (\sqrt{z} +1 )E\langle |\boldsymbol{\nabla} \zeta|^2 \rangle^{1/2} + \frac13 z^2 \langle |\nabla^2 w|^2 \rangle^{1/2}\right) \langle |\boldsymbol{\nabla} T|^2 \rangle^{1/2} . \end{align}
Next, we use Lemma 2.3, to bound both  $\langle |\boldsymbol {\nabla } \zeta |^2 \rangle$ and
 $\langle |\nabla ^2 w|^2 \rangle$ from above and given that
 $T$ is horizontally periodic with Dirichlet boundary conditions at
 $z=0$ and
 $1$ we have the standard Poincaré inequality
 $\langle |T|^2 \rangle \leq (1/{\rm \pi} ^2) \langle |\boldsymbol {\nabla } T|^2 \rangle$, which gives
 \begin{equation} \langle |wT| \rangle_h \leq \left(\frac{ER}{\sqrt{2} {\rm \pi}}(1 + \sqrt{z}) + \frac{1}{3{\rm \pi}}z^2R \right) \langle |\boldsymbol{\nabla} T|^2 \rangle. \end{equation}
Then, substituting back into the integral at the boundary, whereby (4.12) we have  $1-a\leq 1$, we get that
 \begin{equation} \frac{1-a}{\delta} \int^{\delta}_0 \langle |wT| \rangle_h \,\textrm{d}z \leq \left( \frac{E R}{\sqrt{2} {\rm \pi}}\left(1+\frac{2}{3} \delta^{1/2}\right) + \frac{1}{9{\rm \pi}}\delta^2 R \right) \langle |\boldsymbol{\nabla} T|^2 \rangle. \end{equation}
The same estimates hold at the upper boundary with  $a$ given by (4.12) and
 $z$ replaced by
 $1-z$. Then, since
 $\varepsilon \leq \frac 13$ we can take
 $1-\varepsilon \leq 1$ to obtain
 \begin{align} \frac12\delta \varepsilon^{{-}1/2}(1-\varepsilon)^{{-}1} \int^{1}_{1-\varepsilon} \langle |wT| \rangle_h \,\textrm{d}z \leq \frac34 \delta\varepsilon^{1/2}\left( \frac{ER}{\sqrt{2}{\rm \pi}}\left(1+\frac{2}{3} \varepsilon^{1/2}\right) + \frac{1}{9{\rm \pi}}\varepsilon^2 R\right) \langle |\boldsymbol{\nabla} T|^2 \rangle. \end{align}
Substituting (4.53) and (4.54) back into (4.48) and then into (4.8), gives after use of the lower bound on  $\beta$ from (4.38) that
 \begin{align} \Bigg(\frac{\sqrt{3}\delta}{3} - \frac{ER}{\sqrt{2}{\rm \pi}}\left(1 + \frac{2\delta^{1/2}}{3} \right) - \frac{\delta^2 R}{9{\rm \pi}} - \frac{3\delta\varepsilon^{1/2}ER}{4\sqrt{2}{\rm \pi}} \left( 1 + \frac{2\varepsilon^{1/2}}{3} \right) - \frac{\delta\varepsilon^{5/2}R}{12{\rm \pi}} \Bigg)\langle |\boldsymbol{\nabla} T|^2 \rangle\geq 0. \end{align}
Since  $\varepsilon \leq \frac 13$ and
 $\delta \leq \frac 13$, then, we will make estimates,
 $1+ 2\delta ^{1/2}/3 \leq \sqrt {2}{\rm \pi} /3$ and
 $1+ 2\varepsilon ^{1/2}/3 \leq \sqrt {2}{\rm \pi} /3$, such that after rearranging the spectral constraint becomes
 \begin{equation} \sqrt{3}\delta - E R - \frac{\delta^2 R}{3{\rm \pi}} - \frac34 \delta\varepsilon^{1/2} E R- \frac{\delta\varepsilon^{5/2}R}{4{\rm \pi}} \geq 0. \end{equation}
In (4.56), the first negative term does not contain an explicit  $\delta$ dependence, and so we will, at the very least, choose that
 \begin{equation} E R \leq \frac{\sqrt{3}}{2} \delta. \end{equation}
Using (4.57) and further making the choice
 \begin{equation} \delta = \frac34 \varepsilon^{5/2}, \end{equation}
gives
 \begin{equation} \frac{\sqrt{3}}{2} - \frac{2}{3{\rm \pi}}\delta R - \left(\frac34\right)^{4/5} \delta^{1/5} E R \geq 0. \end{equation}
Similar to the proof of a bound for large Ekman numbers in § 4.4, we have a constraint that we consider in two cases. If in (4.59), the second negative term dominates the first such that
 \begin{equation} \frac{2}{3{\rm \pi}} \delta R \leq \left(\frac34\right)^{4/5} \delta^{1/5} E R, \end{equation}
then
 \begin{equation} \delta \leq \frac{\sqrt{3}}{36} E^{{-}5} R^{{-}5} , \end{equation}
however, if this  $\delta$ is to satisfy the spectral constraint then its implication on (4.57) and (4.59) need to be checked. If we take
 $\delta$ to be as large as possible in (4.61), then, up to constants, we get from (4.57) and (4.59) that
 \begin{equation} E \gtrsim R^{{-}4/5} \quad \textrm{and} \quad E \lesssim R^{{-}1}, \end{equation}
which leads to a contradiction, and the initial assumption cannot be true. Assuming, instead, that
 \begin{equation} \left(\frac34\right)^{4/5}\delta^{1/5} E R \leq \frac{2}{3{\rm \pi}} \delta R, \end{equation}
gives in (4.59) that
 \begin{equation} \delta \leq \frac{3\sqrt{3}{\rm \pi}}{8} R^{{-}1}. \end{equation}
Taking  $\delta$ as large as possible in (4.64), the constraints from (4.57) implies that
 \begin{equation} E \leq \frac{9{\rm \pi}}{16} R^{{-}2}, \end{equation}
Finally, substituting the largest  $\delta$ from (4.64) into (4.58) gives
 \begin{equation} \varepsilon = \left(\frac{\sqrt{3}{\rm \pi}}{2}\right)^{2/5}R^{{-}2/5}. \end{equation}
Then, taking  $\delta$ as large as possible in (4.64), (4.66), substituting into (4.20), along with the fact that
 $\overline {{\langle {wT} \rangle }} \leq U$ and (1.1) we get that
 \begin{equation} {\mathcal{F}}_B \geq d_7 R^{{-}1} + d_8 R^{{-}4/5}|\ln{(1- d_9 R^{{-}2/5})} |, \quad E \leq \frac{9{\rm \pi}}{16} R^{{-}2}, \end{equation}
where the constants  $d_7$ to
 $d_9$ are collated in Appendix A. Finally, for completeness, we verify that the choice of
 $\varepsilon,\delta \in (0,\frac 13)$ made in § 4.2 is not restrictive. Since
 $\delta$ is smaller than
 $\varepsilon$ as expressed in (4.58), taking
 $\delta$ as large as possible in (4.64) the bound obtained in (4.67) holds for all
 $R \geq 6.1216$.
5. Bounds on the mean temperature
In this section, we prove bounds on  $\overline {{\langle {T} \rangle }}$ with the auxiliary functional method by using the same strategy as in § 4.1. First, we derive a variational problem for obtaining a lower bound on
 $\overline {{\langle {T} \rangle }}$, with a different quadratic auxiliary functional to (4.2). Then, given our choice of background profile
 $\varphi (z)$, we can estimate the lower bound
 $L$ on
 $\overline {{\langle {T} \rangle }}$ in terms of the parameters of
 $\varphi (z)$. We then prove bounds for large and small
 $E$ numbers by Lemmas 2.2 and 2.3. The proofs in this section are algebraically lighter than the proof for a bound on
 $\overline {{\langle {wT} \rangle }}$, primarily due to two reasons. The first is that the minimum principle on
 $T$, Lemma 2.1, is not required, and the second, the balance parameters do not have a
 $R$ dependence. The lower bounds we prove on
 $\overline {{\langle {T} \rangle }}$, including those already known, are illustrated in figure 6.
Illustration of the lower bounds on the mean temperature between no-slip and isothermal boundary conditions at infinite  $Pr$. The blue plot is the bound derived in § 5.3, valid up to
 $E_m \sim 41.4487$ and
 $E_1=8$. The bounds derived in § 5.4 are shown with a green plot. The dashed horizontal line denotes when all heat transport is by conduction and
 $\overline {{\langle {T} \rangle }}=\frac {1}{12}$. In
 $D$, we show the previously known best bound for stress-free (top, red) (Whitehead & Doering Reference Whitehead and Doering2012) and no-slip (bottom, blue) (Whitehead & Doering Reference Whitehead and Doering2011a) at zero rotation.

5.1. The auxiliary functional method
By the auxiliary functional method, we obtain an explicit variational problem that we solve to obtain a bound on  $\overline {{\langle {T} \rangle }}$. The following derivation, albeit in the language of the classic background field method approach, appears in previous papers (Whitehead & Doering Reference Whitehead and Doering2011a, Reference Whitehead and Doering2012). Here, we only present an outline within the auxiliary functional framework.
Starting with the quadratic auxiliary functional
 \begin{equation} {\mathcal{V}}\{T\} = \langle -\tfrac{1}{2}|T|^2 + 2\varphi(z) T \rangle, \end{equation}
where  $\varphi (z)$ is the background temperature field subject to the boundary conditions
 \begin{equation} \varphi(0)=\varphi(1)=0. \end{equation}
Then, provided  ${\mathcal {V}}\{T(t)\}$ is bounded along solutions of (2.1), the time derivative of the long-time average of
 ${\mathcal {V}}\{T\}$ is zero, such that we can write
 \begin{equation} \overline{{\langle {T} \rangle}}=L - \left(L - \overline{\langle T \rangle + \frac{\textrm{d}}{\textrm{d}t}{\mathcal{V}}\{T\}} \right) \geq L, \end{equation}
where the inequality comes from assuming that,  $L-\overline { \langle T \rangle + ({\textrm {d}}/{\textrm {d}t}){\mathcal {V}}\{T\} } \leq L-\langle T \rangle - ({\textrm {d}}/{\textrm {d}t}){\mathcal {V}}\{T\} \leq 0$. Noting that we again bound the terms in the long-time integral by the pointwise in time maximum over all periodic
 $\boldsymbol {u}$ and
 $T$, where
 $\boldsymbol {\nabla } \boldsymbol {\cdot } \boldsymbol {u}=0$, subject to the boundary conditions (2.3). Hence, after substituting for the Lie derivative of
 ${\mathcal {V}}\{T\}$ by use of (2.1c) and rearranging, we have, after appropriate manipulations, the following variational problem
 \begin{equation} \overline{{\langle {T} \rangle}} \geq \inf_{L, \varphi(z)} \{L \,\vert\,{\mathcal{S}}\{\boldsymbol{u},T\} \geq 0 \enspace \forall (\boldsymbol{u},T)\in{\mathcal{H}}_+\}, \end{equation}
where
 \begin{equation} {\mathcal{S}}\{\boldsymbol{u},T\} := \langle |\boldsymbol{\nabla} T|^2 + \varphi'(z)wT - \varphi'(z)\partial_z T + \varphi(z) - L \rangle. \end{equation}
In this case, the spectral constraint is given by
 \begin{equation} \langle |\boldsymbol{\nabla} T|^2 + 2\varphi'(z)wT \rangle\geq 0. \end{equation}
Then, by optimising the linear terms in (5.5) the explicit expression for  $L$ is given
 \begin{equation} L := 2\langle \varphi(z) \rangle - \langle |\varphi'(z)|^2 \rangle. \end{equation}
5.2. Preliminaries
To establish a lower bound on  $\overline {{\langle {T} \rangle }}$, we take the following class of background fields
 \begin{equation}
\varphi(z):=\begin{cases} \tfrac12(1-\delta)z, & 0 \leq z
\leq \delta, \\ \tfrac12\delta(1-\delta), & \delta \leq z
\leq 1- \delta,\\ \tfrac12(1-\delta)(1-z), & 1-\delta \leq
z \leq 1. \end{cases} \end{equation}
The background field is determined entirely by  $\delta \in (0,\frac 13)$, the width of the boundary layers at the top and bottom of the domain, sketched in figure 7. In contrast to § 4, no advantage follows from background fields with boundary layers of different widths.


The lower bounds on  $\overline {{\langle {T} \rangle }}$ for different Ekman numbers rely on different estimates of the velocity in the spectral constraint (5.6) given the diagnostic (2.4). Given the choice of background profile (5.8), the expression for the lower bound
 $L=L(\delta )$ is unchanged based on the estimates we use to demonstrate the non-negativity of the spectral constraint for different Ekman numbers. Thus, we now estimate
 $L$ in (5.7) given (5.8). Substituting for
 $\varphi (z)$ from (5.8), we get
 \begin{equation} L = \tfrac12 \delta (1-\delta)^2. \end{equation}
Since  $\delta \leq \frac 13$, then the estimate
 $1-\delta \geq \frac 23$, gives
 \begin{equation} L \geq \tfrac29 \delta . \end{equation}
5.3. Large Ekman numbers
We can now proceed to establish a lower bound on  $\overline {{\langle {T} \rangle }}$ by establishing the conditions under which the spectral constraint of (5.4) is satisfied, given the choice of background temperature field (5.8) and by use of Lemma 2.2. The estimates in Lemma 2.2 apply to (2.4) in Fourier space so we exploit horizontal periodicity and substitute (4.21) into (5.6) such that the spectral constraint in Fourier space is
 \begin{equation} \int^{1}_0 |{T}'_{\boldsymbol{k}}|^2 + k^2|{T}_{\boldsymbol{k}}|^2 + 2\varphi'(z)\,\textrm{Re}\{ {w}_{\boldsymbol{k}} {T}_{\boldsymbol{k}}^*\} \,\textrm{d}z \geq 0. \end{equation}
Substituting for  $\varphi (z)$ and using the fact that
 $\delta \leq \frac 13$ gives
 $-(1-\delta ) \geq -1$, the sign-indefinite of (5.11) is
 \begin{align} 2\int^{1}_0 \varphi'(z) \,\textrm{Re}\{ {w}_{\boldsymbol{k}} {T}_{\boldsymbol{k}}^* \} \,\textrm{d}z &\geq{-} 2\int^{1}_0 |\varphi'(z) {w}_{\boldsymbol{k}} {T}_{\boldsymbol{k}}|\, \textrm{d}z \nonumber\\ &\geq{-} \int^{\delta}_0 | {w}_{\boldsymbol{k}} {T}_{\boldsymbol{k}}| \,\textrm{d}z - \int^{1}_{1-\delta} | {w}_{\boldsymbol{k}} {T}_{\boldsymbol{k}}| \,\textrm{d}z. \end{align}
Due to the symmetry in the boundary conditions and  $\varphi (z)$, we only demonstrate estimates on the integral at the lower boundary since that at the top gives an identical contribution. Using the estimates of (4.24) and (4.25) on
 $w_{\boldsymbol {k}}$ and
 $T_{\boldsymbol {k}}$, Lemma 2.2 and Young's inequality, we get
 \begin{align} \int^{\delta}_0 |{w}_{\boldsymbol{k}} {T}_{\boldsymbol{k}} | \,\textrm{d}z &\leq \frac{1}{2} \int^{\delta}_0 z^{5/2} \,\textrm{d}z \lVert {T}'_{\boldsymbol{k}} \rVert_2 \lVert {w}''_{\boldsymbol{k}} \rVert_\infty \nonumber\\ &= \frac{1}{14} \delta^{7/2} \lVert {T}'_{\boldsymbol{k}} \rVert_2 \lVert {w}''_{\boldsymbol{k}} \rVert_\infty + \frac{1}{14} \delta^{7/2} \lVert {T}'_{\boldsymbol{k}} \rVert_2 \lVert {w}''_{\boldsymbol{k}} \rVert_\infty \nonumber\\ &\leq \frac{ \delta^{7/2}}{14} c_1 R(1+ \tfrac14 E^{{-}2})^{1/4} \lVert {T}_{\boldsymbol{k}}' \rVert_2 \lVert {T}_{\boldsymbol{k}} \rVert_2 \nonumber\\ & \quad + \frac{\delta^{7/2}}{14} \lVert {T}_{\boldsymbol{k}}' \rVert_2 c_2 (R \sqrt{k} \lVert {T}_{\boldsymbol{k}} \rVert_2 + R E^{{-}1} \lVert {T}_{\boldsymbol{k}} \rVert_2 ). \end{align}
Taking the term of order  $\sqrt {k}$, estimating by use of Young's inequality twice and (4.28) gives
 \begin{align} \frac{1}{14} \delta^{7/2} R \sqrt{k} c_2 \lVert {T}'_{\boldsymbol{k}} \rVert_2 \lVert {T}_{\boldsymbol{k}} \rVert_2 &\leq \frac{\sqrt{2}}{2} k \lVert {T}_{\boldsymbol{k}} \rVert_2 \lVert {T}'_{\boldsymbol{k}} \rVert_2 + \frac{c_2^2}{392\sqrt{2}} \delta^7 R^2 \lVert {T}_{\boldsymbol{k}} \rVert_2 \lVert {T}'_{\boldsymbol{k}} \rVert_2 \nonumber\\ &\leq \frac{1}{2}k^2 \lVert {T}_{\boldsymbol{k}} \rVert_2^2 + \frac{1}{4}\lVert {T}'_{\boldsymbol{k}} \rVert_2^2 + \frac{ c_2^2}{784} \delta^7 R^2 \lVert {T}'_{\boldsymbol{k}} \rVert_2^2. \end{align}
Therefore, the integral from 0 to  $\delta$ simplifies to
 \begin{align} \int^{\delta}_0|{w}_{\boldsymbol{k}}{T}_{\boldsymbol{k}} | \,\textrm{d}z & \leq \frac12 k^2 \lVert {T}_{\boldsymbol{k}} \rVert_2^2 + \frac{1}{4}\lVert {T}'_{\boldsymbol{k}} \rVert_2^2 + \frac{ c_2^2}{784} \delta^7 R^2 \lVert {T}'_{\boldsymbol{k}} \rVert_2^2\nonumber\\ &\quad +\frac{\sqrt{2}}{28} c_1 \delta^{7/2} R (1+ \tfrac14 E^{{-}2})^{1/4} \lVert {T}'_{\boldsymbol{k}} \rVert_2^2 + \frac{\sqrt{2}}{28} c_2 \delta^{7/2} R E^{{-}1} \lVert {T}'_{\boldsymbol{k}} \rVert_2^2. \end{align}
By equivalent estimates at the upper boundary, we get the same upper bound such that (5.12) becomes
 \begin{align} &2\int^{1}_0 \varphi'(z) \,\textrm{Re}\{{w}_{\boldsymbol{k}} {T}_{\boldsymbol{k}}^* \}\,\textrm{d}z \geq{-} k^2 \lVert {T}_{\boldsymbol{k}} \rVert_2^2 - \frac{1}{2} \lVert {T}'_{\boldsymbol{k}}\rVert_2^2 - \left(\frac{c_2^2 }{392} \delta^7 R^2 \right.\nonumber\\ &\quad \left. +\frac{\sqrt{2}}{14} c_1 \delta^{7/2} R (1+ \tfrac14 E^{{-}2})^{1/4} + \frac{\sqrt{2}}{14} c_2 \delta^{7/2} R E^{{-}1} \right) \lVert {T}'_{\boldsymbol{k}} \rVert_2^2. \end{align}
Finally, we use the estimate in (4.31), which places an upper limit on  $E=E_m$ in (4.32), for which the bounds are valid. Then, substituting (5.16) into (5.11) with (4.31), the spectral constraint becomes
 \begin{equation} \frac{1}{2} - \frac{c_2^2}{392} \delta^7 R^2 - \frac{ \sqrt{2}}{7} c_2 \delta^{7/2} R E^{{-}1} \geq 0. \end{equation}
In (5.17), two possible choices of  $\delta =\delta (R,E)$ guarantee the non-negativity of the left-hand side. If
 \begin{equation} \frac{c_2^2}{392} \delta^7 R^2 \leq \frac{ \sqrt{2}}{7} c_2 \delta^{7/2} R E^{{-}1}, \end{equation}
then from (5.17) we have that
 \begin{equation} \delta \leq \left( \frac{7\sqrt{2}}{8c_2}\right)^{2/7} R^{{-}2/7} E^{2/7}. \end{equation}
Taking (5.19) as large as possible, substituting back into (5.17) and rearranging, we find that the spectral constraint holds when  $E \leq 8$. In the opposite scenario, where
 \begin{equation} \frac{ \sqrt{2}}{7} c_2 \delta^{7/2} R E^{{-}1} \leq \frac{c_2^2}{392} \delta^7 R^2, \end{equation}
substituted back into (5.17) gives that
 \begin{equation} \delta \leq \left( \frac{196}{c_2^2} \right)^{1/7} R^{{-}2/7}, \end{equation}
which holds for  $E\geq 8$. In summary, we have that
 \begin{equation} \delta =\begin{cases}
\left( \dfrac{7\sqrt{2}}{8c_2}\right)^{2/7} R^{{-}2/7}
E^{2/7}, & E\leq 8,\\ \left( \dfrac{196}{c_2^2}
\right)^{1/7} R^{{-}2/7}, & E\geq 8, \end{cases}
\end{equation}
which we can finally substitute into (5.10) remembering that  $\overline {{\langle {T} \rangle }}\geq L$ to obtain that
 \begin{equation} \overline{{\langle {T} \rangle}} \geq\begin{cases} d_{10} R^{{-}2/7} E^{2/7}, & E\leq 8,\\ d_{11} R^{{-}2/7}, & 8 \leq E \leq E_m, \end{cases} \end{equation}
where  $d_{10}$ and
 $d_{11}$ are given in Appendix A. A final check is on the validity of the bounds given choices made in § 5.2 that
 $\delta$ is in
 $(0,\frac 13)$. Given (5.22) the bound obtained in (5.23) holds for all
 $R \geq 7.1363$ when
 $E \leq 8$ and
 $R\geq 10.0922$ when
 $E \geq 8$.
5.4. Small Ekman numbers
Next, we move on to the proof of the lower bound on  $\overline {{\langle {T} \rangle }}$ in (1) valid for a small
 $E$. Here, we use Lemma 2.3, which does not require estimates in Fourier space. Starting with the spectral constraint (5.6) and substituting for
 $\varphi (z)$ from (5.8), the sign-indefinite term becomes
 \begin{equation} 2\langle \varphi'(z) w T \rangle \geq{-}2 \langle |\varphi'(z) wT| \rangle \geq{-}\left\langle \int^{\delta}_0|wT| \,\textrm{d}z \right\rangle_h - \Bigg\langle \int^{1}_{1-\delta}|wT| \,\textrm{d}z \Bigg\rangle_h. \end{equation}
In § 4.5, we established the estimate (4.52) and can substitute directly into the integral at the lower boundary in (5.24) to obtain
 \begin{equation} \left\langle \int^{\delta}_0|wT| \,\textrm{d}z \right\rangle_h \leq \left[\frac{E\,R}{\sqrt{2}{\rm \pi}}\left(\delta +\frac{ 2\delta^{3/2}}{3}\right) + \frac{1}{9{\rm \pi}}\delta^3 R \right] \langle |\boldsymbol{\nabla} T|^2 \rangle. \end{equation}
The integral at the upper boundary gives an identical estimate such that the spectral constraint of (5.6) becomes
 \begin{align} &\langle |\boldsymbol{\nabla} T|^2 + 2\varphi'(z)wT \rangle \geq \langle |\boldsymbol{\nabla} T|^2 - 2|\varphi'(z)wT| \rangle \nonumber\\[4pt] &\quad \geq \langle |\boldsymbol{\nabla} T|^2 \rangle - 2\left[\frac{E\,R}{\sqrt{2}{\rm \pi}}\left(\delta +\frac{ 2\delta^{3/2}}{3}\right) + \frac{1}{9{\rm \pi}}\delta^3 R \right] \langle |\boldsymbol{\nabla} T|^2 \rangle \geq 0. \end{align}
Therefore, the spectral constraint becomes the condition
 \begin{equation} 1 - \frac{2 ER}{\sqrt{2}{\rm \pi}}\left(\delta +\frac{ 2 \delta^{3/2}} {3 }\right) - \frac{1}{9{\rm \pi}}\delta^3 R \geq 0. \end{equation}
Given that  $\delta \leq \frac 13$, we use the estimate that
 $1+2\delta ^{1/2}/3 \leq \frac {\sqrt {2}{\rm \pi} }{3}$ to obtain the condition
 \begin{equation} 1 - \frac23 E R \delta - \frac{1}{9{\rm \pi}} \delta^3 R \geq 0. \end{equation}
Once more, the condition admits  $\delta =\delta (R,E)$ valid for two cases. If we take
 \begin{equation} \frac23 E R \delta \leq \frac{1}{9{\rm \pi}} \delta^3 R, \end{equation}
then (5.28) is non-negative if
 \begin{equation} \delta \leq \left( \frac{9{\rm \pi}}{2} \right)^{1/3} R^{{-}1/3}, \end{equation}
where when taking  $\delta$ as large as possible the choice holds when
 $E \leq \frac {3}{4}({2}/{9{\rm \pi} })^{1/3}R^{-2/3}$. In the case where
 \begin{equation} \frac{1}{9{\rm \pi}} \delta^3 R \leq \frac23 E R \delta, \end{equation}
then
 \begin{equation} \delta \leq \tfrac{3}{4} R^{{-}1} E^{{-}1}, \end{equation}
for all  $E \geq \frac {3}{4}({2}/{9{\rm \pi} })^{1/3}R^{-2/3}$. Therefore, the spectral constraint is satisfied if
 \begin{equation} \delta =\begin{cases}
\left( \dfrac{9{\rm \pi}}{8} \right)^{1/3} R^{{-}1/3}, & E \leq
\dfrac{3}{4}\left(\dfrac{2}{9{\rm \pi}}\right)^{1/3}R^{{-}2/3},\\
\dfrac{3}{4} R^{{-}1} E^{{-}1}, & E \geq
\dfrac{3}{4}\left(\dfrac{2}{9{\rm \pi}}\right)^{1/3}R^{{-}2/3}.
\end{cases} \end{equation}
Substituting into (5.10) and remembering further that  $\overline {{\langle {T} \rangle }}\geq L$, gives
 \begin{equation} \overline{{\langle {T} \rangle}} \geq \begin{cases} d_{12} R^{{-}1/3}, & E \leq \dfrac{3}{4}\left(\dfrac{2}{9{\rm \pi}}\right)^{1/3}R^{{-}2/3}, \\ d_{13} R^{{-}1}E^{{-}1}, & E \geq \dfrac{3}{4}\left(\dfrac{2}{9{\rm \pi}}\right)^{1/3}R^{{-}2/3}, \end{cases} \end{equation}
where  $d_{12}$ and
 $d_{13}$ are in Appendix A. Finally, for completeness, we verify that the choice of
 $\delta \in (0,\frac 13)$ made in § 5.2 is not restrictive. Given (5.33) the bound obtained in (5.34) holds for all
 $R \geq 95.4259$ when
 $E \leq \frac {3}{4}({2}/{9{\rm \pi} })^{1/3}R^{-2/3}$ and for all
 $R\geq 1$ otherwise.
6. Discussion
6.1. Regions of validity of the bounds
Owing to the use of two different estimates (Lemmas 2.2 and 2.3), we need to consider which bounds dominate in the various regions created by the constraints on the bounds. To this effect, first, we plot the regions in which the bounds on  ${\mathcal {F}}_B$ and
 $\overline {{\langle {T} \rangle }}$ overlap in figure 8. For ease of understanding, we split the space of
 $E$ and
 $R$ into four main regions. Region I, where
 $R$ and
 $E$ are large, corresponds to a slowly rotating buoyancy-dominated flow. Region II is the solid body rotation of the fluid since
 $R$ and
 $E$ are small. Region III, where
 $R$ is large and
 $E$ small, contains a transition from buoyancy- to rotation-dominated convection provided
 $R>R_L$ where
 $R_L$ is the Rayleigh number above which the flow is linearly unstable. At the same time, region IV, where
 $E$ is small but
 $R$ cannot get too large, is for rotation-dominated flows.
The Rayleigh and Ekman number diagrams for the bounds (4.47), (4.67), (5.23) and (5.34). Grey areas denote regions where the bounds proven in this work do not hold. We plot the regions of validity for the bounds on  ${\mathcal {F}}_B$ in (a) and for
 $\overline {{\langle {T} \rangle }}$ in (b). The blue solid lines correspond to
 $E= 1.7671 \,R^{-2}$ in (a) and
 $E=0.3102\, R^{-2/3}$ in (b), with the blue area denoting region IV. The horizontal red solid lines are
 $E_0 = 5.4927$ in (a) and
 $E_1 = 8$ in (b) and the red area is region III, where for (b) IIIa is the purple zone with the solid purple line corresponding to
 $E = 1.9273\, R^{-5/9}$. In both figures, the horizontal yellow lines are
 $E_m = 41.4487$ with the yellow zone corresponding to region I. The vertical dashed lines are
 $R_L=26926.6$ and the green dashed lines are the asymptotic result of (3.15). The four main regions are labelled I to IV.

In figure 8(a), the blue solid line shows  $E = 1.7671\, R^{-2}$, the red line is the constant
 $E_0= 5.4927$, whereas in figure 8(b) the blue line shows
 $E = 0.3102 R^{-2/3}$, the purple line
 $E = 1.9273 R^{-5/9}$ and the red line is the constant
 $E_1 = 8$. In both (a) and (b), the yellow line is the constant
 $E_m = 41.4487$ from (4.32), the dotted vertical line,
 $26926.6$ and the dashed green line is the asymptotic result of (3.15).
Starting with figure 8(a), the bounds of (4.47) and (4.67) split the diagram into four and we evaluate the best bound in each region. For region I, where  $E\gtrsim R^{-2}$ and
 $E_m \geq E\geq E_0$, the only valid bound is
 $d_4 R^{-2/3} + d_5 R^{-1/2}|\ln (1-d_6 R^{-1/3} )|$. The scaling of the slowly rotating convection bound matches the zero rotation bound of Arslan & Rojas (Reference Arslan and Rojas2024), noting that the initial assumptions on
 $\delta$ and
 $\varepsilon$ can be adjusted such that the constants in the two bounds match. The question of a bound dependent on
 $E$ that, in the limit of
 $E\rightarrow \infty$, matches the scaling of
 $R^{-2/3}$ remains open. In region II,
 $E\lesssim R^{-2}$ and
 $E_m\geq E \geq E_0$, the best bound would match region I, but the region is below
 $R_L$ when
 $E=\infty$, so no convection occurs, and
 ${\mathcal {F}}_B=\frac 12$. In region III,
 $E\gtrsim R^{-2}$ and
 $E\leq E_0$, the only bound is
 $d_1 R^{-2/3}E^{2/3} + d_2 R^{-1/2}E^{1/2}|\ln (1-d_3 R^{-1/3}E^{1/3} )|$, provided
 $R>R_L$. Finally, in region IV, where
 $E\lesssim R^{-2}$ and
 $E\leq E_0$, the best bound is
 $d_7 R^{-1} + d_8 R^{-4/5}|\ln (1-d_9 R^{-2/5})|$ again provided that
 $R > R_L$. While region IV is below the dotted green line in figure 8, (3.15) is an asymptotic result for instability with stress-free boundaries. The bounds, on the other hand, are for no-slip boundaries.
We now move on to figure 8(b) and the bounds (5.23) and (5.34). The first difference with (a) is that region I, is split into two. In region I where  $E\gtrsim R^{-2/3}$ and
 $E_m \geq E \geq E_1$, there are two bounds of
 $d_{13} R^{-1}E^{-1}$ and
 $d_{11} R^{-2/7}$, where from a comparison of the two the better bound is
 $d_{11} R^{-2/7}$, due to the requirement of
 $E\gtrsim R^{-2/3}$. However, for region Ia where
 $E \gtrsim R^{-2/3}$ and
 $E\geq E_m$, the only valid bound is
 $d_{13} R^{-1}E^{-1}$. Region II, where
 $E\lesssim R^{-2/3}$ and
 $E \geq E_1$, is below the linear stability limit, so
 $\overline {{\langle {T} \rangle }}=\tfrac {1}{12}$. In region III,
 $E\gtrsim R^{-2/3}$ and
 $E\leq E_1$, there are two bounds of
 $d_{10} R^{-2/7}E^{2/7}$ and
 $d_{13} R^{-1}E^{-1}$, and both are valid in different cases. When
 $R^{-2/3} \lesssim E\lesssim R^{-5/9}$, referred to as region IIIa and shown with the purple region, the better lower bound is
 $d_{13}R^{-1}E^{-1}$, provided
 $R>R_L$. If instead
 $E\gtrsim R^{-5/9}$, then instead the mean temperature is bounded by
 $d_{10} R^{-2/7}E^{2/7}$. The dashed green line scales as
 $R^{-3/4}$, so, for sufficiently large
 $R$, the entirety of region III corresponds to convecting flows. In region IV,
 $E\lesssim R^{-2/3}$ and
 $E\leq E_1$, there are two bounds but the better one is
 $d_{12} R^{-1/3}$, provided
 $R>R_L$. Table 1 summarises the above discussion of the results.
Having established the regions where each of the bounds is valid in the  $E$–
 $R$ space, we now consider the implications of these bounds on rotation in turbulent convection driven by internal heating. Figure 9 compares the bounds proven in this paper with the best-known bounds for IHC without rotation (Whitehead & Doering Reference Whitehead and Doering2011a; Arslan & Rojas Reference Arslan and Rojas2024). We fix
 $E$ at
 $1 \times 10^{-16}$ and plot the bounds as a function of
 $R$, and then fix
 $R$ at
 $1 \times 10^{8}$ and plot them as a function of
 $E$. Equivalent to taking horizontal and vertical slices of figure 8 to visualise the bounds along each line segment.
Plots of the ratio of lower bounds on  ${\mathcal {F}}_B$ and
 $\overline {{\langle {T} \rangle }}$ relative to the best-known bounds at zero rotation
 ${\mathcal {F}}_{B0}$ and
 $\overline {{\langle {T} \rangle }}_0$ (Whitehead & Doering Reference Whitehead and Doering2011a; Arslan & Rojas Reference Arslan and Rojas2024), for
 $E = 1\times 10^{-16}$ in (a) and (c) and
 $R=1\times 10^8$ in (b) and (d). In all of the subplots, the blue lines are the lower bounds in region IV, the red lines are the bounds in region III and the yellow lines are the bounds in Region I, while purple lines in (c) and (d) are the bounds valid in regions Ia and IIIa for
 $\overline {{\langle {T} \rangle }}$. The bounds themselves are in table 1. Vertical dotted lines show the intersections of the regions for each bound.

Discontinuities at the intersections in figure 9, defined by the regions of validity for each bound (table 1), are expected and arise from comparing bounds obtained by different lemmas and are a product of the method used to ensure positivity of the spectral constraint of (4.8) in §§ 4 and 5. In addition, across all subplots, the ratio of the bounds is consistently less than 1, though by restricting the choices of  $\delta$,
 $\varepsilon$, and estimates in the proofs, the
 $y$ values in figure 9 can be made larger. For brevity in the proofs, constants were not optimised. Starting with
 ${\mathcal {F}}_B$ at
 $E = 10^{-16}$, the bounds in region III (red line) have the same scaling as the zero-rotation case, while in region IV (blue line), the bounds decrease, suggesting that at higher
 $R$, less heat may escape the domain compared with the non-rotating case. For fixed
 $R$, only the bound in region III changes with
 $E$: for smaller
 $E$, the bound on
 ${\mathcal {F}}_B$ is smaller than
 ${\mathcal {F}}_{B0}$. For
 $\overline {{\langle {T} \rangle }}$, with
 $E$ fixed, the bounds scale such that the ratio
 $\overline {{\langle {T} \rangle }}/\overline {{\langle {T} \rangle }}_0$ always decreases. However, when
 $R$ is constant, the scaling in regions IV and I (yellow line) is independent of
 $E$. As rotation increases, the ratio decreases in region III but increases in regions Ia and IIIa (purple lines). A smaller lower bound in the rotating case implies a larger possible range for
 ${\mathcal {F}}_B$ and
 $\overline {{\langle {T} \rangle }}$. Since rotation introduces new flow regimes, it is possible that some flows cause both quantities to be lower than in the absence of rotation.
Finally, consider the possible heuristic scalings of  $\overline {{\langle {T} \rangle }} \sim R^{-3/5} E^{-4/5}$ from (B3b) and
 ${\mathcal {F}}_B \sim R^{-3/10} E^{-2/5}$ from (B4b), that may hold for rotation-dominated convection. In the scaling laws, if we fix
 $R$ and take
 $E\rightarrow 0$, we tend to the uniform upper bounds for both quantities. The lower bounds closest to the heuristic scaling are those in region III (table 1). It is insightful to consider the small
 $E$ limit where
 $E \sim R_L^{-3/4}$, and we can write that
 \begin{equation} \overline{{\langle {T} \rangle}} \sim \left(\frac{R}{R_L} \right)^{{-}3/5}, \end{equation}
and
 \begin{equation} {\mathcal{F}}_B \sim \left(\frac{R}{R_L} \right)^{{-}3/10}, \end{equation}
whereas the rigorous bounds in region III (table 1) become
 \begin{equation} \overline{{\langle {T} \rangle}} \gtrsim \left(\frac{R}{R_L} \right)^{3/14}R^{{-}1/2}, \end{equation}
and
 \begin{equation} {\mathcal{F}}_B \gtrsim \left(\frac{R}{R_L} \right)^{1/2} R^{{-}7/6} + \left(\frac{R}{R_L} \right)^{3/8} R^{{-}7/8}\left| \ln{\left(1-\left(\frac{R}{R_L}\right)^{1/4} R^{{-}7/12} \right)} \right|. \end{equation}
Since  $R$ is always a multiple of
 $R_L$, for
 $R>R_L$, the bounds in (6.2), as expected, are smaller than the heuristic scaling laws (6.1). If the lower bounds are not sharp, then this would motivate the question of how to improve the bounds, which we now discuss with concluding remarks.
6.2. Conclusions
In this work we prove the first lower bounds on the mean temperature  $\overline {{\langle {T} \rangle }}$, ((5.23) and (5.34)) and the mean heat flux out of the bottom boundary
 ${\mathcal {F}}_B$ ((4.47) and (4.67)), for rotating uniform IHC in the limit of infinite Prandtl number. Using the fact that the momentum equation in RBC and IHC is identical, we adapt estimates from Yan (Reference Yan2004) and Constantin et al. (Reference Constantin, Hallstrom and Putkaradze1999) to prove the first Rayleigh- and Ekman-number-dependent bounds on
 $\overline {{\langle {T} \rangle }}$ and
 ${\mathcal {F}}_B$ in IHC. By application of the auxiliary functional method, we prove bounds that apply to different regions of buoyancy to rotation-dominated flows, summarised in figure 8 and table 1. In addition to rigorous bounds, we demonstrate that the critical Rayleigh number for linear stability,
 $R_L$, asymptotically scales with the Ekman number as
 $E^{-4/3}$ when the marginally stable states are steady.
In contrast to previous applications of the background field method, there are several unique features in the proofs of bounds in this work. First, the background temperature fields have boundary layers of different widths for the proofs on  ${\mathcal {F}}_B$, but not for
 $\overline {{\langle {T} \rangle }}$. In particular, when we use Lemma 2.2 we find that
 $\delta = \varepsilon ^{2}$, while when using Lemma 2.3,
 $\delta = \varepsilon ^{5/2}$. The relation from using Lemma 2.2 (§ 4.4) matches the predictions of heuristic arguments (Appendix B). However, whether or not the background profiles are optimal remains unknown and can be addressed with numerical optimisation over a finite range of parameters (Fantuzzi & Wynn Reference Fantuzzi and Wynn2016; Fantuzzi Reference Fantuzzi2018; Fantuzzi et al. Reference Fantuzzi, Arslan and Wynn2022). The scaling of the bound obtained for
 ${\mathcal {F}}_B$ in the slowly rotating region (region I in figure 8 and table 1) matches the best known bound for zero rotation, however, the constants differ. The scaling of the bounds on
 $\overline {{\langle {T} \rangle }}$ do not match the zero rotation case, but the bounds in this work only hold up to
 $E\leq E_m = 41.4487$, and the background profile is not logarithmic, which is critical to the bound of Whitehead & Doering (Reference Whitehead and Doering2011a). It would be interesting if further investigations can prove a bound that holds for large
 $E$ too and matches the scaling of the zero rotation bounds on
 $\overline {{\langle {T} \rangle }}$ (Whitehead & Doering Reference Whitehead and Doering2011a) and
 ${\mathcal {F}}_B$ (Arslan & Rojas Reference Arslan and Rojas2024) when
 $E\rightarrow \infty$. The two lemmas used in this work give different bounds for different regions of the
 $E$–
 $R$ parameter. While both estimate the second derivative of the vertical velocity, the estimates hold for different
 $L^p$ norms with Lemma 2.2 utilising a finer spectral analysis of the Greens function of (2.1b). More generally, Lemma 2.2 is a pointwise estimate in
 $z$, and Lemma 2.3 is an integral estimate over the whole domain.
Although rigorous demonstrations of the validity of the results at arbitrary  $Pr$ are not provided here, previous work in Tilgner (Reference Tilgner2022) outlines a strategy for extending bounds from
 $Pr=\infty$ to finite
 $Pr$ for RBC. The author achieves this under specific restrictions on
 $E$ and a numerical approximation of a Greens’ function, making the bound semi-analytic. A similar approach appears in Wang & Whitehead (Reference Wang and Whitehead2013) to extend bounds on RBC for stress-free boundaries from infinite
 $Pr$ to arbitrary
 $Pr$ in three dimensions (the proof in two dimensions being given in Whitehead & Doering Reference Whitehead and Doering2011b). The barrier to adapting to IHC is the lack of a maximum principle on the temperature of the form
 $\lVert T \rVert _\infty \leq c$, where
 $c=1$ for RBC. Proof of any maximum principle for IHC is unknown for any
 $L^p$ space. Therefore, at best, we can conjecture that akin to RBC, to highest order, the bounds in this work should hold for arbitrary
 $Pr$.
In considering turbulent convection subject to rotation, a question of interest is the behaviour in the limit of rapidly rotating convection. Rapidly rotating IHC could be investigated by taking the approach of the nhQG approximation (Julien et al. Reference Julien, Legg, McWilliams and Werne1996; Sprague et al. Reference Sprague, Julien, Knobloch and Werne2006; Julien et al. Reference Julien, Aurnou, Calkins, Knobloch, Marti, Stellmach and Vasil2016) to (2.1). It is worth noting that the bounds for the rapidly rotating limit in RBC apply to arbitrary  $Pr$, making the results relevant for geophysical flows. However, for geophysical applications, in addition to rapid rotation, IHC in spherical geometry is of importance. No rigorous study on the turbulent state of such a system is known, and any change in the bounds with a variation in the geometry is an intriguing avenue for future research.
For any result obtained with a bounding method, an important question is on the sharpness of the bounds. High-resolution numerical simulations can provide insight into the sharpness of the bounds in (1). A numerical study of the parameter space would provide valuable insight into the nature of heat transport in uniform rotating IHC, as no such data, numerical and experimental, exists to the best of the author's knowledge on IHC. Then, proof of better bounds, by moving away from quadratic auxiliary functionals, and hence the background field method, can also answer the question of sharpness. In general, mathematical improvements are obtained in one of two ways: either by changes to the variational problem, such that the expressions for the bounds and the spectral constraint change, or by novel estimates of the flow quantities. The latter method is more mathematically challenging, while the prior can be achieved with new physical insights. For example, given that additional constraints, such as minimum and maximum principles, improve bounds for convection (Otto & Seis Reference Otto and Seis2011; Arslan et al. Reference Arslan, Fantuzzi, Craske and Wynn2021b), it would be interesting to see if information about rotation can be exploited to construct a variational problem from (2.1), that yields better bounds. Beyond the relation between the  $R_L$ and
 $E$, a trait of rotating flows is the Taylor–Proudman theorem, which could form the basis of an additional constraint which improves the bounds. In addition, alternative auxiliary functionals might bear fruit in studying bounds on rotating convection. More concretely, the linear stability analysis reveals the importance of the vertical vorticity, and functionals that incorporate vorticity may provide insight into improved bounds, especially given the conjecture in Chernyshenko (Reference Chernyshenko2023) for the use of helicity in the auxiliary functional. Similar functionals appear in studies on nonlinear stability of rotating RBC (Galdi & Straughan Reference Galdi and Straughan1985; Giacobbe & Mulone Reference Giacobbe and Mulone2014).
As a final remark, recent work has highlighted novel results when the internal heating is non-uniform (Lepot, Aumaître & Gallet Reference Lepot, Aumaître and Gallet2018; Bouillaut et al. Reference Bouillaut, Flesselles, Miquel, Aumaître and Gallet2022; Song, Fantuzzi & Tobasco Reference Song, Fantuzzi and Tobasco2022; Arslan et al. Reference Arslan, Fantuzzi, Craske and Wynn2024). The change in the physics or bounds due to distributed heating or cooling would be an interesting future line of research. From the perspective of the PDE, extending the set-up in (2.1c) to arbitrary heating profiles would be the natural next step when studying bounds on the long-time behaviour of turbulence.

Acknowledgements
The author thanks Andrew Jackson for valuable discussions, insights and for commenting on the manuscript and Fabian Burnman for reading and commenting on the manuscript.
Funding
The author acknowledges funding from the European Research Council (agreement no. 833848-UEMHP) under the Horizon 2020 program and the Swiss National Science Foundation (grant number 219247) under the MINT 2023 call.
Declaration of interests
The author reports no conflict of interest.
Appendix A. Table of constants
For clarity in the proofs of the lower bounds on  ${\mathcal {F}}_B$ and
 $\overline {{\langle {T} \rangle }}$ ((4.47), (4.67), (5.23) and (5.34)), collated here are the constants that appear in the bounds. References to the precise equations where they appear are included.
Appendix B. Heuristics scaling arguments
Owing to the lack of data on uniform IHC subject to rotation, we cannot comment on the sharpness of the bounds proven. Instead, we can use standard physical arguments to determine possible scaling laws for  $\overline {{\langle {T} \rangle }}$ and
 ${\mathcal {F}}_B$. In previous studies, the theory of Grossman & Lohse (see Grossmann & Lohse Reference Grossmann and Lohse2000; Ahlers, Grossmann & Lohse Reference Ahlers, Grossmann and Lohse2009) has been adapted to uniform and exponentially varying IHC to determine scaling laws in the non-rotating case (Creyssels Reference Creyssels2020, Reference Creyssels2021; Wang, Lohse & Shishkina Reference Wang, Lohse and Shishkina2020). Here, we follow the heuristic arguments presented in Arslan et al. (Reference Arslan, Fantuzzi, Craske and Wynn2021b) that adapt the ideas of marginal stability and diffusivity-free scaling of Malkus (Reference Malkus1954) and Spiegel (Reference Spiegel1963). Heuristic arguments can be adapted to the rotating case to propose possible scaling laws for rotation-dominated convection (King et al. Reference King, Stellmach, Noir, Hansen and Aurnou2009; Aurnou et al. Reference Aurnou, Horn and Julien2020; Ecke & Shishkina Reference Ecke and Shishkina2023).
The starting point is to suppose that the heat fluxes out of the domain, defined in (1.1), can be written as  ${\mathcal {F}}_B \sim \overline {{\langle {T} \rangle }}/\delta$ and
 ${\mathcal {F}}_T \sim \overline {{\langle {T} \rangle }}/\varepsilon$. Once again,
 $\delta$ and
 $\varepsilon$ are the thermal boundary layer thicknesses at the bottom and top and are different sizes. In this section,
 $\sim$ means approximately equal to up to constants. Then, in the buoyancy and rotation-dominated regimes, we assume that to the highest order, the mean temperature is a function of the Rayleigh and Ekman numbers, more precisely
 \begin{equation} \overline{{\langle {T} \rangle}} \sim R^{-\alpha} \quad \text{and} \quad \overline{{\langle {T} \rangle}} \sim (R/R_L)^{-\gamma} = R^{-\gamma} E^{{-}4\gamma/3} , \end{equation}
where  $\alpha \in \mathbb {R}_+$ and
 $\gamma \in \mathbb {R}_+$ are exponents to be determined and we have substituted for
 $R_L$ with (3.15). The assumption (B1) is justified in the non-rotating case by numerical studies of
 $\overline {{\langle {T} \rangle }}$ (Goluskin Reference Goluskin2015, table 3.2 and references therein).
The two main regimes of buoyancy and rotation-dominated turbulent convection can be interpolated by varying the Rayleigh and Ekman numbers. However, in going from buoyancy to rotation-dominated heat transport, the thermal boundary layer will become larger than the Ekman boundary layer. However, first, we need to determine the behaviour of the thermal boundary layers. One possible argument, but by no means the only one, is the following. In the bottom boundary, heating balances diffusion, given that the flow is stably stratified. Then, heating over  $\delta$ is proportional to
 $\delta$ while diffusion scales as
 $\overline {{\langle {T} \rangle }}/\delta$, implying that
 $\delta ^2 \sim \overline {{\langle {T} \rangle }}$ and by the energy balance of
 ${\mathcal {F}}_T + {\mathcal {F}}_B = 1$ that
 $\delta ^2 \sim \varepsilon$. Stated in words, the upper thermal boundary layer scales as the mean temperature and is the square of the lower thermal boundary layer. The implication is that
 ${\mathcal {F}}_B \sim \overline {{\langle {T} \rangle }}^{1/2}$. Turning to the Ekman boundary layers, by standard arguments
 $\delta _E \sim E^{1/2}$ (Stevenson Reference Stevenson1979). Therefore, using (B1) and supposing
 $\delta \sim \delta _E$, the resulting algebraic equation gives
 \begin{equation} \gamma = \frac{3 \alpha}{3 - 4\alpha}. \end{equation}
The relationship in (B2) gives a range of possible scaling behaviours for the IHC as the flow transitions from buoyancy to rotation-dominated, and it then remains to determine  $\alpha$. If we first rearrange (B2) in terms of
 $\alpha$, we find that
 $\alpha = 3\gamma / (3+4\gamma )$. For
 $\gamma \rightarrow \infty$, then
 $\alpha \rightarrow \tfrac 34$, and the maximal exponent of
 $\alpha$ is
 $\tfrac 34$, but this does not correspond to any physical arguments and is ruled out by rigorous bounds (Lu et al. Reference Lu, Doering and Busse2004; Whitehead & Doering Reference Whitehead and Doering2011a).
It remains to determine  $\alpha$ to obtain the desired heuristic scaling laws. If we use the argument of marginal stability (Malkus Reference Malkus1954; Howard Reference Howard1963) to the unstably stratified upper thermal boundary layer,
 $\varepsilon$, we find that
 $\alpha =\tfrac 14$ and call this the classical exponent. If, instead, turbulent heat transport is independent of the fluid diffusivities and is given by a characteristic free-fall velocity (Spiegel Reference Spiegel1963), we find
 $\alpha = \tfrac 13$ and refer to this as the ultimate exponent. See Arslan et al. (Reference Arslan, Fantuzzi, Craske and Wynn2021b) for a detailed explanation of the exponents for IHC in the non-rotating case. Then, for
 $\alpha =\tfrac 14$ or
 $\tfrac 13$, using (B2) gives the following predictions in the buoyancy and rotation-dominated regimes,
 $$\begin{gather} \text{non-rotating}: \quad\overline{{\langle {T} \rangle}} \sim\begin{cases} R^{{-}1/4}, & \text{classical}, \\ R^{{-}1/3}, & \text{ultimate}, \end{cases} \end{gather}$$
 $$\begin{gather}\text{rotating}: \quad\overline{{\langle {T} \rangle}} \sim \begin{cases} R^{{-}3/8}E^{{-}1/2}, & \text{classical}, \\ R^{{-}3/5} E^{{-}4/5}, & \text{ultimate}, \end{cases} \end{gather}$$
and
 $$\begin{gather} \text{non-rotating}: \quad{\mathcal{F}}_B \sim \begin{cases} R^{{-}1/8}, & \text{classical}, \\ R^{{-}1/6}, & \text{ultimate}, \end{cases} \end{gather}$$
 $$\begin{gather}\text{rotating}: \quad{\mathcal{F}}_B \sim \begin{cases} R^{{-}3/16}E^{{-}1/4}, & \text{classical}, \\ R^{{-}3/10} E^{{-}2/5}, & \text{ultimate}. \end{cases} \end{gather}$$
While the classical regime for a rotating flow is not physically relevant (Ecke & Shishkina Reference Ecke and Shishkina2023), it appears in (B3b) and (B4b) for completeness.
As mentioned in the introduction, one can define a proxy Nusselt number as  $Nu_p = 1/\overline {{\langle {T} \rangle }}$. Furthermore, the temperature-difference-based Rayleigh number,
 $Ra$, appearing in studies of boundary-driven thermal convection, is related to the flux-based Rayleigh number,
 $R$, through the relation that
 $Nu_p = R/Ra$. Therefore, substituting for
 $R$ in the scaling laws (B3a) and (B3b) returns the known scaling laws for the Nusselt number in RBC of
 $Nu\sim Ra^{1/2}$ and
 $Nu \sim Ra^{3/2}E^2$ for the ultimate scaling. We comment on the heuristic scaling laws in § 6 and compare them with the bounds we prove in the subsequent sections.


 Open access

