

Introduction
Uteroplacental dysfunction and numerous stressors restrict nutrient exchange and placental clearance, causing intrauterine growth restriction (IUGR) and impaired fetal renal development.Reference Brenner1 IUGR as a result of placental insufficiency or impaired nutrition is accompanied by impaired renal development and lower nephron allotment in both humans and animal models.Reference Schreuder, Delemarre-van de Waal and van Wijk2 Over time, underdeveloped renal filtration capacity and oligonephropathy eventually progresses to renal microvascular diseases, renal hyperfiltration and hypertension through a cascade of physiological adaptations resulting in increased renin activity.Reference Wintour, Johnson and Koukoulas3
IUGR is seen in multifetal pregnancies, but the effects on renal development and long-term cardiovascular and renal outcome are not well described. Previous work supports that the smallest of human twins as adults may exhibit higher blood pressures,Reference Douglas-Denton, Moritz, Bertram and Wintour4 while other work describes similar and normal blood pressures in twin siblings.Reference Bergvall, Iliadou and Johansson5 No studies were found where blood pressures in higher order multiples were examined. In the last 25 years, the incidence of twin pregnancies has risen by 70% and higher order multifetal gestations by 400%,Reference de Geus, Posthuma, Ijzerman and Boomsma6 such that 3% of all US births are now IUGR babies delivered from multifetal gestation pregnancies.Reference Eriksson, Sartono and Martins7 Thus, evaluating the impact of dysfunctional placental and fetal physiology during multifetal pregnancies is critical for understanding short-term and long-term outcomes, such as adult hypertension. Additionally, women with uterine anomalies exhibit placental physiology that is similar to that seen in multifetal gestation pregnancies, with limited space for placental formation and fetuses that develop IUGR.Reference Romo, Carceller and Tobajas8 Current practices in assisted reproductive technologies have greatly increased rates of both fertilityReference Reichman, Laufer and Robinson9 and multifetal pregnancy in those with uterine anomalies.Reference Romo, Carceller and Tobajas8 However, it is unknown whether IUGR babies born to women with uterine anomalies experience impaired renal development, hyperfiltration or ultimately adult hypertension.
Our previously published worksReference Meyer, Koch, Ramadoss, Kling and Magness10, Reference Sun, Habeck and Meyer11 are the first to study the interactive effects of multifetal gestation and uterine anomaly on organ development. We observed asymmetric IUGR, with kidney size proportionate to fetal weight,Reference Meyer, Koch, Ramadoss, Kling and Magness10 similar to that seen in severe placental insufficiency or nutritional deficiency-induced IUGR.Reference Morrison12 The current study extends these findings to examine whether placental dysfunction in multifetal gestation and/or uterine structural anomalies was sufficiently severe to disrupt fetal tissue oxygenation, alter metabolic adaptations and fetal intravascular volume, and/or impair fetal renal development and function. In sheep, cessation of the nephrogenic zone occurs at 80% of term gestation, mirroring that of humansReference Morrison12 and making the ovine model ideal for studying in utero environmental influences on renal development. Therefore, we hypothesized that limited uterine space causes fetoplacental metabolic adaptations that preserve a viable but compromised fetus with maladaptive renal development and function.
Method
Animals
Animal protocols were reviewed and approved by the University of Wisconsin (UW) – Madison Research Animal Care and Use Committees. Ewes of mixed Western breeds (n = 32) were group housed and fed a mixture of hay and corn silage that met daily NRC feed requirements of pregnant sheep. Surgical and synchronization procedures were described by Sun et al.Reference Sun, Habeck and Meyer11 Ewes were randomly assigned to one of two treatments; unilateral uterine horn ligation to limit uterine space for placental development or no ligation employing the same cohort of animals described in Sun et al.Reference Sun, Habeck and Meyer11 Unilateral ewes underwent complete disconnection of a single uterine horn and intercornual vascular connections at least 2 months before breeding to a fertile ram. A subset of ewes assigned to the unilateral group underwent an ipsilateral oviductal ligation to prevent implantation in the ligated horn. The nonrestricted (NSR) singleton fetuses from intact and unilateral ewes were both included in the NSR group. In intact ewes, placentomal implantation may have been in more than one horn. All uterine space restricted (USR) fetuses were multifetal pregnancies and the average number of pregnancies per horn was 1.6. A synchronization protocol was performed using an intravaginal controlled internal drug release (Progesterone CIDR; 0.3 g; Pfizer, Aukland, New Zealand) for 10–14 days, followed by intramuscular prostaglandin F2α (15 mg; Pfizer) and equine chorionic gonadotropin (500 IU; EMD Biosciences, San Diego, CA, USA) injections.Reference Meyer, Koch, Ramadoss, Kling and Magness10 Pregnancy was confirmed by ultrasound by gestational day (GD) 60.
Fetal tissue and blood collection
Nonsurvival surgery was performed on either GD120 (120.4, range 117–124; n = 16) or GD130 (129.9, range 125–134; n = 16; term 147 days) under sodium pentobarbital (50 mg/ml). Heparinized blood from fetal umbilical vein and artery was collected before euthanasia and centrifuged for 10 min at 3600 × g at 4°C. Fetal kidneys were weighed and frozen (−80°C). Umbilical venous (UV) blood was analyzed for blood gasses (RapidLab 248; Bayer AG, Leverkusen, Germany), oxygen content (OSM2 Hemoximeter; Radiometer Medical ApS, Brønshøj, Denmark) and hematocrit (pocH-100i-Sysmex, Mundelein, IL, USA). A metabolic panel was measured on the plasma within hours in the Meriter Hospital Clinical Chemistry Laboratory (Cobas Integra 800; Roche, NY, USA). Stored UV plasma was measured for iron binding capacity (transferrin) by total iron binding capacity (TIBC) via a ferrozine method (Thermo Scientific, Middletown, VA, USA). Transferrin was calculated by dividing TIBC by two converted to mg/dl.Reference Fomon13 Umbilical artery plasma erythropoietin (Epo) was assessed by a sensitive radioimmunoassay utilizing sheep Epo standards.Reference Widness, Garcia and Clemons14 Osmolarity was calculated as 2[Sodium] + 2[Potassium] + [Glucose] + [BUN] plasma levels in mmol/l.
Morphometry
Twins were excluded a priori in order to evaluate extremes of uterine space. Utilizing placentome number, total placentome weight per fetus and number of fetuses per horn, as the proxy to measure fetal nutrient delivery,Reference Meyer, Koch, Ramadoss, Kling and Magness10 fetuses were grouped as NSR: only one fetus per horn, nonunilateral singleton fetuses (n = 9) and unilateral singletons (n = 13) or as USR: more than one fetus per horn, USR: nonunilateral triplets (n = 21), nonunilateral quadruplets (n = 4), and unilateral triplets (n = 6).Reference Meyer, Koch, Ramadoss, Kling and Magness10, Reference Sun, Habeck and Meyer11 Table S1 in the Supplement describes the groups in detail. Weight, abdominal girth and crown-rump length were determined and BMI [fetal weight (kg)/crown rump (m2)] was calculated. Fetal kidneys were collected, weighed, fixed in 10% buffered formalin, and embedded in paraffin, with 10 μm sections stained with hematoxylin and eosin (H&E) and Gomori trichrome (Sigma-Aldrich, St. Louis, MO, USA).
Microscopic morphometry
General histological architecture was reviewed with a consulting pathologist. Digital photomicrographs with a SPOT Insight Camera (Diagnostic Instruments, Sterling Heights, MI, USA) were taken using a Nikon Eclipse 50i microscope (Melville, NY, USA). Images were photo stitched together using Adobe Photoshop CS2 and CS3 (Adobe Systems Inc., San Jose, CA, USA). On mid-sagittal sections confirmed by Columns of Bertin, a blinded reviewer studied general histological architecture and point counted the maculae densa cells. Morphometry was determined using SPOT Advanced software (Diagnostic Instruments) or Adobe Photoshop CS3. Mean glomerular generations were counted on mid-sagittal sections from eight ×10 cortical fields by drawing parallel lines perpendicular to a mid-kidney medullary ray from corticomedullary junction to the capsule, with a line traversing every glomerulus.Reference Rodriguez, Gomez and Abitbol15, Reference Drake, Sauerbry, Blohowiak, Repyak and Kling16 Mean glomerular area density (average glomerular area in μm2 per area of cortex in μm2) and mean cortical depth were determined with eight ×10 fields. Mean glomerular planar surface area (μm2) was determined by outlining all identifiable glomeruli, excluding the Bowman's space in the eight fields. Presumed glomeruli under 250 μm2 were excluded from analysis because smaller glomeruli could not definitively be identified at ×10 magnification and because it was assumed that the section was at the periphery of the glomerulus. Maculae densa were imaged at ×40 and exhaustive point counting of number of nuclei in each identifiable maculae densa within the section was performed. Additionally, surface areas of the combined tubular and columnar cells of the maculae densa and maculae densa lumen area were measured. The presence of an active nephrogenic zone was blindly determined by identifying the presence or absence of immature C- and S-shaped bodies in the capsule and reported based on the gestational age.
Statistical analysis
Statistical analyses were performed using Student's t-test, two-way ANOVA followed by Student–Newman–Keuls post hoc testing, and simple linear regression. Fisher's exact testing was used to analyze completion of nephrogenesis. Data were presented as means ± s.e.m. P < 0.05 was considered significant.
Results
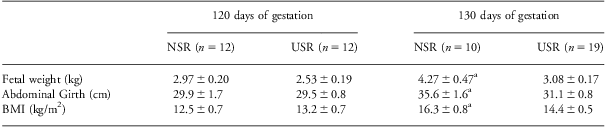
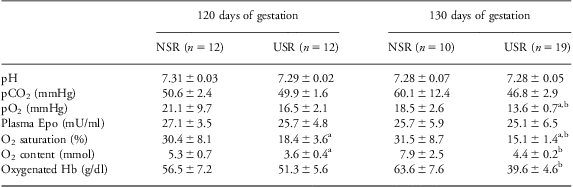
The four treatment groups included both male and female fetuses. Although no significant sex differences in morphometric parameters and blood chemistries were observed, a type II error cannot be excluded. Fetal weights in this cohort, previously reported,Reference Sun, Habeck and Meyer11 were 28% lower (P < 0.05) in USR v. NSR fetuses at GD130, with fetal growth arrest observed between GD120 and 130 in USR (Table 1). As previously reported in the larger cohort,Reference Meyer, Koch, Ramadoss, Kling and Magness10 USR fetuses at GD130 from this cohort also exhibited reduced placental efficiency; insufficient placental clearance of cholesterol (P < 0.001) and insufficient nutrient exchange with greater maternal-to-fetal ratio of triglycerides (P < 0.05) and a trend for greater maternal-to-fetal ratio of glucose (P = 0.06). Umbilical venous pH and pCO2 were not different between groups (Table 2). Fetal plasma Epo levels in USR did not differ from NSR groups at either gestational age. However, USR fetuses exhibited 26% lower pO2, 52% lower O2 saturation, 44% lower O2 content, and 38% lower oxygenated Hb (P < 0.05 for all) than NSR fetuses at GD130 (Table 2).
Fetal morphometric parameters in NSR and USR fetuses at GD120 and GD130Reference Meyer, Koch, Ramadoss, Kling and Magness10
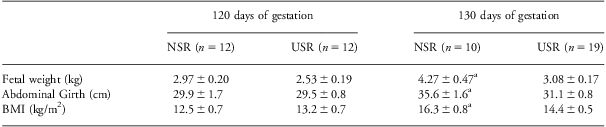
BMI, body mass index (fetal weight (kg)/crown rump (m2)).
Data shown are means ± s.e.m. Fetal weight measures for this cohort were previously included in Sun et al.Reference Sun, Habeck and Meyer11 The data include values for abdominal girth and BMI that are a smaller subset of a much larger cohort previously reported in Meyer et al.Reference Meyer, Koch, Ramadoss, Kling and Magness10
aSignificant difference (P < 0.05) as compared with NSR at gestational day (GD)120.
Fetal oxygenation parameters in NSR and USR fetuses at 120 and 130 days of gestation
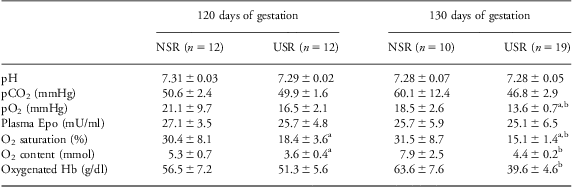
Data shown are means ± s.e.m. Umbilical vein pH, pCO2, pO2, O2 saturation, O2 content and oxygenated hemoglobin (Hb) and umbilical arterial plasma erythropoietin (Epo) levels were obtained.
aSignificant difference (P < 0.05) as compared with NSR at gestational day (GD)120.
bSignificant difference (P < 0.05) as compared with NSR at gestational day (GD)130.
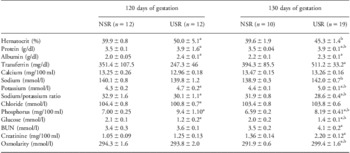
Fetal blood chemistries used to assess placental and fetal excretory renal function are shown in Table 3. At GD120, hematocrit, plasma total protein and plasma albumin concentrations were 25%, 11% and 20% higher (P < 0.05) in USR v. NSR, respectively. At GD130, hematocrit and plasma total protein (P < 0.05), but not albumin, remained higher in USR than NSR.
Fetal blood chemistry parameters in NSR and USR fetuses at GD120 and GD130

BUN, blood urea nitrogen.
Data were means ± s.e.m., in umbilical venous blood. The values for glucose, BUN, and creatinine are a smaller subset of a larger cohort previously published.Reference Meyer, Koch, Ramadoss, Kling and Magness10
aSignificant difference (P < 0.05) as compared with NSR at gestational day (GD)120.
bSignificant difference (P < 0.05) as compared with NSR at gestational day (GD)130.
Plasma transferrin levels in USR doubled (P < 0.05) between GD120 and GD130, which accounts for 30% of the protein elevation at GD130. Plasma chloride in USR was 3.6% lower than NSR at GD120 (P < 0.05), returning to baseline by GD130. Additionally, plasma levels of potassium, phosphorus, and creatinine were 9%, 34% and 20% higher, respectively (P < 0.05) in USR than NSR at GD120. In USR at GD130, plasma levels of potassium, phosphorus and creatinine remained higher, 14%, 24% and 60%, respectively (P < 0.05) than NSR. The ratio of plasma sodium/potassium was lower in USR than NSR at both gestational groupings (P < 0.05). Glucose in USR was 43% lower at GD120 than NSR, becoming 30% lower than NSR at GD130. At GD130, BUN in USR became 17% higher than NSR (P < 0.05). Although there was no difference at GD120, plasma osmolarity at GD130 was higher in USR than NSR (P < 0.05). The values for glucose, BUN and creatinine in this cohort were also included in the larger cohort that was previously reported.Reference Meyer, Koch, Ramadoss, Kling and Magness10
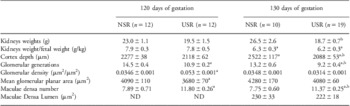
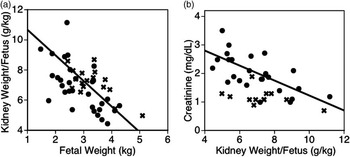
As observed with fetal body weight, fetal kidney growth in the USR group was arrested during the study period; USR kidneys were 29% lighter than NSR at GD130 (P < 0.05) (Table 4). Of note, the ratio of kidney weight/fetal weight (g/kg) was lower (P < 0.05) with increasing gestation, but USR and NSR groups within a gestational grouping did not differ. With all fetal data combined, kidney size was not related to fetal umbilical vein pO2 or other indices of oxygenation. Regardless of fetal age or grouping, an indirect relationship between the kidney weight/fetal weight (g/kg) and fetal weight was observed; therefore the graph includes data from both NSR and USR (R 2 = −0.337, P < 0.001) (Fig. 1a). Most fetuses in the lowest quartile of this ratio were in the USR group. Fetal plasma creatinine was indirectly related to kidney weight/fetal weight (R 2 = −0.379, P < 0.0001), with NSR included in the figure because, although not significant on its own, inclusion strengthens the overall relationship (Fig. 1b). The elevation in creatinine coupled with the body and kidney growth arrest between 120 and 130 days of gestation demonstrates an excretory functional deficit in kidney development.
Fetal renal changes in NSR and USR fetuses at GD120 and GD130

ND, not done.
Data are means ± s.e.m. Generation lines were drawn on a ×10 fields perpendicular to medullary ray, ensuring all glomeruli pass through a line. Glomerular area density is determined as μm2 of glomeruli to μm2 of cortex. Mean glomerular planar area measures average glomeruli size. Maculae densa number includes specialized columnar cells adjacent to the glomerular tuft. Maculae densa lumen includes tubule lumen lined by the maculae densa.
aSignificant difference (P < 0.05) as compared with NSR at gestational day (GD)120.
bSignificant difference (P < 0.05) as compared with NSR at gestational day (GD)130.
Relationships between fetal kidney weight, body weight and renal function. NSR (X) and USR (solid circles) fetuses are both shown in the figure. (a) In fetuses at both GD120 and GD130, weight of kidneys expressed proportionate to body weight (g/kg) on vertical axis was inversely proportional to fetal weight (kg) on horizontal axis (F = 28.67, R 2 = −0.38, P < 0.0001). The figure includes both groups. The relationship between these variables in NSR is equal in strength to that of USR, and the relationship strengthened by including NSR samples, and with minimal change in the line of identity. (b) In fetuses at both GD120 and GD130, fetal plasma creatinine (mg/dl) on the vertical axis was indirectly related to weight of kidneys expressed proportionate to body weight (g/kg) on horizontal axis (F = 14.75, R 2 = −0.337, P < 0.001). The figure includes both groups. Although the observed relationship in NSR alone is not significant (P = 0.055), the relationship is strengthened by including NSR samples, and with minimal change in the line of identity.

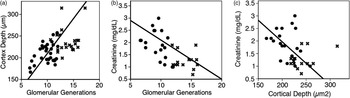
We examined nephrogenesis using microscopic morphometric measurements and found that they indeed were consistent with these macroscopic morphometric and functional findings. Kidney cortical depth was unaltered in USR at GD120, but increased only in the NSR controls (11%) by 130 days such that in the USR kidneys cortical depth was reduced 17% (P < 0.05), compared with NSR. Moreover, compared with NSR fetuses, the USR group had 25% and 30% fewer (P < 0.05) glomerular generations at GD120 and 130, respectively. Mean glomerular size did not differ and no small sclerotic glomeruli were found in either group. In the combined group of naturally growth-restricted and surgically growth-restricted, a super-restricted group emerges, those triplets gestated in a single uterine horn and the quadruplet set. This super-restricted group was similar to the larger group of USR in most parameters studied, except that it exhibited lower oxygenation indices accompanied by fewer glomerular counts (P < 0.05 for both). Fig. 2a shows a direct relationship between cortical depth and the number of glomerular generations, R 2 = +0.293, P < 0.0001. Glomerular generations were inversely related to fetal plasma creatinine (g/dl), R 2 = −0.461, P < 0.0001 (Fig. 2b). A similar inverse relationship between plasma creatinine and cortical depth was seen, R 2 = −0.461, P < 0.0001 (Fig. 2c). The relationships between glomerular generations, cortical depth and creatinine was investigated including both USR and NSR, because although the relationships in NSR group were not individually significant, using NSR strengthened the linear relationships established within the USR group. In USR fetuses, glomerular density as expressed by glomerular area/cortical area was higher in USR at GD120, decreasing by 27% between GD120 and GD130 (P < 0.05).
Relationship between fetal microscopic morphometry and renal function. NSR (X) and USR (solid circles) are both shown in the figure. (a) In fetuses at both GD120 and GD130, cortical depth (μm2) on vertical axis was directly related with glomerular generations on horizontal axis (F = 20.67, R 2 = +0.293, P < 0.0001). The figure includes both groups. Although the relationship in NSR only is not significant (P = 0.5), the line of identity is strengthened and better defined by inclusion of the NSR samples. (b) In fetuses at both GD120 and GD130, fetal plasma creatinine (g/dl) on the vertical axis was indirectly related with glomerular generations on the horizontal axis (F = 23.90, R 2 = −0.461, P < 0.0001). The figure includes both groups. Although the relationship in NSR only is not significant (P = 0.16), the line of identity is strengthened and better defined by inclusion of the NSR samples. (c) In fetuses at both GD120 and GD130, fetal plasma creatinine (g/dl) on the vertical axis was indirectly related with cortical depth (μm) on the horizontal axis (F = 14.31, R 2 = −0.338, P < 0.001). The figure includes both groups. Although the relationship in NSR is not significant (P = 0.9), the line of identity is strengthened and extended by inclusion of the NSR samples.

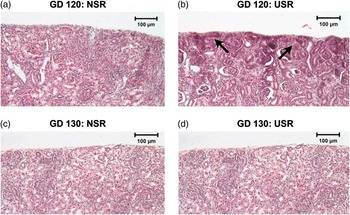
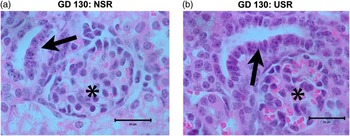
As shown in Fig. 3, at GD120, the nephrogenic zone with S- and C-shaped bodies was active in USR, with relatively more immature glomeruli than NSR. Blinded visual assessment showed the depletion of the nephrogenic zone in all NSR fetuses by GD122, but the zone was active in seven of 35 USR fetuses past GD122, P < 0.05. By GD130, nephrogenesis was complete in both NSR and USR groups, with normalization of mean glomerular surface area measurement over time in USR. We found only subtle qualitative differences in fetal renal histological vasculature, epithelium, interstitial connective tissue and degree of tubular vacuolization near the corticomedullary junction in USR on review of random USR and NSR kidney slides with the consulting pathologist. However, histological variation between the groups was greatest in the maculae densa, which are the specialized osmoreceptor cells. These cells were visually hypertrophic, and point counting showed hyperplasia, P < 0.05, in USR fetuses compared with NSR, although luminal size was not quantitatively larger, P > 0.05 (Fig. 4, Table 4). The sum of the previously described functional changes coupled with these histological changes implies pathophysiological and maturational adaptation of the renal cortex.
Nephrogenic zone in nonrestricted (NSR) and restricted (USR) kidneys at GD120 and GD130. Shown are representative examples of renal capsular areas in Gomori trichrome stain sections. Bars indicate 100 μ. (a) GD120 NSR, (b) GD120 USR, (c) GD130 NSR and (d) GD130 USR kidneys at ×20 demonstrating that S- and C-shaped bodies of the active nephrogenic zone were common in the GD120 USR fetuses (arrows), but not in the NSR group. By GD130, nephrogenesis was complete in both NSR and USR groups.

Glomeruli and maculae densa in NSR and USR kidneys at GD130. Shown are representative H&E examples. Bars indicate 25 μ. (a) GD130 NSR and (b) GD130 USR fetuses at ×100 demonstrating glomeruli (asterisk) greater numbers of cells in the maculae densa (arrows) as seen by quantitative point counting, P < 0.05.

Discussion
This study is the first to show that fetal growth, metabolism, renal development, and endocrine and excretory renal function are impaired in a model that limits the amount of uterine space available for placental attachment. Owing to the rising incidence of multifetal gestation pregnancies and increased use of assisted reproductive technologies in women with uterine anomalies,Reference Eriksson, Sartono and Martins7, Reference Reichman, Laufer and Robinson9 it is clinically important to study whether adaptations in renal development and programming in space restriction are comparable with that seen in other causes of IUGR. The current work also adds to our previous understanding of placental inefficiency during late gestation multifetal gestation and/or uterine anomalies.Reference Reichman, Laufer and Robinson9, Reference Neuman and Unal17 Plasma chemistries in USR paralleled those seen with plasma volume contraction after either bilateral fetal nephrectomy or hypernatremic dehydration in ewes.Reference Gibson and Lumbers18, Reference Ross, Desai, Guerra and Wang19 USR-induced insufficiency in fetal renal function was accompanied by an immature endocrine Epo response to hypoxemia and a structurally immature nephrogenic zone as apparent adaptations with placental inefficiency, hypoxemia and disturbed fetal plasma volume.
In USR, we previously reported growth arrest between days 120 and 130 (0.8–0.9 human gestational equivalent) and evidence for reduced placental efficiency, with poorer cholesterol clearance, and nutrient exchange,Reference Meyer, Koch, Ramadoss, Kling and Magness10 but we now expand upon the work to show progressive deterioration in oxygenation as pregnancy progresses. These findings are hallmarks of singleton human placental insufficiency-induced IUGR,Reference Nicolaides, Thilaganathan and Mibashan20 and of the smaller fetus of a discordant growth-restricted multifetal pregnancy.Reference Jensen21
Contrary to our hypothesis, higher hematocrits and poorer oxygenation indices in USR fetuses were not associated with Epo stimulation, despite oxygenation levels that stimulated Epo in comparably aged, normally grown sheep fetuses.Reference Gagnon, Harding and Brace22 Fetal plasma Epo levels are derived predominantly from the liver where the most highly oxygenated placental blood enters the fetal circulation, rendering it relatively insensitive to mild hypoxia.Reference Widness, Garcia and Clemons14, Reference Tan, Eckardt, Firth and Ratcliffe23 In moderate hypoxia, fetal kidney contributes to Epo levels, making higher circulating Epo levels not merely a biomarker of hypoxia, but also a reflection of renal Epo availability for renal protection.Reference Stojanovic, Vuckovic and Spasojevic24, Reference Moore and Bellomo25 High cellular iron inhibits Epo production.Reference Kling, Dragsten and Roberts26 It is likely that high renal iron concentrations that we reported in this cohort of growth-restricted USR fetusesReference Sun, Habeck and Meyer11 directly inhibited Epo production, and although it is unknown why kidney iron levels were so high in USR,Reference Sun, Habeck and Meyer11 angiotensin II can promote renal iron accumulation.Reference Saito, Ishizaka and Aizawa27–Reference Smith and Thevenod29
The combination of higher hematocrits in the absence of elevated Epo levels or evidence of increased erythropoiesis was a novel finding. Thus we suggest an alternative explanation of hemoconcentration, because the higher hematocrits, total protein and albumin levels in USR at GD120 could be the result of decreased fetal volume because of a reduction in plasma water and electrolytes. We previously reported that placentomes were 41% heavier,Reference Meyer, Koch, Ramadoss, Kling and Magness10 supporting a fetal-to-placental fluid shift from low intravillous pressure that may temporarily contract fetal plasma volume, followed by a more chronic adaptation. The current study shows that the higher osmolarity observed at GD130 in USR is possibly due to shift or loss of water,Reference Sebire, Jain and Talbert30 through as yet an unknown mechanism, but renin is a known regulator of placental fluid shifts.Reference Yoshimura, Magness and Rosenfeld31 Findings in USR fetuses were strikingly similar to previous work showing generation of organic osmoles in sheep fetusesReference Ross, Desai, Guerra and Wang19, Reference Wang, Chen and Kallichanda32 or ratsReference Mansano, Desai, Garg, Choi and Ross33 born after maternal hypernatremic dehydration. These comparisons are notable because both sheep and rat offspring experienced permanently altered salt and water balance and higher blood pressure.
Persistently elevated plasma protein was found in USR fetuses, a finding explained in part by elevated plasma transferrin, the major iron binding protein. Transferrin normally rises with iron deficiency, but we previously reported normal liver iron and higher kidney iron concentrations in USR.Reference Sun, Habeck and Meyer11 Interestingly, higher salt concentrations upregulate expression of transferrin-like proteins,Reference Fisher, Gokhman, Pick and Zamir34 supporting a nontraditional role for transferrin in the fetal adaptation to IUGR.
In addition to placental inefficiency,Reference Meyer, Koch, Ramadoss, Kling and Magness10 the current data support fetal renal dysfunction contributing in part to the electrolyte disturbances in USR fetuses. Although not necessary for survival, the fetal kidney serves an important excretory function during the last trimester. To our knowledge, this is the first description of this constellation of fetal blood chemistry data in any model of placental insufficiency IUGR. We noted higher plasma levels of potassium, phosphate and creatinine, combined with lower plasma chloride that were consistent with bilateral fetal nephrectomyReference Douglas-Denton, Moritz, Bertram and Wintour4, Reference Gibson and Lumbers18, Reference Moritz and Wintour35 or postnatal renal insufficiency.Reference Gibson and Lumbers18 In particular the normal plasma calcium is notable because calcium is controlled by the placenta and not by fetal kidney.Reference Gibson and Lumbers18
Consistent with other models of asymmetric IUGR, the current model produced smaller kidneys, with histology supporting a lower glomerular allotment. No relationship was seen between oxygenation and relative fetal kidney size, inconsistent with chronic placental restriction models of IUGR.Reference Botting, Wang and Padhee36 However, the kidney may be relatively protected from decreased nutrient delivery as we observed an inverse relationship between relative kidney weight and fetal weight. At GD130, mean relative kidney weight was lower than at GD120; however this linear inverse relationship was sustained when examining the smaller subset of fetuses from GD130. The best fit defined the relationship as linear and partially consistent with the ovine placental restriction model from McMillen et al. that found a ‘hockey stick’ relationship where the relative kidney weight was constant until the most severe growth restriction that exhibited an inverse relationship.Reference McMillen, Adams and Ross37 Our ovine model lowered caruncle numbers by 50%, while the previous study had more severe placental restriction, leaving only four attachment positions.Reference McMillen, Adams and Ross37 Difference in study design, differences in gestational age or limitations because of sample size could explain why our study differs from that of McMillen et al.Reference McMillen, Adams and Ross37 However, after further investigation of the morphology and function of the kidney, we found an inverse linear relationship between relative kidney weight and fetal plasma creatinine, supporting the notion that fetal excretory renal function was progressively impaired as the ratio of kidney weight/fetal weight fell. Although we cannot eliminate the possibility of a more complex relationship rather than a linear model, our inclusion of NSR strengthens and extends the linear relationship between relative size and function. The line of regression also describes the relationship when examining the only most mature subset (GD130). Higher fetal creatinine, normally a by-product of muscle tissue, was unlikely because of increased muscle metabolism in the relatively smaller USR fetuses.
These structural and functional findings are supported by microscopic findings. We found no substantial differences in interstitium, vascularity, vascular smooth muscle, collagen, but no quantitation was performed. However, changes that normally become distinct in the postnatal period that coincides with greater renal blood flow and kidney filtration cannot be ignored. As expected glomerular generations, cortical depth and excretory function were interrelated. Although exhaustive nephron counting or the dissector/fractionator counting methodReference Bertram38 was not employed, these findings were consistent with lower glomerular allotments in other etiologies of IUGR.Reference Morrison12 Decreased allotment was previously reported in twin sheep,Reference Mitchell, Louey, Cock, Harding and Black39, Reference Muhle, Muhle and Amann40 with male twins more likely to exhibit renal hyperfiltration and hypertension.Reference Bagby41 Sex-specific differences in lifelong renin–angiotensin signaling were reported in IUGR, predisposing males to rapid postnatal growth, adult obesity and hypertension.Reference Bagby41, Reference Moritz, Cuffe and Wilson42 This ‘2-hit hypothesis’ states that lower nephron allotment combined with increased excretory demand from obese body mass may exceed nephron excretory capacity and begin the inflammatory pathological cascade that ultimately leads to hypertension.
In addition to deficits in USR renal structure and function, a maturational remodeling or adaptation of nephrogenesis was also seen. We found that the relative proportion of cortex taken up by glomeruli (glomerular density) was greater in USR at GD120, probably because of relatively more dense immature glomeruli near the active nephrogenic zone. By GD130, as the glomeruli become more evenly distributed, we found a partial, but incomplete normalization of cortical depth. Delayed maturation of the nephrogenic zone is a phenomenon previously described in sheep, but only after fetal unilateral nephrectomy abruptly cut glomeruli in half.Reference Douglas-Denton, Moritz, Bertram and Wintour4 Relatively little is understood about mechanisms controlling timing of maturation of the nephrogenic zone.Reference Pesce43 In sheep, massive carunclectomyReference Zhang, Lumbers and Simonetta44 inhibited intrarenal renin signaling during nephrogenesis and created histological defects similar to that seen after pharmacological blockade of angiotensin II.Reference Daikha-Dahmane, Levy-Beff, Jugie and Lenclen45 Juxtaglomerular renin release is regulated by specialized osmoreceptors, the maculae densa, cells that differentiate within the C-shaped bodies of the nephrogenic zone. Maculae densa undergo hypertrophy with greater osmolarityReference Komlosi, Fintha and Bell46 and can also be stimulated to undergo hyperplasiaReference Razga and Nyengaard47 as found in our study. Prolongation of active nephrogenesis could alter maculae densa cell structure, as one previous study of IUGR fetuses found visually larger maculae densa,Reference Zohdi, Moritz and Bubb48 but methods in the current study were not able to show differences in surface areas of either the maculae densa cell mass or its lumens during late fetal life.
In conclusion, the model of limited uterine space for placental development has advanced the field because it shows the combination of inefficient placental nutrient transport and fetal excretory function, immature endocrine renal function, and altered programming of renal development. Fetal biochemical alterations in USR multifetal gestation are similar to that in hypernatremic dehydration or bilateral fetal nephrectomy, supportive of plasma volume contraction and then subsequent adaptations in renal function, structure and maturation. These findings are clinically relevant because of the rising incidence of space-restricted pregnancies due to higher order multifetal gestations alone and/or in the presence of uterine anomalies. The current model enabled us to study novel fetal intravascular fluid adaptations that together, appear fundamentally central to preserve the viable albeit compromised pregnancy. Future studies employing the current model warrant in depth mechanistic examination of these renal adaptations.
Acknowledgments
Manuscript preparation assistance was provided by Sheikh Omar Jobe, Timothy J. Morschauser, and Mayra B. Pastore. Technical support was provided by the Don B. Singer MD, Magness laboratory (Jason L. Austin, Kreg M. Grindle, Gladys E. Lopez, and Terrance M. Phernetton), the Kling laboratory (Patrick J. Halbach and Jason M. Habeck) and Todd A. Taylor at the University of Wisconsin Arlington Farm Facility. Plasma Epo levels were analyzed by John A. Widness and Robert L. Schmidt. This work is in partial fulfillment of the M.S. degree of KMM-G for the Endocrinology and Reproductive Physiology Training Program and PhD degree of MYS in the Interdepartmental Graduate Program in Nutritional Sciences.