Introduction
Dairy cows typically enter a state of negative energy balance (NEB) post partum, when the combined energy requirements for maintenance and milk production exceed dietary energy intake. This energy deficit arises because cows generally achieve peak milk production at an earlier stage than maximal feed intake (Veerkamp, Reference Veerkamp1998). The shortfall in dietary intake is met by increased mobilization of body reserves in support of lactation, which occurs through coordinated adaptation of metabolism across several body tissues (Bauman, Reference Bauman2000).
The magnitude and duration of NEB is dependent on the direct and interactive effects of numerous factors including genotype, plane of nutrition and body condition score (BCS) at calving. Consequently, there is considerable variation in the degree of energy deficit experienced by individual cows, both within and between studies. Genetic selection for increased milk yield has resulted in cows that are predisposed to more severe NEB, as the correlated response in feed intake to selection accounts for only approximately 45% to 65% increase in milk yield (Veerkamp, Reference Veerkamp1998). A negative genetic correlation consequently exists between BCS and genetic merit for milk yield (Berry et al., Reference Berry, Buckley, Dillon, Evans, Rath and Veerkamp2003).
There is compelling evidence of a negative genetic correlation between milk production and fertility performance (Hansen, Reference Hansen2000). Though the precise mechanisms remain unresolved, increasing NEB and altered partitioning of dietary energy have been cited as being detrimental to reproductive efficiency (Butler, Reference Butler2003). This is further intimated by negative genetic correlations identified between BCS and fertility performance (Pryce et al., Reference Pryce, Coffey and Simm2001). Strain comparison studies in New Zealand and Ireland have reported lower milk volume, higher BCS throughout lactation and superior reproductive performance for the New Zealand Holstein Friesian (NZ) compared with North American Holstein Friesian (NA) (Harris and Kolver, Reference Harris and Kolver2001; Horan et al., Reference Horan, Mee, O’Connor, Rath and Dillon2005b). The NA strain has been selected for increased milk yield, body size and angularity in a production system based on year-round calving and high levels of concentrate supplementation, with little emphasis on traits such as fertility. The NZ strain has been selected for increased milk solids yield and improved fertility and survival in a pasture-based production system (Horan et al., Reference Horan, Dillon, Faverdin, Delaby, Buckley and Rath2005a). The strain comparison model provides a framework for examining the effects of divergent genetic selection programmes within the Holstein Friesian on EB and nutrient partitioning. The objective of the current study was therefore to characterize the EB, nutrient partitioning and metabolic profiles of the NA and NZ strains, which differ in genetic merit for milk production.
Material and methods
Animals and experimental design
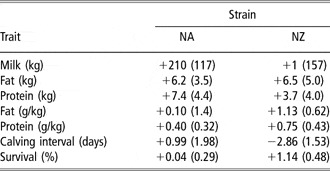
In all, two groups of 10 spring-calving, multiparous Holstein Friesian cows were selected from the NA and NZ groups of the Moorepark strain comparison study (Horan et al., Reference Horan, Dillon, Faverdin, Delaby, Buckley and Rath2005a). The origins and establishment of the experimental groups from which the cows were selected have been previously described by Horan et al. (Reference Horan, Dillon, Faverdin, Delaby, Buckley and Rath2005a). The NA strain was developed by mating the top 50% of cows in Moorepark (based on a pedigree index for milk production) with five NA Holstein Friesian sires, selected as the highest available in Ireland for pedigree index for milk production. The NZ strains were imported as embryos from New Zealand and implanted into Holstein heifers. These embryos were generated by mating high-genetic-merit NZ Holstein Friesian cows with five high-genetic-merit NZ Holstein Friesian sires (based on Breeding Worth; the New Zealand genetic evaluation system). The experimental animals used in the current study were selected from the existing NA and NZ treatment groups involved in the Moorepark strain comparison study (Table 1). Mean calving dates were 25th February (s.d. 18 days) for the NA group and 2nd March (s.d. 17 days) for the NZ group.
Genetic merit of the North American (NA) and New Zealand (NZ) strains of Holstein Friesian based on predicted differencesFootnote 1 and standard deviations (s.d.) for milk production, calving interval and survival

1 All predicted differences obtained from the February 2004 international evaluations of the INTERBULL Animal Centre (Uppsala, Sweden).
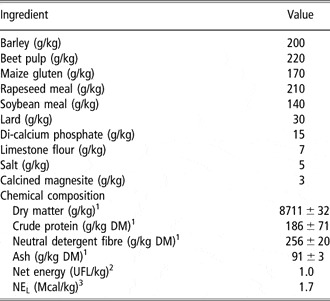
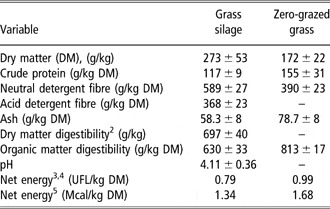
The cows were housed in a freestall barn from 3 weeks prior to the expected calving date, with the treatment groups sharing common accommodation space. The cows were trained to use the Griffith Elder feeding system (Griffith Elder Ltd, Bury St Edmunds, Suffolk, UK). Forage and concentrate allocations were fed separately. Forage mangers were mounted on electronic load cells, while concentrates were dispensed through automatic feeders. Cows had ad libitum access to forage, which was offered to allow for feed refusals of at least 5%. Refusals were removed daily. The pre partum diet comprised ad libitum grass silage, with 2 kg per day of the lactating concentrate (Table 2) introduced from 2 weeks prior to the expected calving date. The post partum diet consisted of ad libitum grass silage and 8 kg of concentrate. From March 20th, all lactating cows were offered zero-grazed grass (Lolium perenne) supplemented with 4 kg concentrate. Grass was harvested and fed each morning. The chemical composition of the grass silage and zero-grazed grass is reported in Table 3. Cows were turned out to pasture on 30th July and were offered high-quality grazed grass (L. perenne spp.) plus 4 kg/day of concentrate. Cows remained at pasture day and night until mid-November, after which they were housed at night. After 1st December, the cows were housed day and night. Animals were fed grass silage ad libitum when housed.
Ingredient and chemical composition of concentrate supplement fed throughout the study

1Mean ± s.d.
2Estimated based on net energy values for ingredients (INRAtion, 1999, v. 2.7).
3Estimated based on 1 UFL = 1.7 Mcal/kg (Vermorel, Reference Vermorel1989).
Chemical composition of grass silage and zero-grazed grassFootnote 1

1 Values reported are mean ± s.d.
2 Estimated using near-infrared spectroscopy.
3 The net energy value of silage was calculated from its in vitro DMD concentration (O’Mara et al., Reference O’Mara, Caffrey and Drennan1997).
4 The net energy value of grass was determined according to Jarrige (1989).
5 Estimated based on 1 UFL = 1.7 Mcal/kg (Vermorel, Reference Vermorel1989).
Samples and animal measurements
Milk yield (kg) was recorded daily during morning and evening milkings using electronic milk meters (Dairy Master, Causeway, Co., Kerry, Ireland). Milk composition (fat, protein and lactose) was determined on 2 days per week from successive morning and evening milk samples by automated infrared absorption analysis using a Milkoscan 605 (Foss Electric, Hillerod, Denmark). Solids-corrected milk (SCM) yield was calculated using the equation of Tyrell and Reid (Reference Tyrell and Reid1965). All cows were dried off on 15th December, resulting in a mean lactation length of 290 days (s.d. 14 days) for the NA strain and 287 days (s.d. 16 days) for the NZ strain.
Samples of grass silage and concentrates offered were collected twice weekly for chemical analysis. Zero-grazed grass was sampled daily for dry matter (DM); samples were bulked by week for composition analysis.
Cow body weight (BW) (kg) and BCS (Lowman et al., Reference Lowman, Scott and Somerville1976) were recorded once weekly from 3 weeks before the expected calving date, immediately post calving, and once weekly thereafter until the end of lactation. The dry cows were weighed before feeding in the morning and the lactating cows were weighed after morning milking, before feeding. Data were lost for pre-calving BWs and BCS owing to a technical failure in the recording system. EB, BW and BCS profiles are therefore reported commencing from the week of calving.
Blood samples were collected three times weekly (Monday, Wednesday, Friday) by coccygeal venipuncture for 2 weeks before expected calving date, daily from day of calving until day 14 post partum, and twice weekly (Monday, Thursday) from day 15 to day 100 post partum. Sampling took place after the morning milking and before feeding. Samples were collected into vials containing lithium heparin as an anticoagulant. The samples were immediately centrifuged at 2000 × g for 10 min. The plasma was decanted and stored at −20°C until analysis.
Laboratory procedures and analysis
The DM, NDF, crude fibre and CP of the forage and concentrate samples were analysed as described by McNamara et al. (Reference McNamara, O’Mara, Rath and Murphy2003). Determination of in vitro dry matter digestibility (DMD) was carried out by near-infrared spectroscopy using a NIRsystems 6500 spectrophotometer (Perstorp Analytical Inc., Silver Springs, MD, USA). Silage pH was measured on the juice pressed from the silage using a glass electrode and a pH meter (Radiometer pHM2 standard pH meter-radiometer, Copenhagen, Denmark). The organic matter digestibility of grass was determined as described by Morgan et al. (Reference Morgan, Stakelum and Dwyer1989).
Blood plasma was analysed for glucose, non-esterified fatty acid (NEFA) and β-hydroxybutyrate (BHBA) concentrations by enzymatic colorimetry, using appropriate kits and an ABX Mira autoanalyzer (ABX Mira, Cedex, France). Plasma insulin concentration was determined using a solid-phase fluoroimmunoassay (AutoDELFIA, PerkinElmer Life and Analytical Sciences, Turku, Finland). The inter- and intra-assay coefficients of variation were 14.7% and 6.4%, respectively. Circulating IGF-1 concentrations were quantified using a validated double-antibody radioimmunoassay, following ethanol : acetone : acetic acid (60 : 30 : 10) extraction as described by Enright et al. (Reference Enright, Chapin, Moseley, Zinn, Kamdar, Krabill and Tucker1989). Recombinant human IGF-1 (supplied by R&D Systems Europe Ltd, Abingdon, Oxfordshire, UK) was used for iodination and standards (iodine-125 supplied by PerkinElmer (Unitech BD Ltd, Dublin, Ireland)), as described by Spicer et al. (Reference Spicer, Tucker and Adams1990). The rabbit anti-human IGF-I (AFP4892898) was obtained through the US National Hormone and Peptide Program (Dr A F Parlow, Scientific Director). Inter- and intra-assay coefficients of variation were 17.0% and 11.6%.
Energy balance
EB was estimated as the difference between energy intake and the sum of energy for maintenance and milk production. The French net energy (NE) system was used (Jarrige, 1989). The NE content of the concentrates offered was determined using the NE values (Unité Fourragère Lait – UFL) of ingredients (INRAtion, 1999, v. 2.7; Institut National de la Recherche Agronomique-Centre National d'Études et de Ressources en Technologie Avancée, Dijon, France). One UFL is the NE content of 1 kg of air-dry standard barley for milk production (Jarrige, 1989). The NE value of the grass silage was calculated based on its in vitro DMD concentration (O’Mara et al., Reference O’Mara, Caffrey and Drennan1997). The NE value of the grass was determined according to Jarrige (1989).
The following equations were used to determine the energy required for maintenance and the energy output in milk:
Energy requirement for maintenance: (UFL/day) = 1.4 + 0.6 BW/100
UFL requirement for milk: (UFL/kg of milk) = 0.0054FC + 0.0031PC + 0.0028LC − 0.015; where BW = body weight, FC = fat concentration, PC = protein concentration and LC = lactose concentration all in g/kg.
Data handling and statistical analysis
Daily milk yield and dry matter intake (DMI) data were collapsed into weekly means, and EB values were similarly calculated as weekly means. Repeated measures analyses of genotype effects on DMI, milk yield, milk composition, plasma metabolites, insulin and IGF-I, EB, BCS and BW were carried out using the MIXED procedure of SAS (SAS Institute, 1991). A first-order autoregressive covariance structure was used. Genotype, time and the interaction of genotype and time were included as fixed effects. Cow within genotype was included as a random effect. For illustrative purposes (Figure 4), BW and BCS lines were smoothed using the LOESS procedure in SAS (SAS Institute, 1991).
Data for plasma analytes during daily blood sampling from day 1 to day 14 post partum were collapsed into four mean values (day 1 to 3 = day 3; day 4 to 7 = day 7; day 8 to 10 = day 10; day 11 to 14 = day 14), and into weekly mean values for pre partum samples and post partum samples collected from days 14 to 100 post calving. This resulted in all cows having plasma analyte data for days −14, −7, 0, 3, 7, 10, 14, 21, 28, 35, 42, 49, 56, 63, 70, 84, 91 and 98 for statistical analysis. Plasma insulin, IGF-I and metabolite data were not normally distributed, and were log transformed prior to statistical analysis. Plasma analyte data for each cow was divided into two time periods (transition period from day 14 pre partum to day 28 post partum; post-transition period from day 29 to day 100 post partum) and the time periods were analysed separately to accommodate the constant variance assumption of repeated measures analysis. Results for plasma analytes were back-transformed and are presented as geometric means (and 95% CI).
Results
Milk production and composition
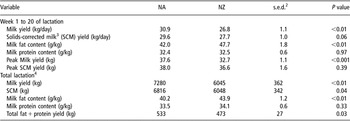
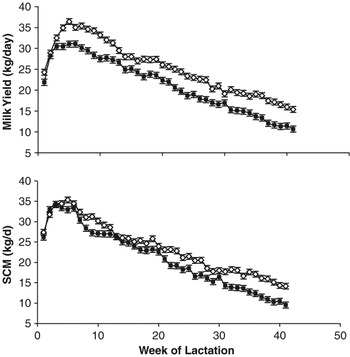
The NA strain had a greater milk yield (P < 0.01) during week 1 to 20 of lactation, and tended to have a greater SCM yield (P = 0.06) compared with the NZ strain (Table 4). The NA strain had a higher (P < 0.001) peak milk yield, but peak SCM yield did not differ between the strains (P = 0.39). Mean daily SCM yield from week 20 until the end of lactation was 18.8 and 15.1 kg (P < 0.01, s.e.d. 1.4 kg) for the NA and NZ strains, respectively.
Effect of strainFootnote 1 of Holstein Friesian on milk production and composition

1 NA = North American Holstein Friesian; NZ = New Zealand Holstein Friesian; SCM = solids-corrected milk.
2 s.e.d. = standard error of difference.
3 Calculated as described by Tyrell and Reid (Reference Tyrell and Reid1965).
4 Mean lactation length was 287 days for NZ and 290 days for NA strain.
Milk fat concentration over the full lactation was greater for NZ cows (P < 0.01), while milk protein concentration did not differ between the strains (P = 0.33). Total combined yield of milk fat and protein over the full lactation was 12.7% greater (P = 0.03) for the NA strain (Table 4). The NA strain produced 20.4% greater volume (P < 0.01) of milk over the full lactation compared with the NZ strain; total lactation SCM yield was 12.7% greater (P = 0.04) for the NA strain (Figure 1).
Effect of strain of Holstein Friesian on milk yield and solids-corrected milk yield (SCM) (◊ = North American Holstein Friesian; ▪ = New Zealand Holstein Friesian). The P values for the effects of strain, week and interaction between strain and week on mean daily milk yield were 0.002, <0.001 and 0.96, respectively. The s.e.d. was 1.18 kg/day. The P values for the effects of strain, week and interaction between strain and week on mean daily SCM yield were 0.04, <0.0001 and 0.98, respectively. The s.e.d. was 1.05 kg/day.

Dry matter intake, energy balance and feed efficiency
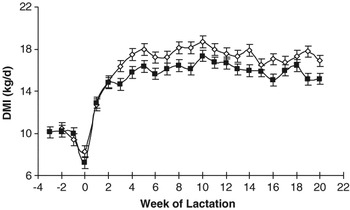
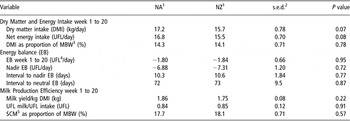
Mean DMI (P = 0.07) and net energy intake (P = 0.08) tended to be greater for NA compared with NZ cows (Figure 2) during week 1 to 20 of lactation. When expressed as a percentage of metabolic BW, however, the strains had similar (P = 0.78) mean daily DMI over the same time period (Table 5).
Effect of strain of Holstein Friesian on dry matter intake (◊ = North American Holstein Friesian; ▪ = New Zealand Holstein Friesian). The P values for the effects of strain, week and interaction between strain and week on daily dry matter intake from week 1 until week 20 post partum were 0.07, <0.001 and 0.90, respectively. The s.e.d. was 0.8 kg/day.

Effect of strain on energy balance and feed intake

1NA = North American Holstein Friesian; NZ = New Zealand Holstein Friesian.
2s.e.d. = standard error of difference.
3MBW = metabolic bodyweight, calculated as B0.75, where B = body weight (kg).
41 UFL = net energy for lactation equivalent of 1 kg standard air-dry barley (Jarrige, 1989).
5SCM = solids-corrected milk.
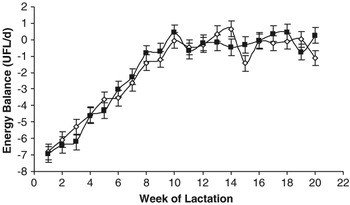
The NA and NZ strains had similar mean daily calculated EB during week 1 to 20 (P = 0.95) of lactation (Figure 3). The strains also had a similar magnitude of EB nadir (P = 0.72). In addition, the timing of EB nadir (P = 0.77) and interval to neutral EB (P = 0.87) did not differ between the two strains (Table 5).
Effect of strain of Holstein Friesian on energy balance (◊ = North American Holstein Friesian; ▪ = New Zealand Holstein Friesian) from week 1 to 20 of lactation. The P values for the effects of strain, week and interaction between strain and week were 0.95, <0.001 and 0.94, respectively. The s.e.d. was 0.6 UFL/day.

The NA and NZ strains had similar milk yield per kg of DMI (P = 0.22), and similar output of milk energy per unit of net energy intake (P = 0.91), for week 1 to 20 of lactation (Table 5). SCM yield as a proportion of metabolic BW did not differ between the strains (P = 0.57).
Body weight and body condition score
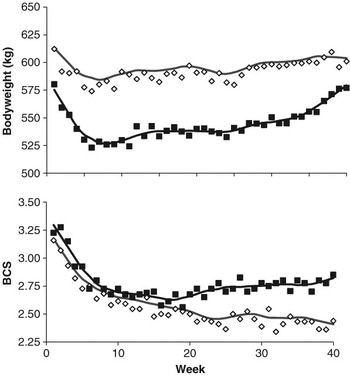
The NA and NZ strains had similar BCS at the beginning of lactation (3.17 v. 3.22, respectively; s.e.d = 0.18; P = 0.78). The strains had lost a similar amount of BCS by week 20 of lactation (0.65 v. 0.55 respectively; s.e.d = 0.15; P = 0.53). Thereafter, the NZ strain began to increase in BCS whereas the NA strain did not, resulting in a greater BCS for NZ compared with NA by the end of lactation (2.85 v. 2.43 respectively; s.e.d = 0.15; P = 0.02). Mean BW across the full lactation was greater for NA compared with NZ cows (596 v. 544 kg, respectively; s.e.d = 21.9; P = 0.02) (Figure 4).
Effect of strain of Holstein Friesian on body condition score (BCS) and body weight (◊ = North American Holstein Friesian; ▪ = New Zealand Holstein Friesian). The P values for the effects of strain, week and interaction between strain and week on weekly BCS were 0.16, <0.001 and 0.009, respectively. The s.e.d. was 0.08 BCS units. The P values for the effects of strain, week and interaction between strain and week on weekly body weight were 0.02, <0.001 and 0.57, respectively. The s.e.d. was 15.5 kg. Figures are presented with LOESS-smoothed lines for illustrative purposes.

Plasma insulin, IGF-I and metabolites
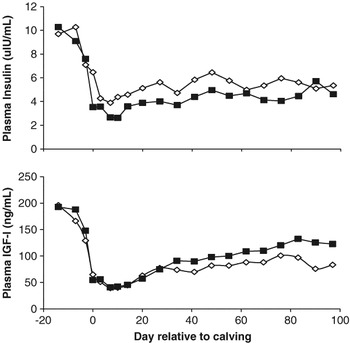
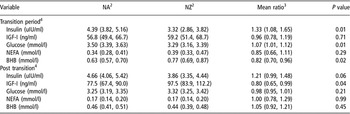
Mean plasma insulin concentration was higher (P = 0.01) for the NA strain during the transition period, and tended to be higher (P = 0.06) from day 29 until day 100 (Figure 5; Table 6). There were no differences between the strains in mean plasma concentrations of IGF-I in the transition period (P = 0.71). However, the NZ strain had higher (P = 0.04) plasma IGF-I concentrations from day 29 to 100 of lactation (Figure 5; Table 6).
Effect of strain of Holstein Friesian on plasma insulin and IGF-I concentrations (◊ = North American Holstein Friesian; ▪ = New Zealand Holstein Friesian). The P values for the effect of strain on insulin concentration were 0.01 and 0.06 for the transition period (2 week pre partum to day 28 post partum) and post-transition period (day 29 to day 100 post partum), respectively. The P values for the effect of strain on IGF-I concentration were 0.71 and 0.04 for the transition and post-transition periods, respectively. There were no significant strain-by-time interactions observed for either insulin or IGF-I across the entire experimental period (P > 0.05).

Effect of strain on plasma concentrationsFootnote 1 of insulin, IGF-I and metabolites

1 Geometric mean (95% CI).
2 NA = North American Holstein Friesian; NZ = New Zealand Holstein Friesian.
3 Ratio of geometric means (95% CI).
4 Transition = day 15 pre partum to day 28 post partum; Post transition = day 29 to 100 post partum.
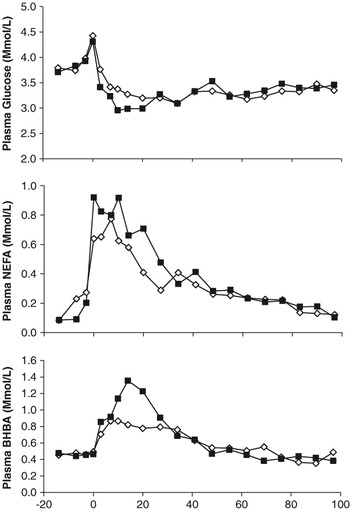
Plasma glucose concentration was higher for the NA strain during the transition period (P = 0.01), but differences were not observed in the post-transition period (day 29 to 100 of lactation) (P = 0.21) (Figure 6; Table 6). There were no differences observed between the strains in mean plasma NEFA concentration, either during the transition period (P = 0.29) or during the post-transition period (P = 0.99). Plasma BHBA concentration was higher for NZ compared with NA cows during the transition period (P = 0.02), but both strains had similar mean plasma BHBA concentrations during the post-transition period (P > 0.05).
Effect of strain of Holstein Friesian on plasma glucose, non-esterified fatty acid (NEFA) and β-hydroxybutyrate (BHBA) concentrations (◊ = North American Holstein Friesian; ▪ = New Zealand Holstein Friesian). The P values for the effect of strain on glucose concentration were 0.01 and 0.21 for the transition period (2 week pre partum to day 28 post partum) and post-transition period (day 29 to day 100 post partum), respectively. The P values for the effect of strain on NEFA concentration were 0.29 and 0.99 for the transition and post-transition periods, respectively. The P values for the effect of strain on BHBA concentration were 0.02 and 0.45 for the transition and post-transition periods, respectively. There were no significant strain-by-time interactions observed for glucose, NEFA or BHBA concentrations across the entire experimental period (P > 0.05).

Discussion
The primary objective of this study was to characterize the EB, nutrient partitioning and metabolic profiles of the NA and NZ strains, which differ in their genetic merit for milk production, BCS and fertility performance (Horan et al., Reference Horan, Mee, O’Connor, Rath and Dillon2005b). The lack of difference between the EB profiles of the strains during early lactation was particularly interesting given the extensive reports of negative genetic relationships between milk yield and both EB and BCS (Veerkamp and Thompson, Reference Veerkamp and Thompson1999; Berry et al., Reference Berry, Buckley, Dillon, Evans, Rath and Veerkamp2003).
In general, cows of higher genetic merit for milk yield have greater milk energy output in early lactation, which is met by a combination of increased DMI and body tissue mobilization (Bauman, Reference Bauman2000). The higher milk yield recorded for the NA cows in the present study is a result of more intensive genetic selection for milk yield compared with NZ cows (Kolver et al., Reference Kolver, Napper, Copeman and Muller2000). Peak daily milk yield was higher for the NA strain as had been reported previously (Horan et al., Reference Horan, Dillon, Faverdin, Delaby, Buckley and Rath2005a); however, peak yield did not differ between the groups when expressed as SCM. This was primarily due to the higher milk fat concentration of the NZ strain; mean milk protein concentration was not different between the groups. The NZ strain has previously exhibited higher milk fat and milk protein in pasture-based production systems (Horan et al., Reference Horan, Dillon, Faverdin, Delaby, Buckley and Rath2005a). Increasing fat and protein yield in a given volume of milk has been a key breeding objective in the New Zealand breeding programme for many years (Harris and Kolver, Reference Harris and Kolver2001). It can be therefore concluded that the strains experienced a comparable magnitude of milk energy demand at peak SCM production.
The NA strain had approximately 1.5 kg per day greater DMI, equivalent to 1.26 UFL of NE intake per day, compared with the NZ strain from week 1 to 20 post partum. However, the daily energy requirements for milk and maintenance during this time were, respectively, approximately 1.0 and 0.30 UFL greater for the NA strain resulting in similar EB profiles for the strains. The higher DMI of the NA cows may be attributable to their greater BW, as BW is highly correlated with DMI (Veerkamp and Thompson, Reference Veerkamp and Thompson1999). The difference in BW between the strains is a direct result of divergent genetic selection objectives within the strains’ respective breeding programmes. The NA strain has been selected for increased body size (Hansen, Reference Hansen2000), whereas BW is afforded a negative economic weighting in NZ selection indices (Harris et al., 1996).
Consistent with the EB results, the BCS profiles of the strains were not different for weeks 1 to 20 of lactation. The profiles subsequently diverged however, as the NZ cows began to increase BCS while the NA cows failed to gain BCS, indicating that the NZ cows were in a more positive nutritional status during mid- to late-lactation. Similarly, McCarthy et al. (Reference McCarthy, Berry, Dillon, Rath and Horan2007a) reported no difference in the rate of BCS change between NA and NZ cows during early lactation, but a greater rate of BCS accretion post nadir for NZ cows.
Differences in milk yield between high and low genetic merit cows are less on a high grass diet because intake is limited by constraining factors in the diet such as physical bulk, whereas on high-concentrate diets, high-genetic-merit cows have the advantage of higher DMIs (Kennedy et al., Reference Kennedy, Dillon, Delaby, Faverdin, Stakelum and Rath2003). The NA strain achieves a lower proportion of potential DMI and milk yield in a pasture system compared with the NZ strain, which is evidenced by its greater milk yield response to concentrate supplementation (Horan et al., Reference Horan, Dillon, Faverdin, Delaby, Buckley and Rath2005a). Similarly, McCarthy et al. (Reference McCarthy, Horan, Rath, Linnane, O’Connor and Dillon2007b) reported a lower substitution rate of pasture for concentrate by the NA strain compared with the NZ strain. This explains the greater milk yield response of NA cows to concentrate supplementation, and demonstrates that the greater lactation energy demands of the NA strain are not satisfied by a predominantly pasture diet. Furthermore, the same study noted that despite their lower milk production, NZ cows spend a greater proportion of time grazing than NA cows and tend to increase grazing time when feed allowance is reduced, suggesting that the NZ strain may be more adapted to a grazing scenario (McCarthy et al., Reference McCarthy, Horan, Rath, Linnane, O’Connor and Dillon2007b). The BCS profiles observed in the current study and similar strain comparisons (Roche et al., Reference Roche, Berry and Kolver2006; McCarthy et al., Reference McCarthy, Berry, Dillon, Rath and Horan2007a) indicate that the inability of the NA strain to meet energy demands from pasture persists through lactation. In contrast, the NZ strain is capable of ingesting sufficient energy for milk production and body tissue accretion from mid-lactation in a pasture-based system.
The SCM yield of the NA cows was greater than that of NZ cows from approximately week 20 until the end of lactation, coincident with the divergence of the BCS profiles of the strains. Similarly, Horan et al. (Reference Horan, Faverdin, Delaby, Rath and Dillon2006) observed that NA cows had a greater milk yield response to additional concentrate supplementation than NZ cows. Energy partitioning results in the current study were not confounded by pregnancy status as breeding was delayed due to a concurrent embryo collection study, which prevented cows from becoming pregnant during the duration of the study. The divergence in the milk production and BCS profiles of the strains therefore indicates that the NA cows maintain preferential partitioning of nutrients to the mammary gland for a longer duration than NZ cows.
While it is well established that nutrient partitioning changes with the stage of lactation (Kirkland and Gordon, Reference Kirkland and Gordon2001), the temporal change in the magnitude of differences between the strains is an interesting feature of the present study. Genetic selection for increased milk yield has been associated with the shifting of homeorhetic controls, such that milk production is maximized from ingested nutrients and available body tissue reserves, particularly during early lactation (Bauman, Reference Bauman2000). However, the NA and NZ strains had a comparable degree of NEB and a similar propensity for body tissue mobilization during early lactation; differences in nutrient partitioning did not become manifest until after the time of peak milk energy demand. This implies that strain differences exist in the timescale of homeorhetic adaptations during lactation, with the NZ strain affording a greater metabolic priority to replenishment of body reserves at an earlier stage of lactation than the NA strain.
The NA cows had increased plasma insulin concentrations during the transition period, despite the similar calculated EB of the strains at this time. Differences in plasma insulin concentration, though statistically significant, were modest. In contrast, others have reported lower plasma insulin concentration for cows of higher genetic merit for milk yield (Gutierrez et al., Reference Gutierrez, Gong, Bramley and Webb2006). The increased plasma glucose concentration for the NA cows was consistent with the observed differences in insulin concentrations.
The temporal patterns of plasma IGF-I concentration observed were similar to previous reports, with a decline at parturition and a gradual increase thereafter (McGuire et al., Reference McGuire, Bauman, Dwyer and Cohick1995). While the strains had similar plasma IGF-I profiles during the transition period, plasma IGF-I was higher for NZ cows from approximately day 30 of lactation. This occurred despite the similar EB profiles between the strains, and the higher plasma insulin concentrations in the NA cows.
Expression of the IGF-I gene in the liver is acutely responsive to nutritional status. The decline in IGF-I concentration at parturition is due to the reduced expression of growth hormone receptor 1A (GHR-1A) and IGF-I mRNAs, coincident with a period of liver refractoriness to growth hormone (Radcliff et al., Reference Radcliff, McCormack, Crooker and Lucy2003). A several-fold increase in insulin has been shown to stimulate hepatic expression of GHR-1A and IGF-I mRNA (Butler et al., Reference Butler, Marr, Pelton, Radcliff, Lucy and Butler2003; Rhoads et al., Reference Rhoads, Kim, Leury, Baumgard, Segoale, Frank, Bauman and Boisclair2004). The higher insulin concentration for NA cows during the transition period in the current study may have been insufficient to elicit a detectable increase in plasma IGF-I concentration. Indeed, Radcliff et al. (Reference Radcliff, McCormack, Keisler, Crooker and Lucy2006) showed that restricting DMI in early lactation decreased the rate of post partum increase in liver GHR mRNA and tended to reduce plasma IGF-I concentration, but had no effect on liver IGF-I mRNA. This indicates that post-transcriptional and/or post-translational mechanisms may also exert control on post partum IGF-I concentrations. Plasma IGF-I was higher for NZ cows from approximately day 30 to 100 of lactation, despite the similar EB profiles and lower circulating insulin concentrations compared with NA cows. Crooker et al. (2001) likewise showed that although post partum EB did not differ between cows of high and low genetic merit, plasma IGF-I was lower for the high-genetic-merit cows. Genetic selection for milk yield may therefore affect the somatotropic axis during early lactation independent of EB.
Gross energy efficiency may be defined as energy in the milk produced divided by the total energy intake (Brody, Reference Brody1945). Gross efficiency is greater if calculated when cows are mobilizing body tissue in support of milk production, because the potential contribution of body reserves to milk energy output is not considered (Veerkamp and Emmans, Reference Veerkamp and Emmans1995). The strains had a similar degree of BCS change over the first 20 weeks of lactation in the present study; the results thus demonstrate that the NA and NZ strains have a similar level of milk production per unit of energy intake or BW, net of differences in body fat mobilization. This is consistent with the review of Bauman et al. (Reference Bauman, McCutcheon, Steinhour, Eppard and Sechen1985), who stated that there is little genetic variation in the partial efficiencies of metabolizable energy utilization for maintenance or milk production. There is however a considerable degree of genetic variation in gross efficiency, principally due to a dilution of maintenance requirements for higher yielding cows (Veerkamp and Emmans, Reference Veerkamp and Emmans1995). Similarly, Yerex et al. (Reference Yerex, Young, Donker and Marx1988) showed that cows selected for lower BW had lower maintenance requirements, and consequently a higher gross efficiency than heavier cows with similar levels of milk yield. In the present study, the lower milk production of the NZ cows was offset by lower DMI and BW to result in similar milk production efficiencies for the strains.
Conclusions
This study compared the EB, metabolic profiles and nutrient partitioning of the NA and NZ strains of Holstein Friesian. The NZ strain had similar SCM yield, lower maintenance requirements and lower DMI in early lactation compared with the NA strain, resulting in no difference in EB between the strains. The similarity in early lactation EB of the strains was reflected in their respective metabolic and endocrine profiles during that time. The NZ cows began to replenish BCS at an earlier stage of lactation, and had greater plasma concentrations of IGF-I from approximately week 4 of lactation. In conclusion, the results of this study do not support the premise that the NA cows experience a greater dietary energy deficit during the transition period due to their superior genetic potential for milk yield. The results do however indicate that NZ cows begin to partition nutrients towards body reserves during mid-lactation, whereas NA cows continue to preferentially partition nutrients to milk for a longer duration post partum.
Acknowledgements
The authors would like to thank Mr J.P. Murphy, Mr J. Keneally and the Moorepark farm staff for management and care of the animals. The technical assistance of Mr T. Condon, Ms N. Galvin and Ms N Hynes is also appreciated. National Development Plan funding is gratefully acknowledged.